. 2022 Aug 5;131(4):290-307.
doi: 10.1161/CIRCRESAHA.121.320530. Epub 2022 Jul 18.

Unfolded Protein Response Differentially Modulates the Platelet Phenotype

Affiliations

Unfolded Protein Response Differentially Modulates the Platelet Phenotype

Kanika Jain et al. Circ Res. .

Abstract

Background: Unfolded protein response (UPR) is a multifaceted signaling cascade that alleviates protein misfolding. Although well studied in nucleated cells, UPR in absence of transcriptional regulation has not been described. Intricately associated with cardiovascular diseases, platelets, despite being anucleate, respond rapidly to stressors in blood. We investigate the UPR in anucleate platelets and explore its role, if any, on platelet physiology and function.

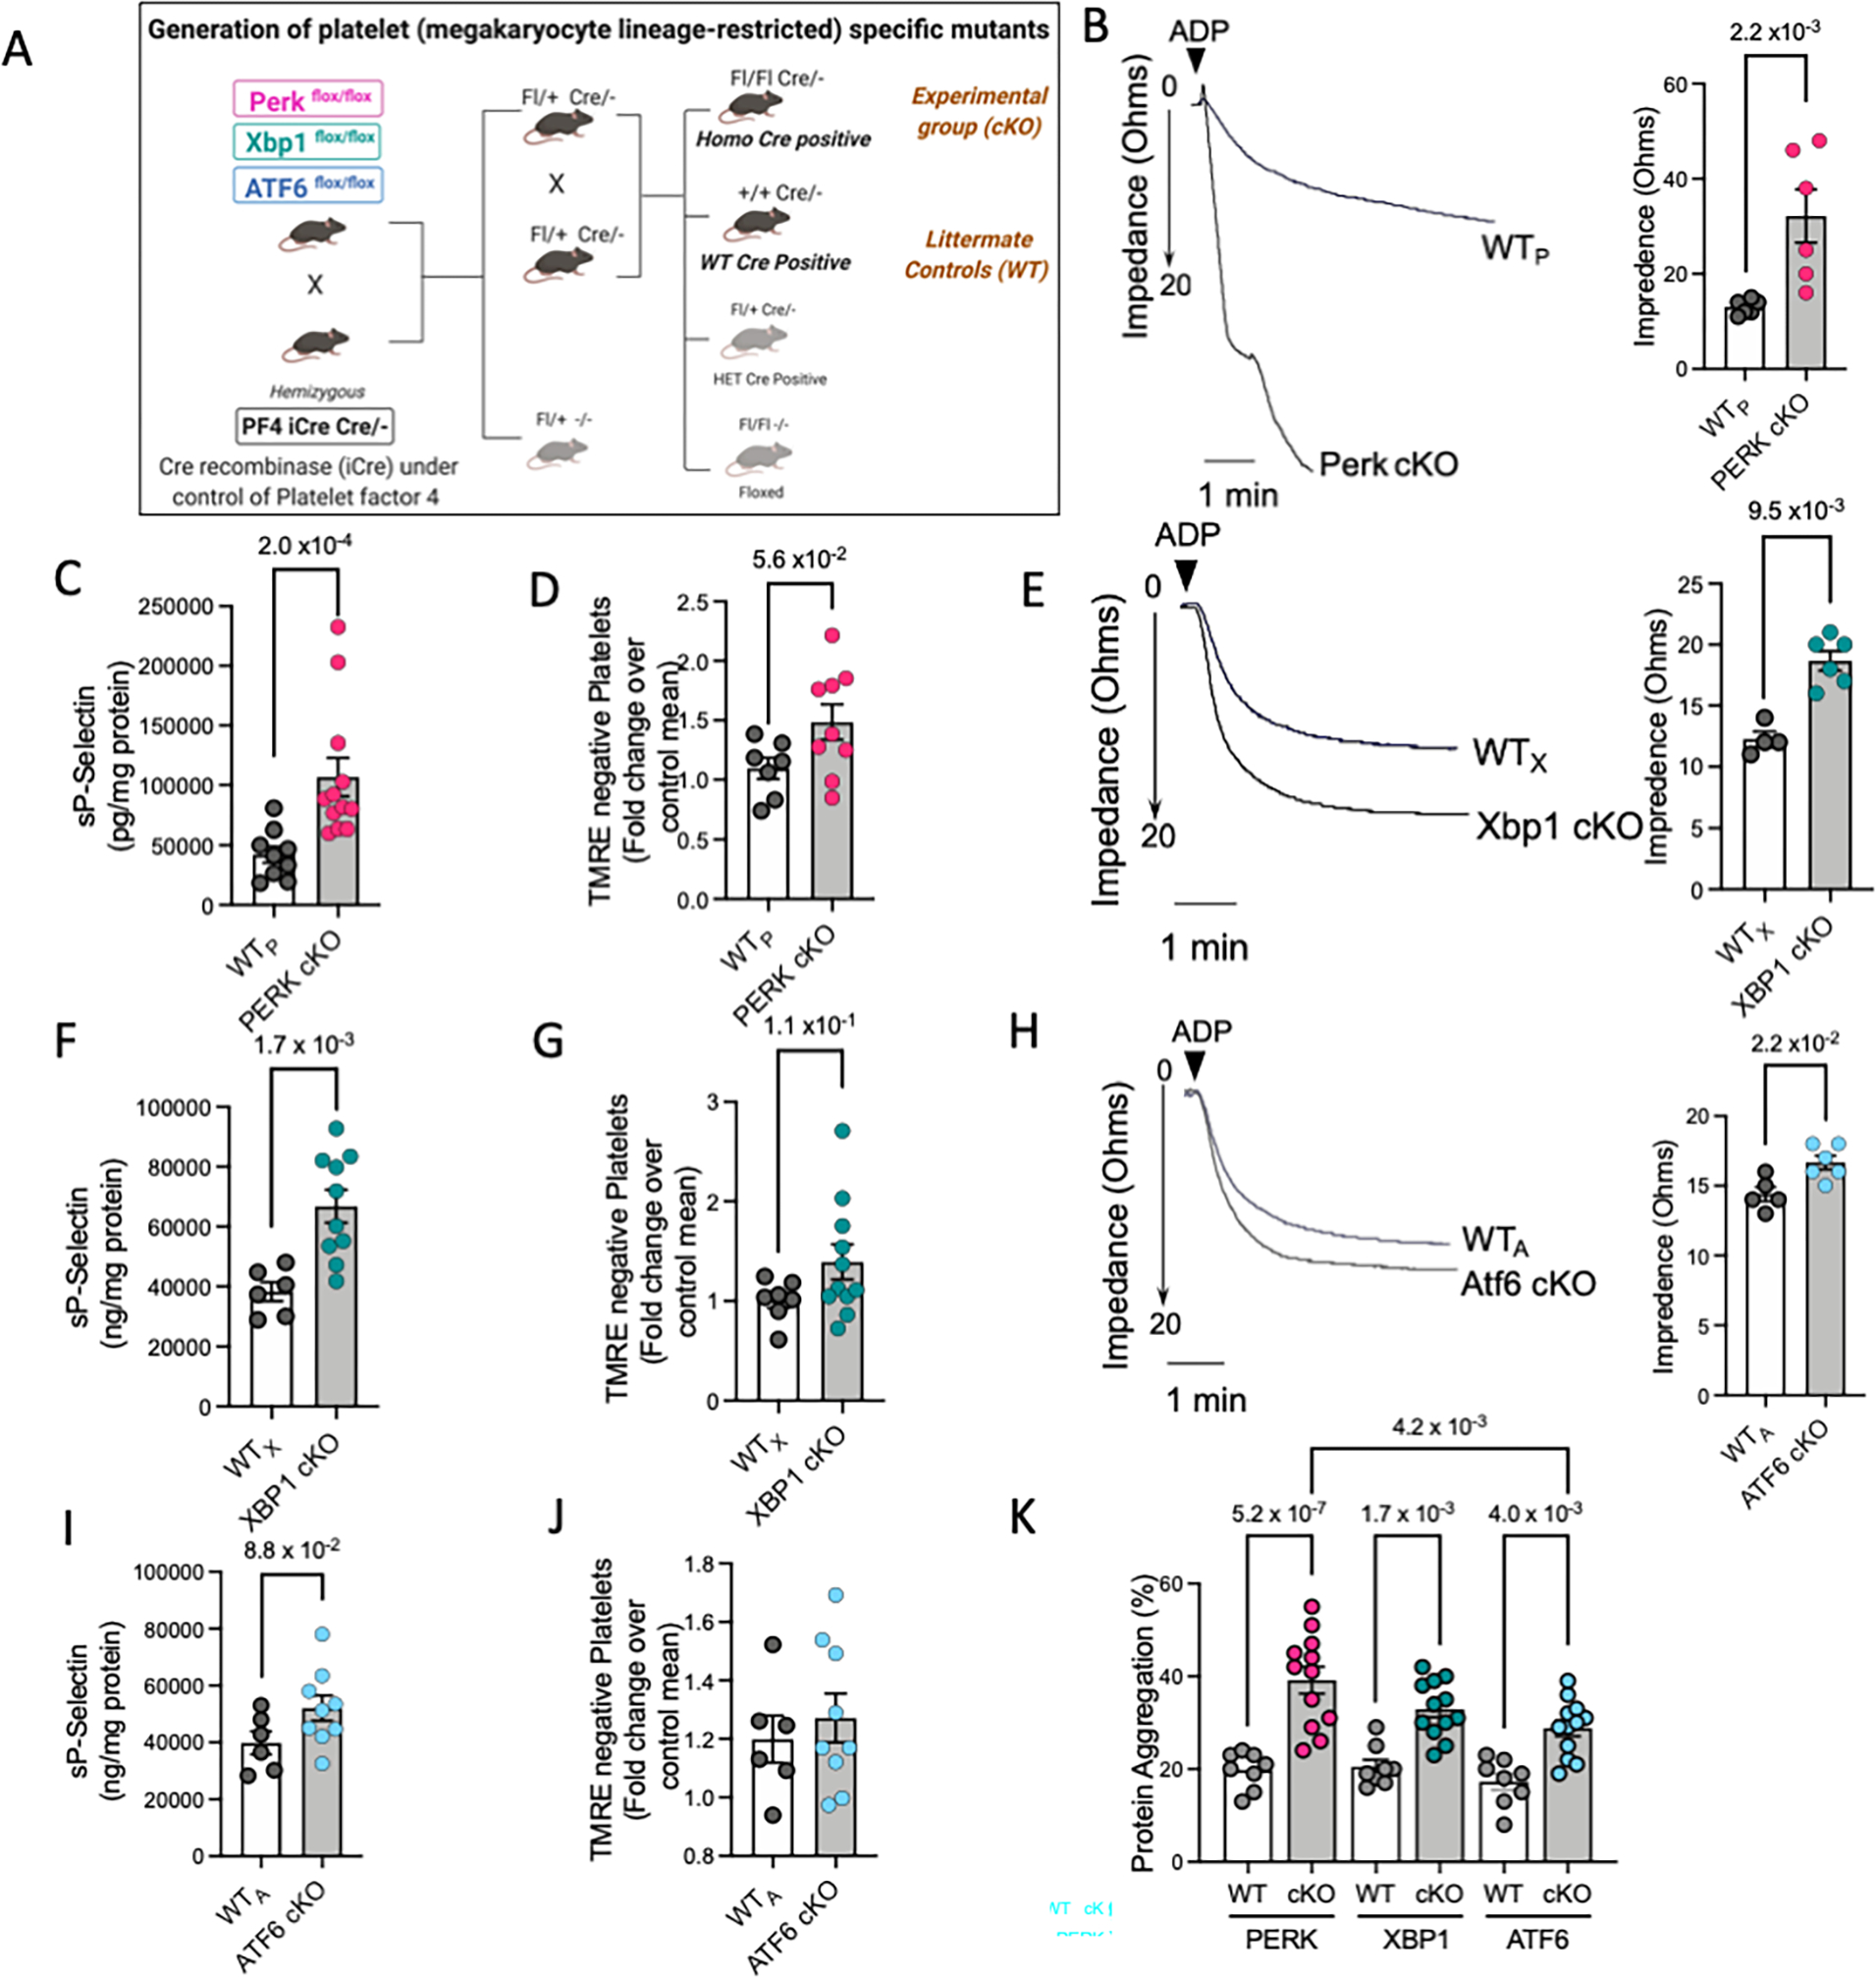
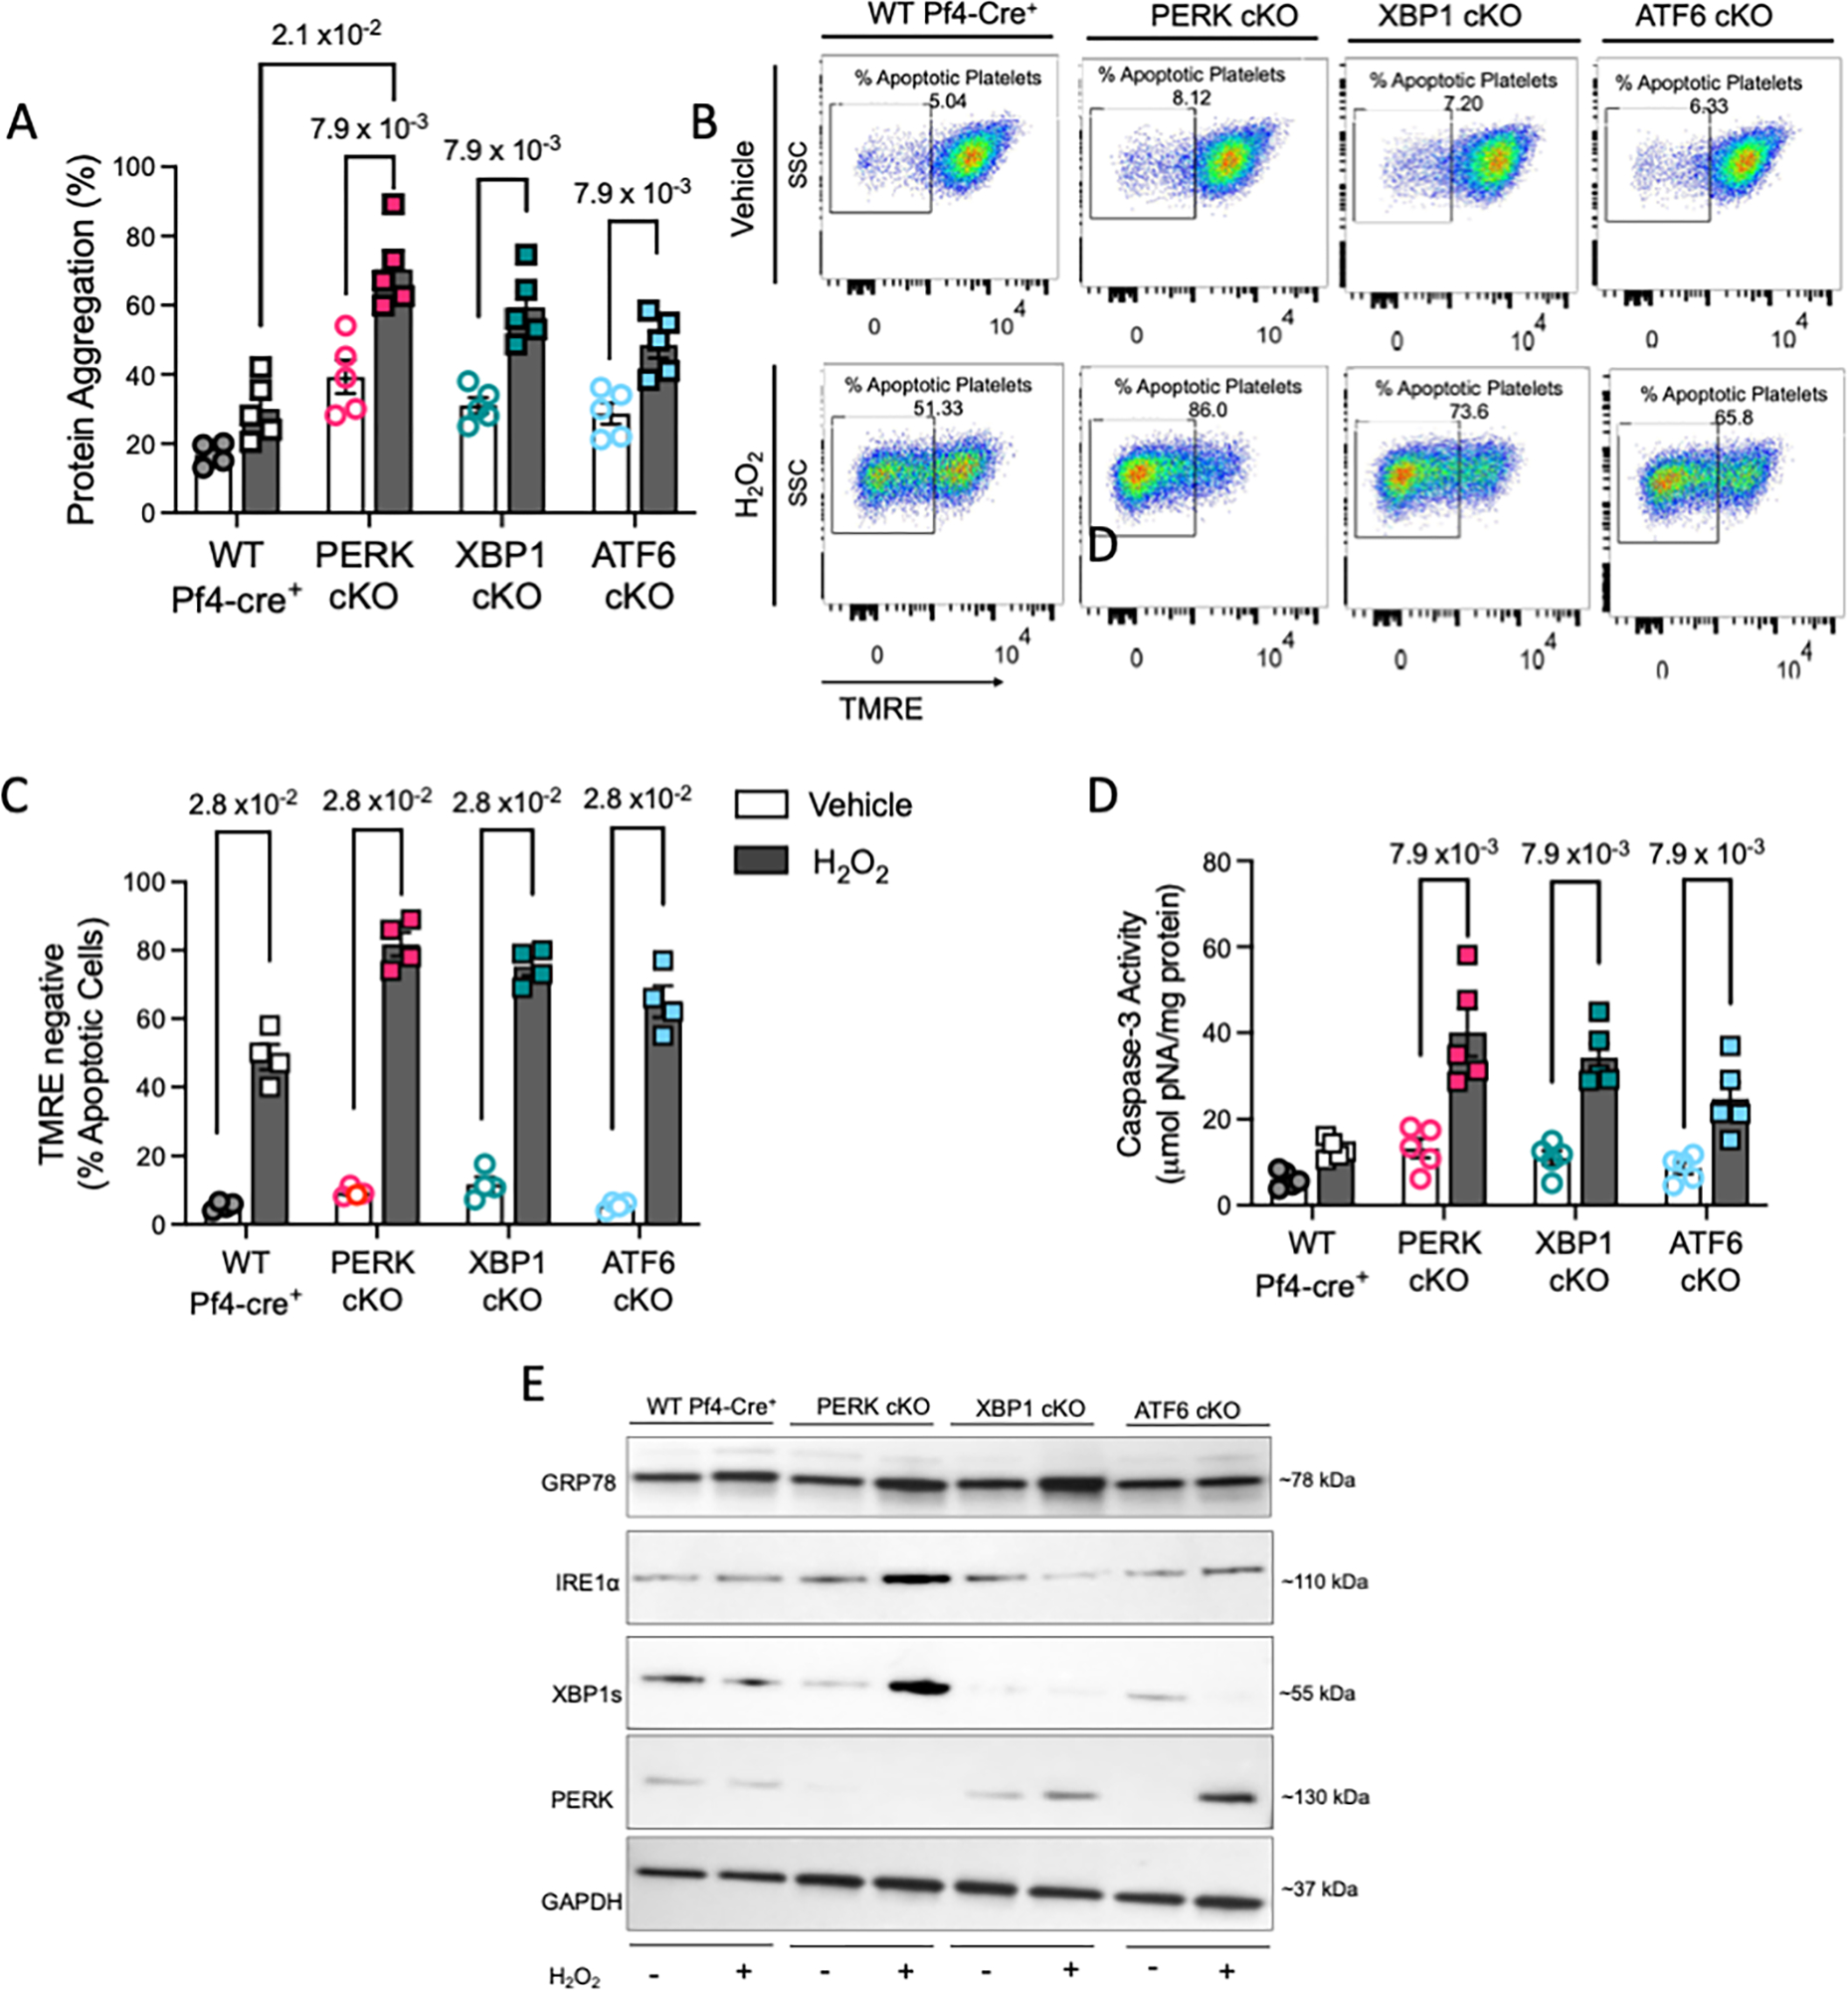
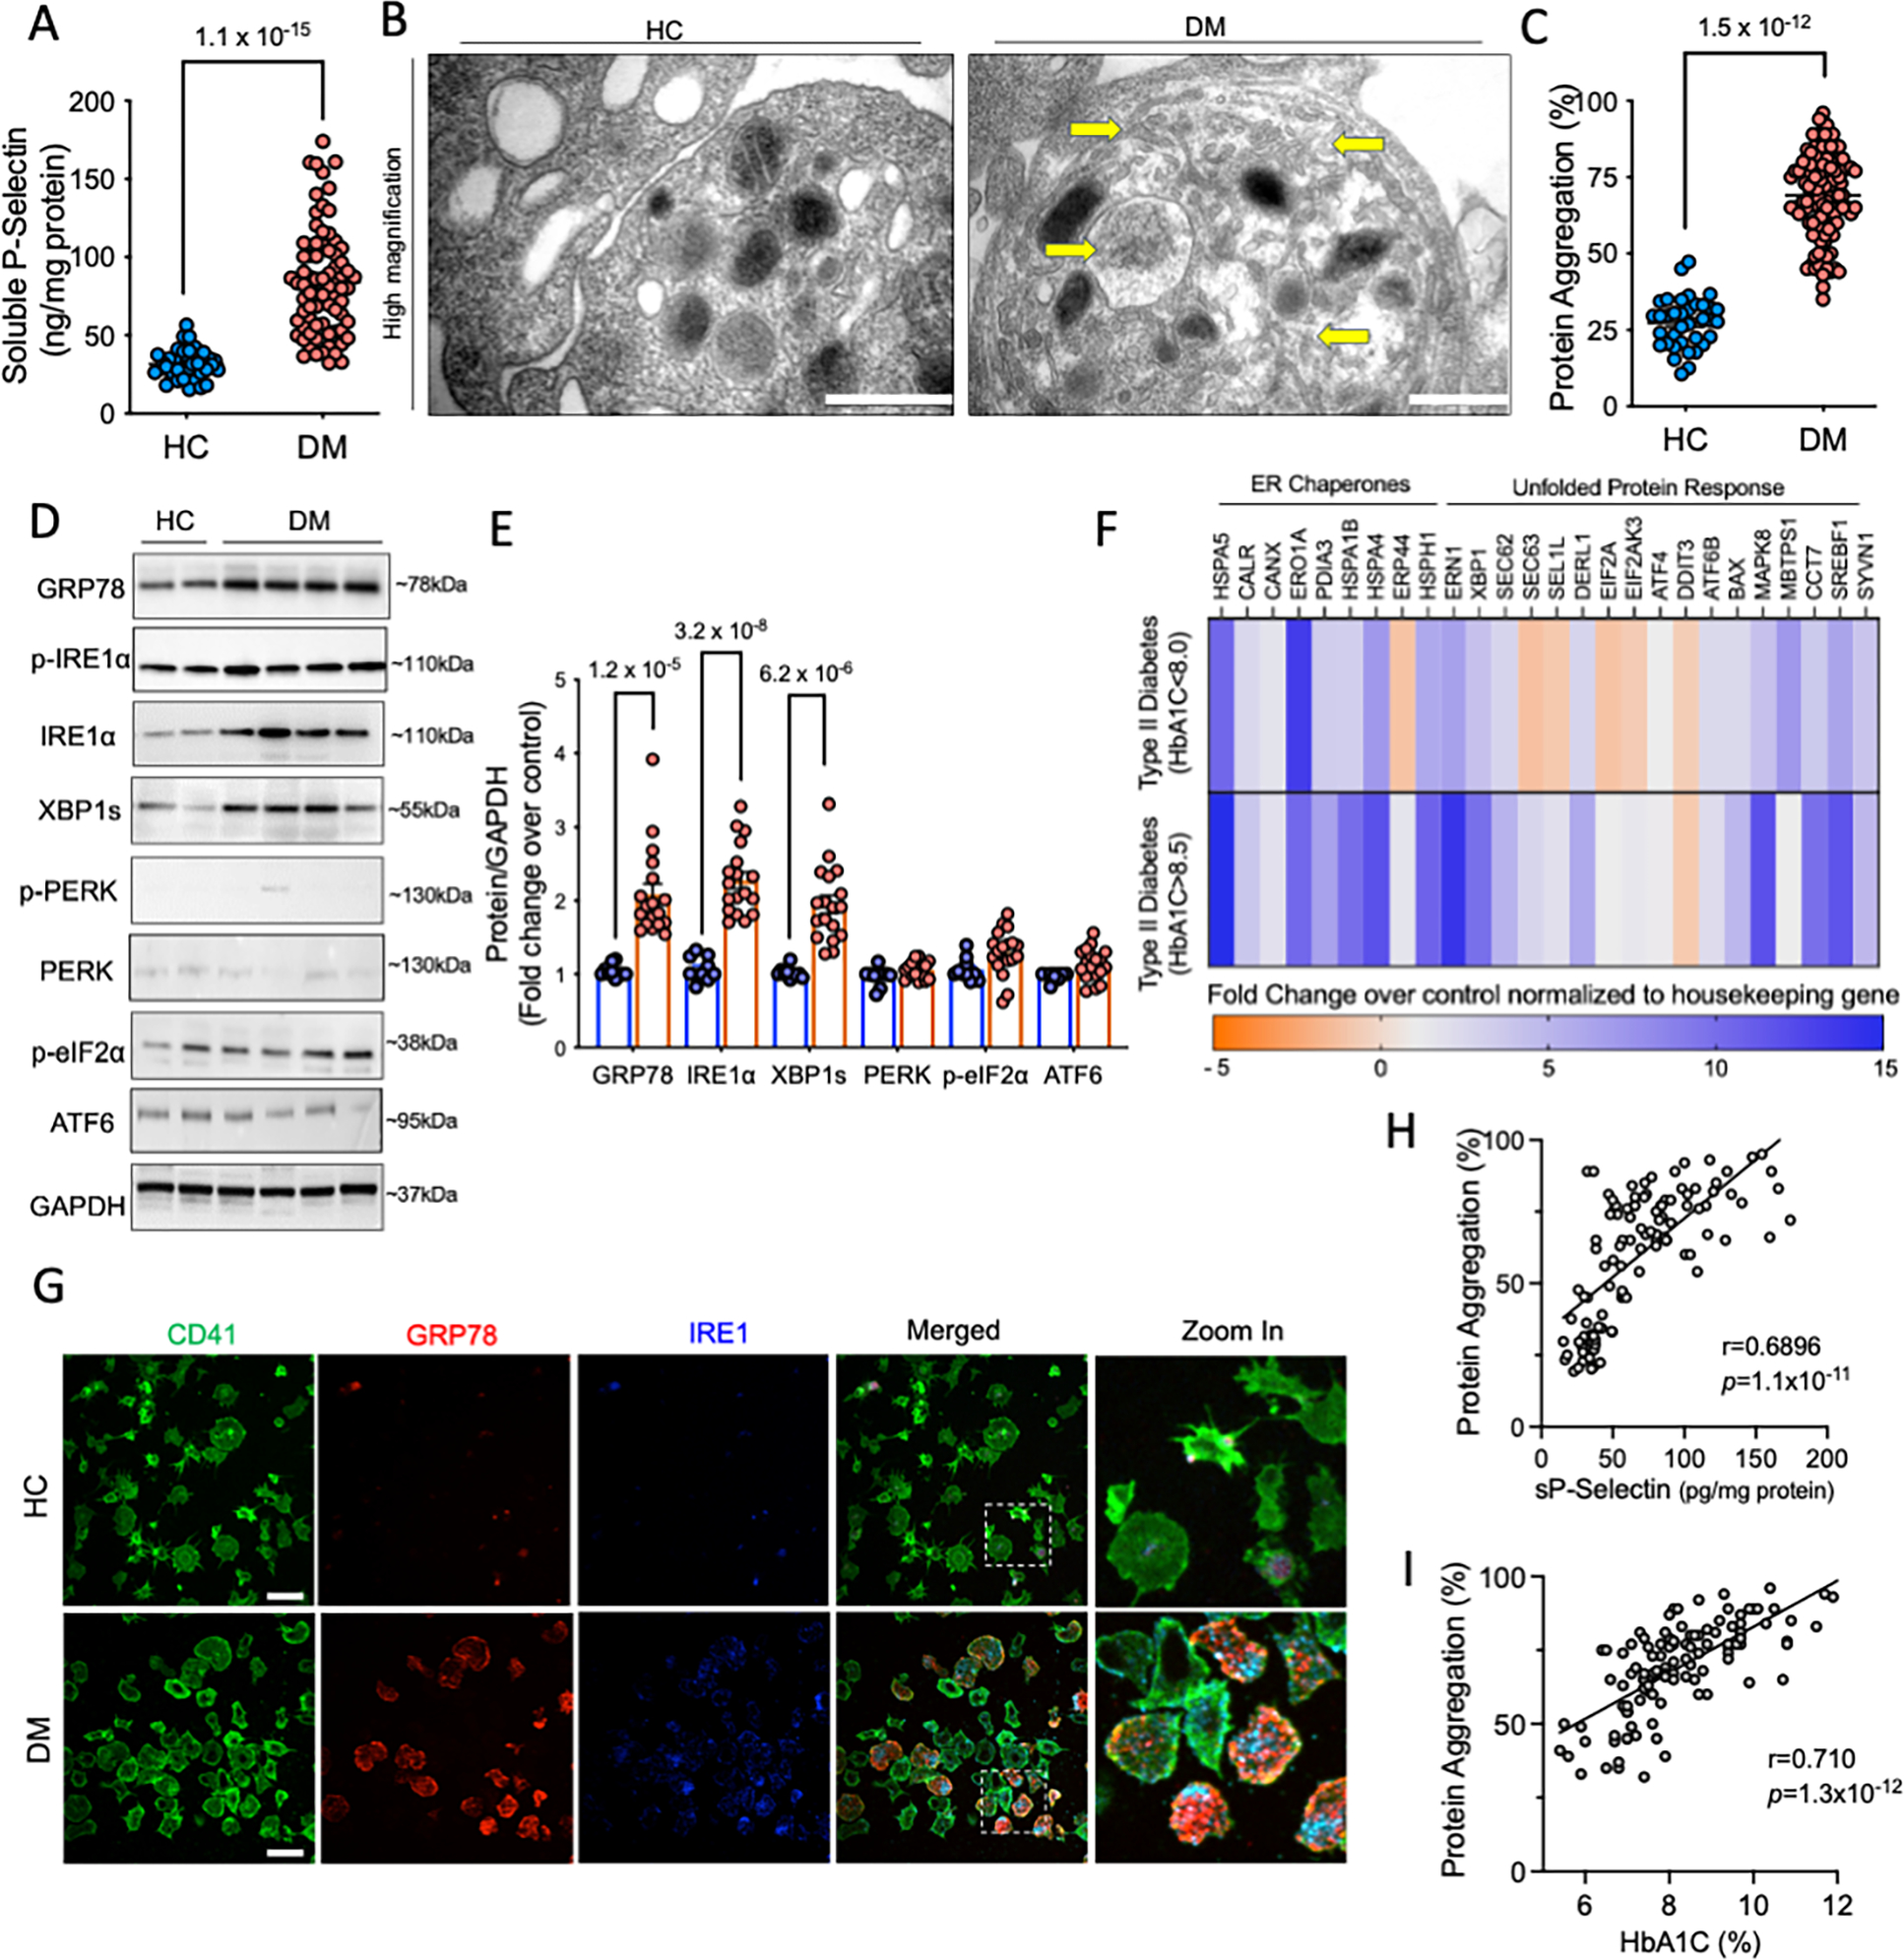
Methods: Human and mouse platelets were studied using a combination of ex vivo and in vivo experiments. Platelet lineage-specific knockout mice were generated independently for each of the 3 UPR pathways, PERK (protein kinase RNA [PKR]-like endoplasmic reticulum kinase), XBP1 (X-binding protein), and ATF6 (activating transcription factor 6). Diabetes patients were prospectively recruited, and platelets were evaluated for activation of UPR under chronic pathophysiological disease conditions.

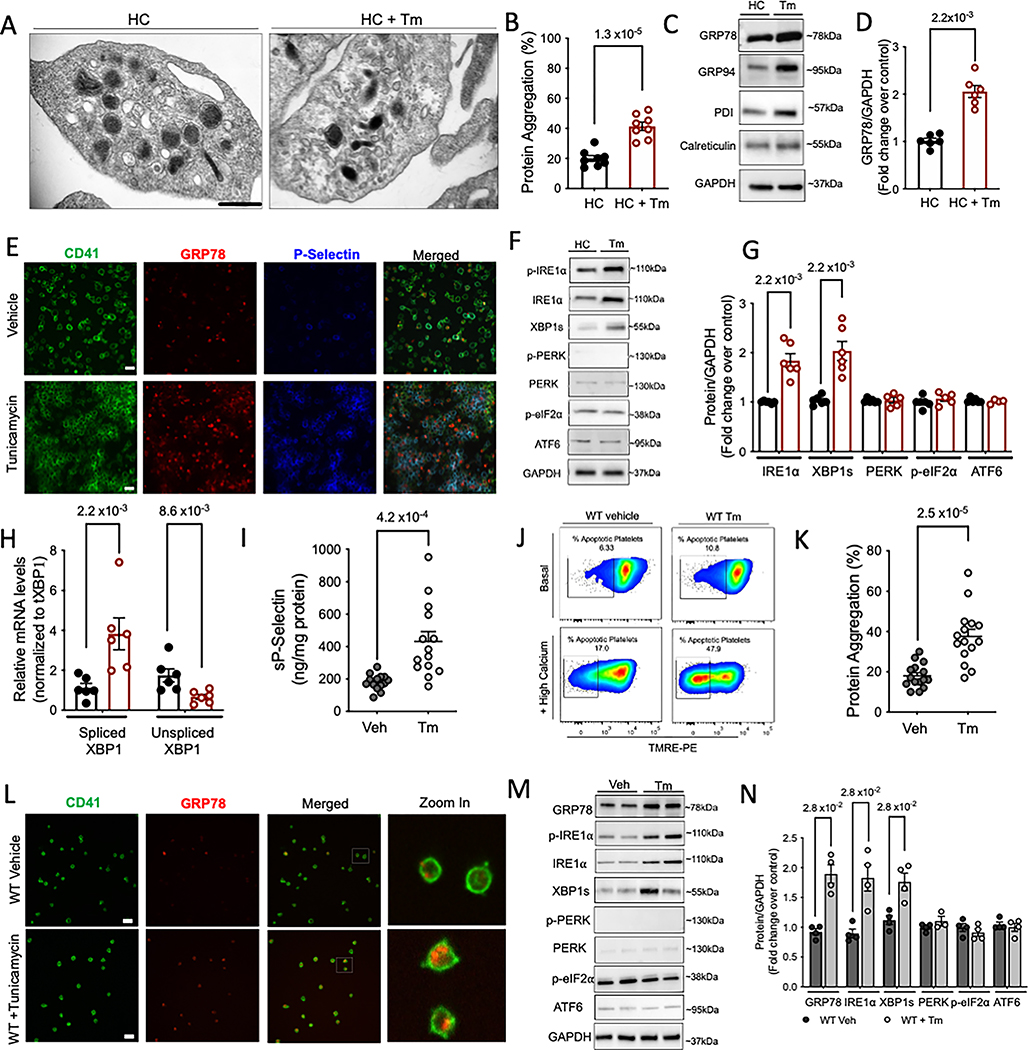
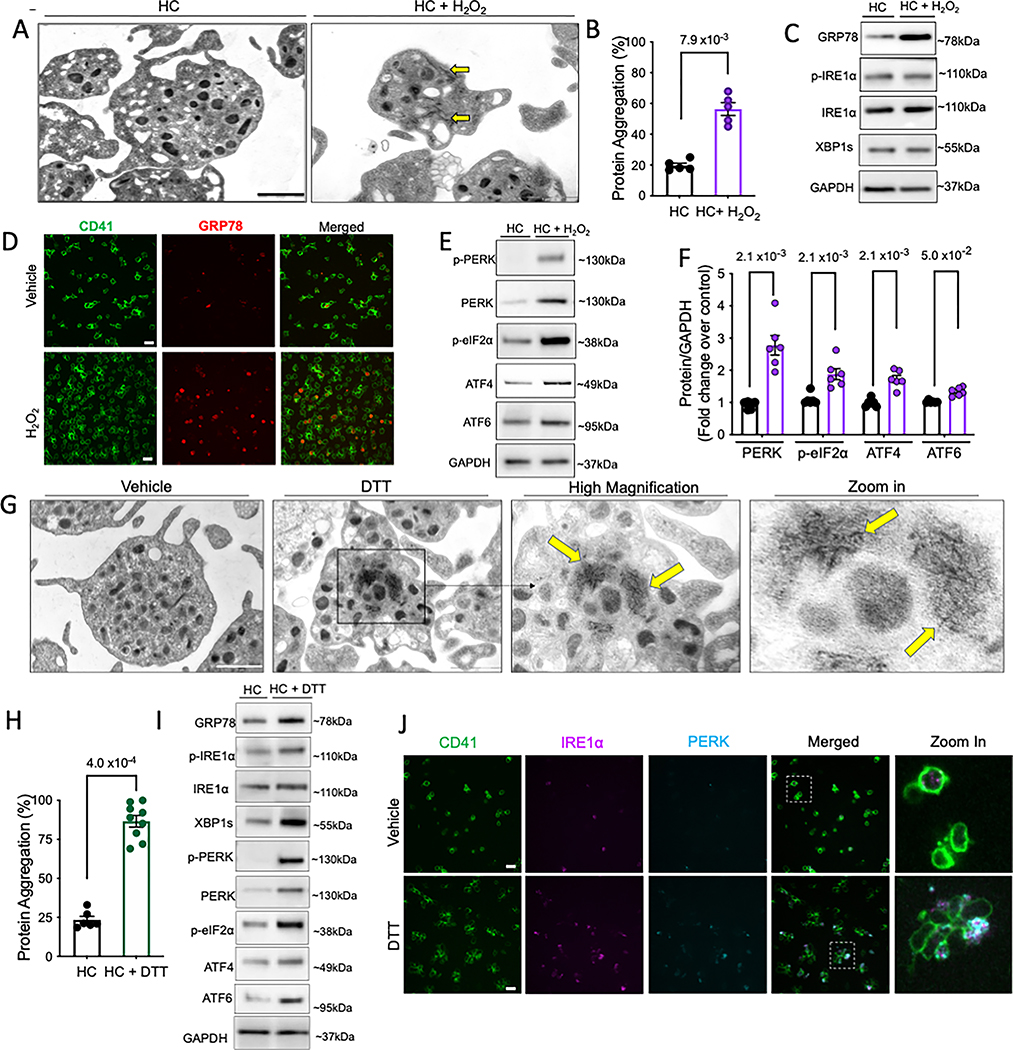
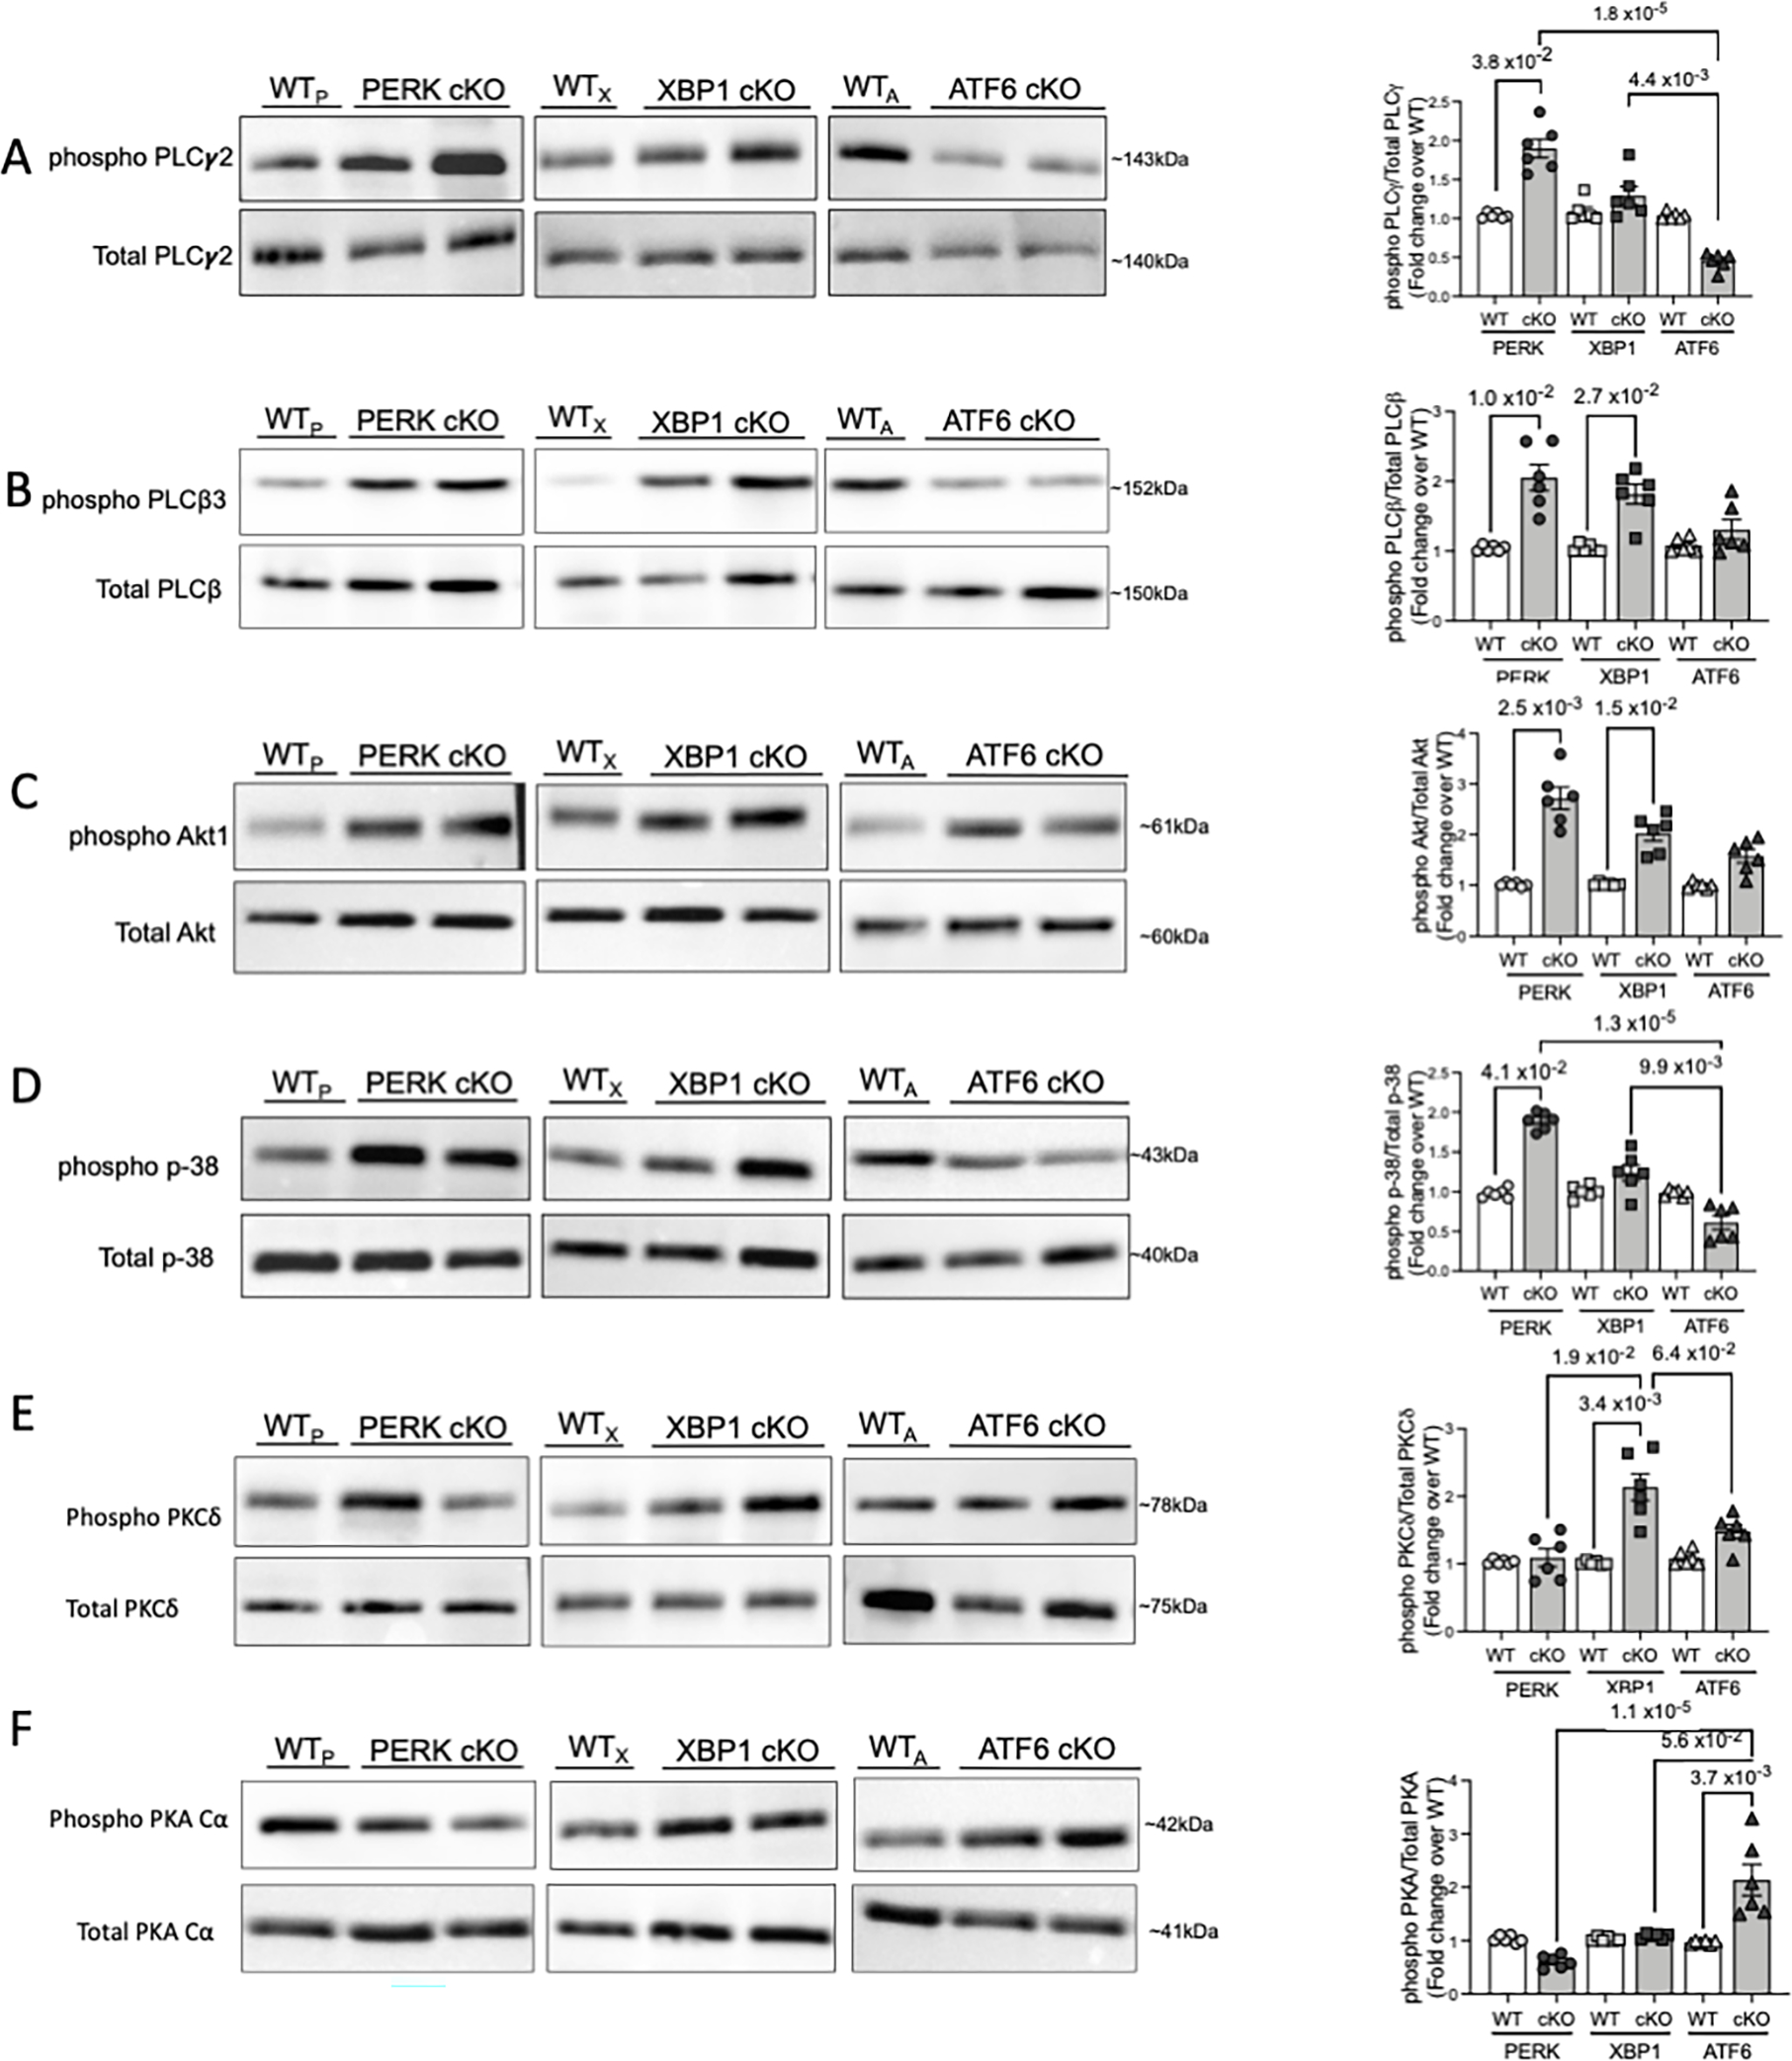
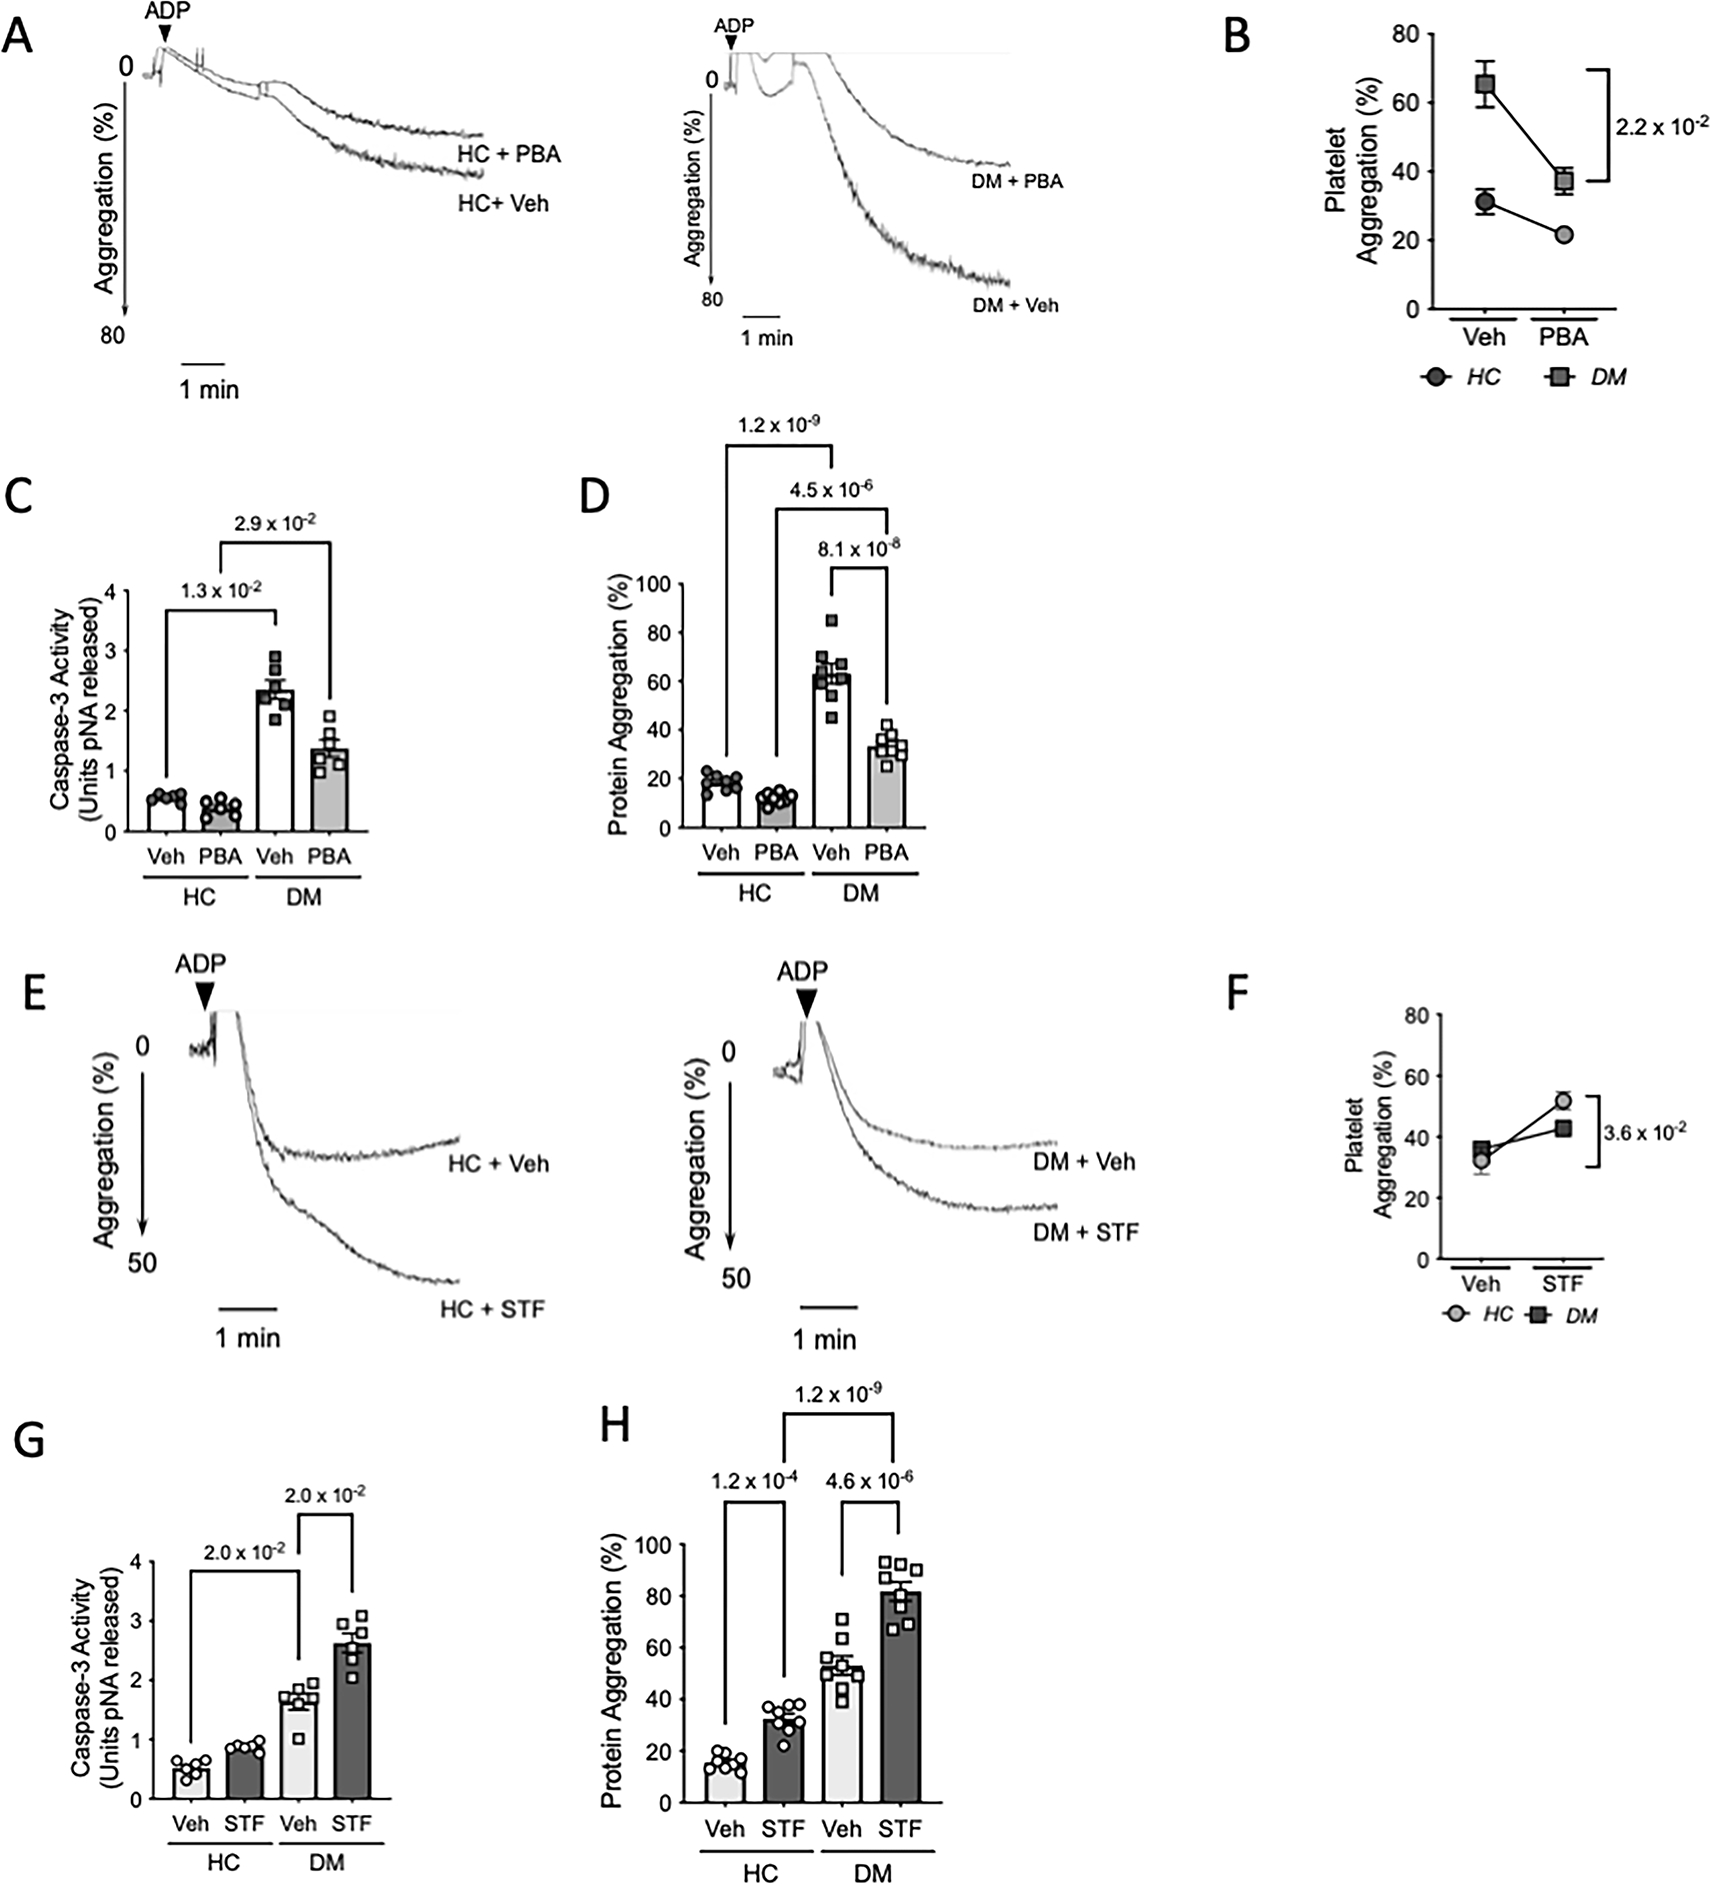
Results: Tunicamycin induced the IRE1α (inositol-requiring enzyme-1alpha)-XBP1 pathway in human and mouse platelets, while oxidative stress predominantly activated the PERK pathway. PERK deletion significantly increased platelet aggregation and apoptosis and phosphorylation of PLCγ2, PLCβ3, and p38 MAPK. Deficiency of XBP1 increased platelet aggregation, with higher PLCβ3 and PKCδ activation. ATF6 deletion mediated a relatively modest effect on platelet phenotype with increased PKA (protein kinase A). Platelets from diabetes patients exhibited a positive correlation between disease severity, platelet activation, and protein aggregation, with only IRE1α-XBP1 activation. Moreover, IRE1α inhibition increased platelet aggregation, while clinically approved chemical chaperone, sodium 4-phenylbutyrate reduced the platelet hyperactivation.

Conclusions: We show for the first time, that UPR activation occurs in platelets and can be independent of genomic regulation, with selective induction being specific to the source and severity of stress. Each UPR pathway plays a key role and can differentially modulate the platelet activation pathways and phenotype. Targeting the specific arms of UPR may provide a new antiplatelet strategy to mitigate thrombotic risk in diabetes and other cardiovascular diseases.

Keywords: blood platelets; diabetes mellitus; endoplasmic reticulum stress; platelet activation; protein aggregates; unfolded protein response.


Conflict of interest statement

Conflict of Interest Statement

The authors declare that they have no competing financial interests.

Figures

Figure 1:
Figure 1:. Tunicamycin selectively activates IRE1α in platelets.
A-H. Freshly isolated human platelets were treated with Tm (5 μg/ml) or vehicle (saline) for 3 h at 37°C. A. Transmission electron microscopy (TEM) images of vehicle and Tm treated platelets, acquired on FEI Tecnai Biotwin (LaB6, 80 kV). Arrows show distended ER within treated platelets. Scale bar, 500nm. n=3 independent experiments for Veh and Tm. B. Percentage of protein aggregates in platelets measured using a rotor dye, ProteoStat® in n=8/group. Values calculated based on standard curve generated using lysozyme IgG standards and controls provided by manufacturer and expressed as percentage. C-D. Representative immunoblots and respective quantitation for expression of ER chaperones following Tm treatment (3 × 10⁸ platelets/ml). n=6/group. E. Confocal microscopy images showing localization of GRP78 (red) and P-selectin (blue) on platelets stained with CD41 (green). Scale bar, 10 μm. Images acquired on Perkin Elmer 5-Laser Spinning Disk Confocal Microscope (equipped with Nikon Ti-E Eclipse inverted microscope), objective 100X (oil). Platelet counts adjusted between samples prior to staining. n=3/group. F-G. Immunoblotting and respective quantitation for key UPR proteins in platelets. For phosphorylated proteins, quantification represents ratio of phosphorylated to total protein, normalized to the loading control, GAPDH. H. Levels of spliced and unspliced XBP1 mRNA measured by qPCR in platelet RNA. For Fig I-H, n=6/group. See also Supplemental Figure S1. I-N. Wild type (WT) mice injected with 1 μg/ml Tm, i.p or vehicle (150 mM dextrose), n=15 per group, 8 males/7 females. Platelets isolated 24 h post injection. I. Soluble P-selectin measured in plasma from WT and Tm injected mice (n=14/group). J. TMRE assay for mitochondrial apoptosis in mice platelets (n=5/group), with or without addition of calcium. K. Protein aggregate levels in mice platelets (n=15/ group). L. Intraplatelet (green, CD41) expression of GRP78 (red) as seen by confocal microscopy in mice platelets. Scale bar, 10 μm. Images acquired on Perkin Elmer 5-Laser Spinning Disk Confocal Microscope with 100× oil immersion lens, n=3/group. M-N. Representative images for UPR protein expression by immunoblotting and respective quantification from n=4/group. Values expressed as mean ± SEM and the p value corresponds to Student t test (B, I, K) or Mann-Whitney test (D, G, H, N). See also Supplemental Figure S1–S2.
Figure 2:
Figure 2:. Acute oxidative stress activates only PERK pathway while stress-induced protein misfolding activates all three arms of the UPR in platelets.
A-G. Freshly isolated human platelets were treated with H2O2 (50 μM) or vehicle (saline) for 30 min at 37°C. A. TEM images of vehicle and H2O2 treated platelets acquired on FEI Tecnai Biotwin (LaB6, 80 kV). Arrows show protein aggregate fibrils and microparticle release. Scale bar, 1 μm. B. Protein aggregation in platelets. n=5/group. C. Representative immunoblots for expression of GRP78, IRE1α and sXBP1 following H2O2 treatment. D. GRP78 (red) levels in individual platelets (green) as seen by microscopy. Scale bar, 10 μm. Images acquired on Perkin Elmer 5-Laser Spinning Disk Confocal Microscope (equipped with Nikon Ti-E Eclipse inverted microscope), 100× oil immersion lens. Platelet counts adjusted between samples prior to staining. TEM and immunostaining micrographs representative of n=3 independent experiments. E-F. Expression and quantification of PERK pathway proteins and ATF6. n=6/group. See also Supplemental Figure S3. G-J. Freshly isolated human platelets were treated with DTT (2 mM) or vehicle (saline) for 30 min at 37°C. G. TEM images of the vehicle and DTT treated platelets acquired on FEI Tecnai T12 (LaB6, 120 kV). Arrows indicate presence of protein aggregates. Zoom in shows magnified view of protein fibril aggregates. Scale bar, 1 μm. Higher magnification of HC platelets shown in Online Data Supplemental Figure S3. TEM micrographs representative of n=3/group. H. Protein aggregation in DTT-treated platelets. n=6/control group and n=9/DTT treated group. I. Representative immunoblots for expression of UPR proteins following DTT treatment; n= 6/group. J. Confocal Microscopy images showing co-localization of IRE1α (magenta) and PERK (cyan) on the platelets stained with CD41 (green). Scale bar, 10 μm. Zoom in depicts levels of IRE1α and PERK in individual platelets. n= 3 independent experiments/group. For phosphorylated proteins, quantification represents ratio of phosphorylated to total protein, normalized to GAPDH. Values expressed as mean ± SEM and precise p value corresponds to Mann-Whitney test.
Figure 3:
Figure 3:. Platelet-specific deletion of UPR genes differentially modulates platelet physiology.
A. Platelet-specific knockout mice were generated by crossing respective floxed mice with Pf4-iCre transgenic mice, as depicted in schematic. Freshly drawn blood and isolated platelets from each KO mice strain and their respective littermate controls (n=16 mice per group per strain, 8 males and 8 females) were used for experiments. Results from genotyping are shown in Supplemental Figure S4. Panel B-D represents results from the PERK conditional KO mice. Panel E-G depicts results from XBP1 cKO mice. Panel H-J shows results from ATF6 cKO mice. B, E, H. Representative platelet aggregation tracings in response to ADP (20μM) for each strain and quantitation shown taking 20 ohms (maximal impedance) as the 100% response. Aggregation response to collagen and CLEC-2 stimulatory antibody shown in Supplemental Figure S5. Aggregation curves reflect results from n=6 WTP and n=6 PERK cKO, n=4 WTX and n, =6 XBP1 cKO, n=5 WTA and n=6 ATF6 cKO mice respectively. C, F, I. Levels of soluble P-selectin in platelet-specific KO mice. Results shown are from n=9 WTP and n=16 PERK cKO, n=6 WTX and n=10 XBP1 cKO, n=6 WTA and n=9 ATF6 cKO mice respectively. D, G, J. Quantification of TMRE assay in the platelets following deletion of specific UPR genes. Graphs reflect results from n=7 WTP and n=9 PERK cKO, n=7 WTX and n=9 XBP1 cKO, n=6 WTA and n=9 ATF6 cKO mice respectively. Representative flow cytometry scatter plots provided in Supplemental Figure S6. K. Intraplatelet protein aggregation levels in platelet-specific KO mice. Results from n=8 WTP and n=12 PERK cKO, n=8 WTX and n=12 XBP1 cKO, n=8 WTA and n=12 ATF6 cKO mice respectively. Values expressed as Mean ± SEM. Exact p values correspond to Mann Whitney test (B-C, E-F, I-J), Student t test (D, G) or one way ANOVA, with Tukey multiple comparisons (K). See also Supplemental Figure S4–S8.
Figure 4:
Figure 4:. Platelet-specific deletion of UPR genes selectively affects specific platelet activation pathways.
Platelets (3 × 10⁸ per mL) from each of the mouse strains were lysed using RIPA buffer, resolved on SDS PAGE and immunoblotted for respective proteins. A total of n=10 mice (n=4 males, n=6 females) per strain and respective littermate controls used for platelet activation signaling responses. Immunoblotting and respective quantitation for A. phospho- PLCγ2 and total PLCγ2. B. phospho PLCβ3 and Total PLCβ3. C. phospho-Akt1 and Total Akt. D. phospho-p38 and Total p-38. E. phospho-PKCδ and Total PKCδ. F. phospho-PKA Cα and total PKA Cα. Quantification of immunoblotting reflects the results from n=6 WTP and n=6 PERK cKO, n=6 WTX and n=6 XBP1 cKO, n=6 WTA and n=6 ATF6 cKO mice respectively. Data presented as mean ± SEM. Precise p value corresponds to Kruskal-Wallis test with Dunn’s multiple comparisons.
Figure 5:
Figure 5:. Platelet-specific deletion of UPR genes differentially affects the response to ex vivo stressors.
A-F. Freshly isolated platelets (3 × 10⁸ platelets per mL, n=3 samples pooled to obtain the appropriate platelet counts) from each KO strain and littermate controls, incubated for 30 min with 50 μM H2O2 or vehicle. Blood drawn from a total of n=12 mice/ strain. For PERK and XBP1 strain, n=7 male/ n=5 female mice were used. For ATF6, n=6 male/ n=6 female mice were used. A. Protein aggregation in platelets following acute stress (n=5 pooled samples). B-C. Representative plots and quantification for TMRE assay each mouse strain (n=4 pooled samples). D. Intraplatelet Caspase-3 activity following H2O2 treatment (n=4 pooled samples). E. Representative immunoblotting for UPR protein expression in KO mice platelets. Quantitation shown in Supplemental Figure S9. Data presented as mean ± SEM. The precise p value corresponds to Mann Whitney test for comparison between vehicle and H2O2 treated groups; or Kruskal-Wallis test with Dunn’s multiple comparisons between treated strains. See also Supplemental Figure S9.
Figure 6:
Figure 6:. Diabetes mellitus selectively activates IRE1α in platelets.
Freshly isolated platelets from DM patients (n=102) were compared to healthy age matched controls(HC), processed simultaneously. A. Levels of soluble P-selectin in DM (n=75) and controls (n=38). B. Representative TEM from DM and HC platelets, acquired on FEI Tecnai Biotwin (LaB6, 80 kV). Arrows highlight presence of protein aggregates and ER expansion within DM platelets. Scale bar, 500 nm. Data representative of n=3 independent experiments. Lower magnification shown in Supplemental Figure S10. C. Protein aggregation in DM (n=102) and HC platelets (n=40) measured using the Proteostat Dye. D-E. Platelets (3 × 10⁸ per mL) were used for immunoblotting. Representative immunoblots and quantification for expression of UPR pathway proteins in HC (n=10) and DM (n=18) samples. F. Heat map shows differential expression of key ER stress/UPR genes measured and quantified using the RT2 Profiler Human Unfolded Protein Response PCR array. Heat map represents fold change in patients with less (HbA1c<8.5) and more (HbA1c>8.5) severe diabetes. Results normalized to housekeeping genes and expressed over HC. n=6 each, for HC and DM platelets. Validation by qPCR for UPR genes shown in Supplemental Figure S11. G. Confocal microscopy images from DM and control platelets (green, CD41) stained for IRE1α (blue) with GRP78 (red). Zoom in as shown by dotted line shows expression in individual platelets. Images acquired on Perkin Elmer 5-Laser Spinning Disk Confocal Microscope (equipped with Nikon Ti-E Eclipse inverted microscope), 100X (oil) objective. Microscopy images representative of n=3 independent experiments. Platelet counts adjusted between samples prior to staining. Scale bar, 10 μm H. Pearson’s correlation between protein aggregates and P-selectin. I. Pearson’s Correlation between protein aggregates and HbA1c (%), an indicator of the severity of diabetes. Values expressed as mean ± SEM. Precise p value corresponds to Mann Whitney test (A) and Student’s t test (C, E). See also Supplemental Data Table 1 and Supplemental Figure S10–12
Figure 7:
Figure 7:. Chemical chaperone 4-PBA and IRE1α inhibition differentially modulates platelet activation in diabetes mellitus.
Healthy control (HC) and diabetes mellitus (DM) patients were randomly selected for ex vivo interventions to study effect of UPR modulation on platelet phenotype. A-D. Freshly isolated platelet rich plasma (PRP) from either HC or DM patients (n=8 per group) incubated with 4- phenylbutyric acid (PBA, 5mM) or vehicle (PBS) for 3 hr at 37°C. A-B. Representative platelet aggregation tracings using ADP (2.5μM) as agonist. Quantitation shows percentage light transmittance. n=5 samples per group used for aggregation studies. p-value shown between DM veh vs DM + PBA corresponds to Wilcoxon test between pre- and post PBA treated samples. C. Caspase-3 activity (n=6 per group). D. Protein aggregation levels in HC and DM samples (n=8 per group) treated with Veh or PBA were measured in the lysates. E-H. Freshly isolated PRP from HC and DM patients (n=8 per group) was incubated with STF-083010 (STF, 30μM) or vehicle. E-F. Representative platelet aggregation tracings from HC and DM platelet rich plasma (n=5 per group) treated with STF and respective quantitation. Exact p-value shown between HC veh vs HC + STF corresponds to Wilcoxon test between pre- and post STF treated samples. G. Caspase -3 activity following incubation of HC and DM samples (n=6/group) with STF. H. Intraplatelet protein aggregates in HC and DM samples (n=8 per group). Exact p value corresponds to Wilcoxon test between pre- and post-treatment groups (B, F), Kruskal-Wallis test with Dunn’s multiple comparisons (C, G) or one way ANOVA with Tukey multiple comparisons (D-H).

References

    1. Mori K Tripartite management of unfolded proteins in the endoplasmic reticulum. Cell. 2000;101:451–4. - PubMed
    1. Walter P and Ron D. The unfolded protein response: from stress pathway to homeostatic regulation. Science. 2011;334:1081–6. - PubMed
    1. Wagner DD and Burger PC. Platelets in Inflammation and Thrombosis. 2003;23:2131–2137. - PubMed
    1. Weyrich AS, Schwertz H, Kraiss LW and Zimmerman GA. Protein synthesis by platelets: historical and new perspectives. J Thromb Haemost. 2009;7:241–6. - PMC - PubMed
    1. Rowley JW, Schwertz H and Weyrich AS. Platelet mRNA: the meaning behind the message. Curr Opin Hematol. 2012;19:385–91. - PMC - PubMed

Publication types

MeSH terms