

Transcutaneous Vagus Nerve Stimulation Ameliorates the Phenotype of Heart Failure With Preserved Ejection Fraction Through Its Anti-Inflammatory Effects
- PMID: 35862007
- PMCID: PMC9388556
- DOI: 10.1161/CIRCHEARTFAILURE.122.009288
Transcutaneous Vagus Nerve Stimulation Ameliorates the Phenotype of Heart Failure With Preserved Ejection Fraction Through Its Anti-Inflammatory Effects
Abstract
Background: A systemic proinflammatory state plays a central role in the development of heart failure with preserved ejection fraction (HFpEF). Low-level transcutaneous vagus nerve stimulation (LLTS) suppresses inflammation in animals and humans, mediated by an α7nAchR (alpha7 nicotinic acetylcholine receptor)-dependent pathway. We examined the effects of LLTS on cardiac function, inflammation, and fibrosis in the presence of α7nAchR pharmacological blockade in a rat model of HFpEF.
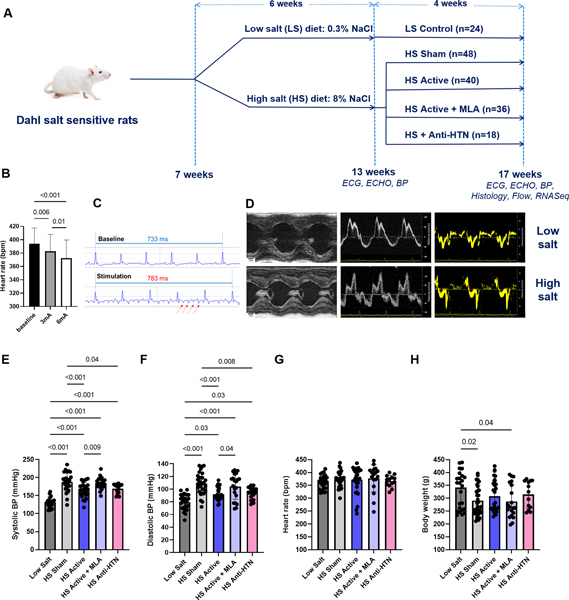
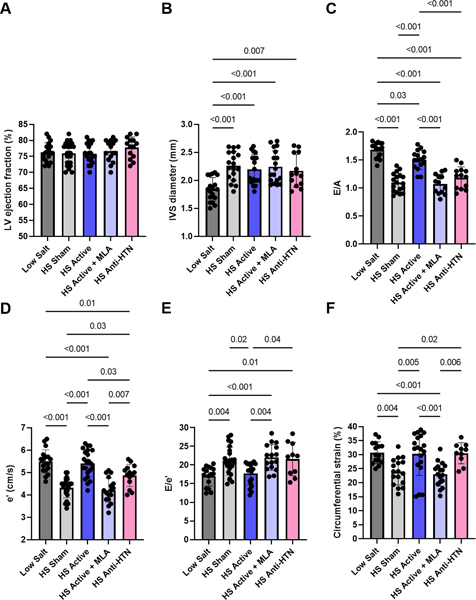
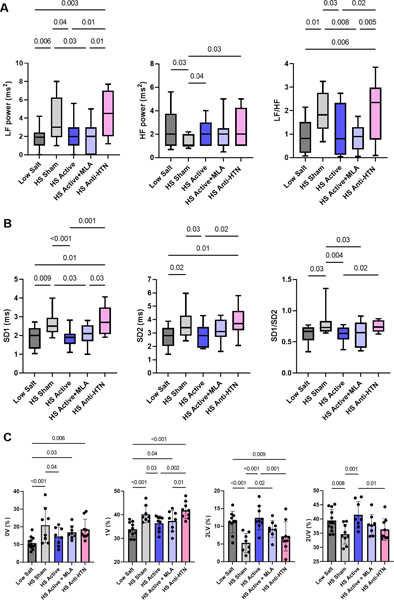
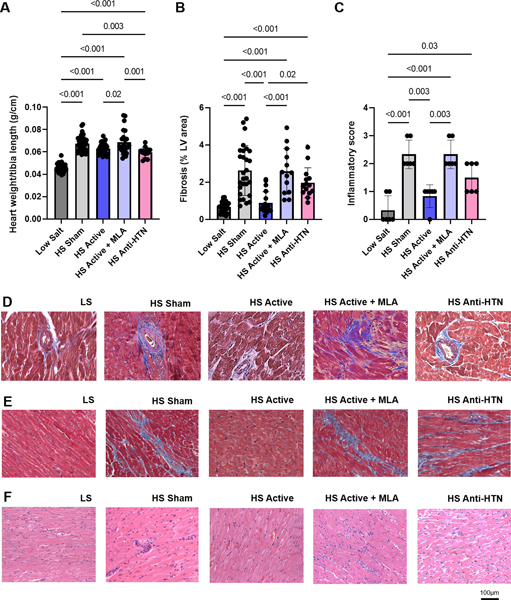
Methods: Dahl salt-sensitive rats at 7 weeks of age were treated with high-salt diet for 6 weeks to induce HFpEF, followed by 4 weeks of (1) LLTS, (2) LLTS with the α7nAchR blocker methyllycaconitine, (3) sham, and (4) olmesartan. Blood pressure, cardiac function by echocardiography, heart rate variability, and serum cytokines were measured at 13 and 17 weeks of age. Cardiac fibrosis, inflammatory cell infiltration, and gene expression were determined at 17 weeks.
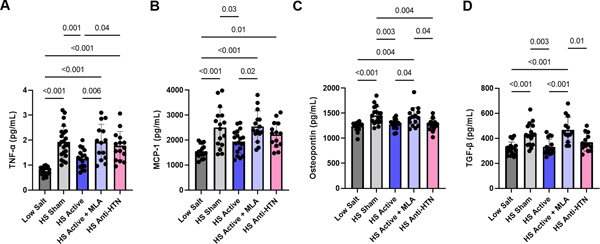
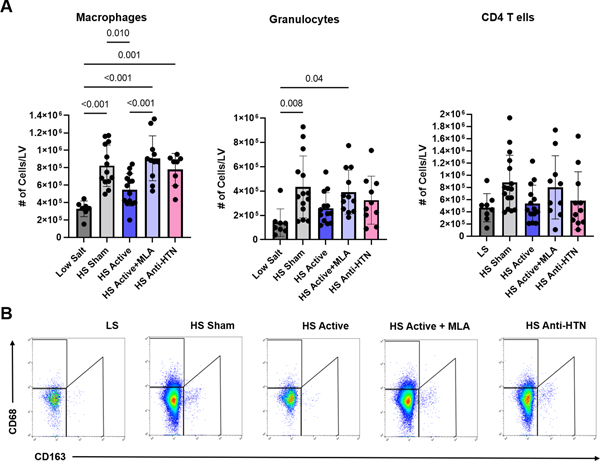
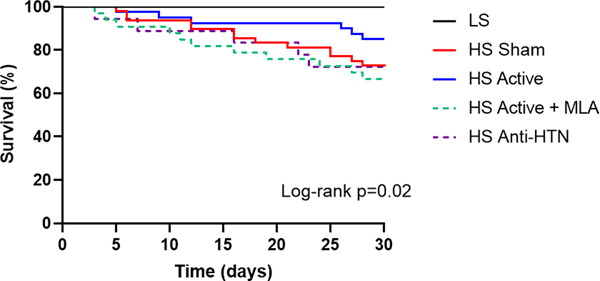
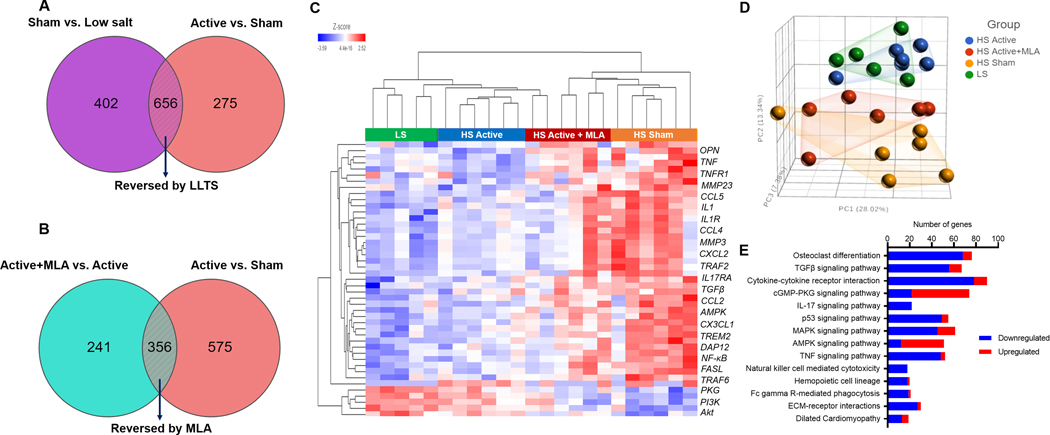
Results: LLTS attenuated the increase in blood pressure; improved cardiac function; decreased inflammatory cytokines, macrophage infiltration, and fibrosis; and improved survival compared with other groups. Methyllycaconitine attenuated these effects, whereas olmesartan did not improve cardiac function or fibrosis despite maintaining similar blood pressure as LLTS. Heart rate variability was similarly improved in the LLTS and LLTS plus methyllycaconitine groups but remained low in the other groups. LLTS reversed the dysregulated inflammatory signaling pathways in HFpEF hearts.
Conclusions: Neuromodulation with LLTS improved cardiac function in a rat model of HFpEF through its anti-inflammatory and antifibrotic effects. These results provide the basis for further clinical trials in humans.
Keywords: fibrosis; heart failure; heart rate; humans; inflammation.
Figures
Similar articles
-
Low-level transcutaneous vagus nerve stimulation attenuates cardiac remodelling in a rat model of heart failure with preserved ejection fraction.Exp Physiol. 2019 Jan;104(1):28-38. doi: 10.1113/EP087351. Epub 2018 Nov 29. Exp Physiol. 2019. PMID: 30398289 Free PMC article.
-
Non-invasive vagus nerve stimulation attenuates proinflammatory cytokines and augments antioxidant levels in the brainstem and forebrain regions of Dahl salt sensitive rats.Sci Rep. 2020 Oct 16;10(1):17576. doi: 10.1038/s41598-020-74257-9. Sci Rep. 2020. PMID: 33067477 Free PMC article.
-
Effect of Low-Level Tragus Stimulation on Cardiac Metabolism in Heart Failure with Preserved Ejection Fraction: A Transcriptomics-Based Analysis.Int J Mol Sci. 2024 Apr 13;25(8):4312. doi: 10.3390/ijms25084312. Int J Mol Sci. 2024. PMID: 38673896 Free PMC article.
-
Drugs That Ameliorate Epicardial Adipose Tissue Inflammation May Have Discordant Effects in Heart Failure With a Preserved Ejection Fraction as Compared With a Reduced Ejection Fraction.J Card Fail. 2019 Dec;25(12):986-1003. doi: 10.1016/j.cardfail.2019.09.002. Epub 2019 Sep 18. J Card Fail. 2019. PMID: 31541742 Review.
-
A novel paradigm for heart failure with preserved ejection fraction: comorbidities drive myocardial dysfunction and remodeling through coronary microvascular endothelial inflammation.J Am Coll Cardiol. 2013 Jul 23;62(4):263-71. doi: 10.1016/j.jacc.2013.02.092. Epub 2013 May 15. J Am Coll Cardiol. 2013. PMID: 23684677 Review.
Cited by
-
Electroacupuncture improves low-grade duodenal inflammation in FD rats by reshaping intestinal flora through the NF-κB p65/NLRP3 pyroptosis pathway.Heliyon. 2024 May 16;10(10):e31197. doi: 10.1016/j.heliyon.2024.e31197. eCollection 2024 May 30. Heliyon. 2024. PMID: 38807876 Free PMC article.
-
Heart Rate Variability, Microvascular Dysfunction, and Inflammation: Exploring the Potential of taVNS in Managing Heart Failure in Type 2 Diabetes Mellitus.Biomolecules. 2025 Mar 29;15(4):499. doi: 10.3390/biom15040499. Biomolecules. 2025. PMID: 40305215 Free PMC article. Review.
-
Recent advances in targeting obesity, with a focus on TGF-β signaling and vagus nerve innervation.Bioelectron Med. 2025 Apr 30;11(1):10. doi: 10.1186/s42234-025-00172-x. Bioelectron Med. 2025. PMID: 40301996 Free PMC article. Review.
-
Device therapy for patients with atrial fibrillation and heart failure with preserved ejection fraction.Heart Fail Rev. 2024 Mar;29(2):417-430. doi: 10.1007/s10741-023-10366-7. Epub 2023 Nov 8. Heart Fail Rev. 2024. PMID: 37940727 Free PMC article. Review.
-
Afterload reduction after non-invasive vagus nerve stimulation in acute heart failure.Front Hum Neurosci. 2023 Mar 23;17:1149449. doi: 10.3389/fnhum.2023.1149449. eCollection 2023. Front Hum Neurosci. 2023. PMID: 37033910 Free PMC article.
References
-
- Shah SJ, Borlaug BA, Kitzman DW, McCulloch AD, Blaxall BC, Agarwal R, Chirinos JA, Collins S, Deo RC, Gladwin MT, et al. Research Priorities for Heart Failure With Preserved Ejection Fraction: National Heart, Lung, and Blood Institute Working Group Summary. Circulation. 2020;141:1001–1026. - PMC - PubMed
-
- Wang H, Yu M, Ochani M, Amella CA, Tanovic M, Susarla S, Li JH, Yang H, Ulloa L, Al-Abed Y, et al. Nicotinic acetylcholine receptor alpha7 subunit is an essential regulator of inflammation. Nature. 2003;421:384–8. - PubMed
Publication types
MeSH terms
Substances
Grants and funding
LinkOut - more resources
Full Text Sources
Medical
