. 2022 Aug 22;7(16):e158902.
doi: 10.1172/jci.insight.158902.

Ebola virus protein VP40 stimulates IL-12- and IL-18-dependent activation of human natural killer cells

Affiliations

Ebola virus protein VP40 stimulates IL-12- and IL-18-dependent activation of human natural killer cells

Hung Le et al. JCI Insight. .

Abstract

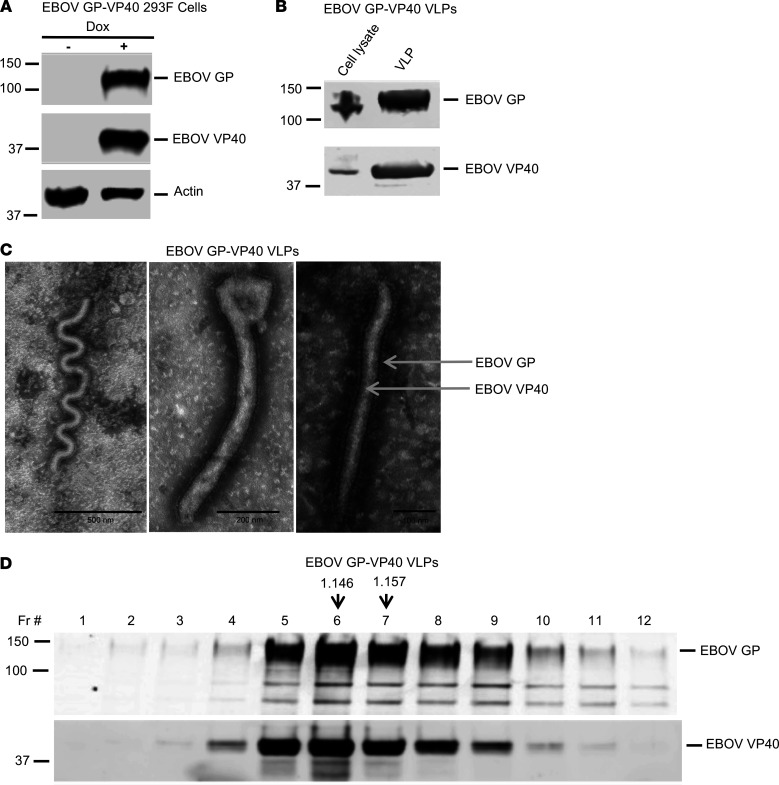
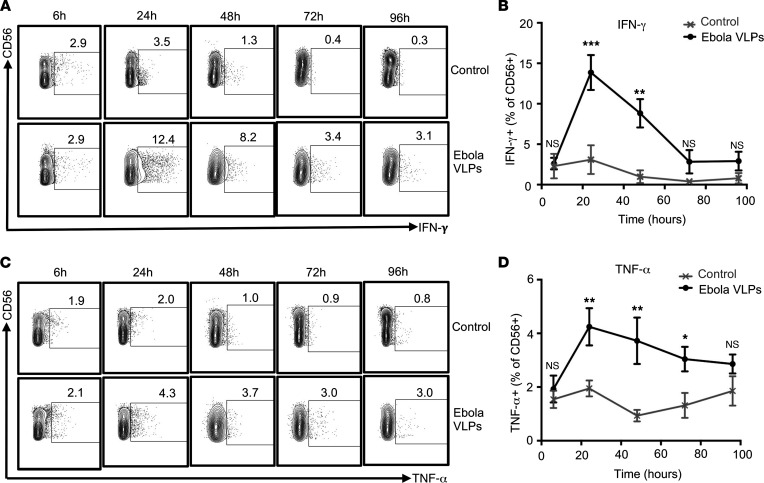
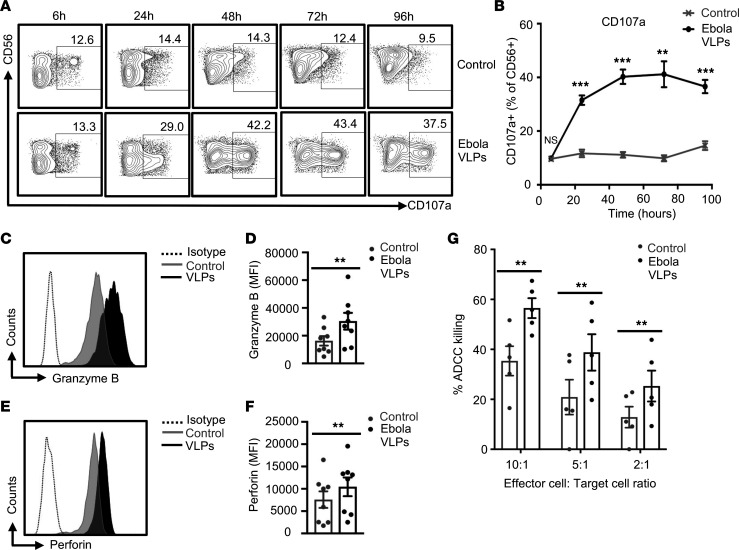
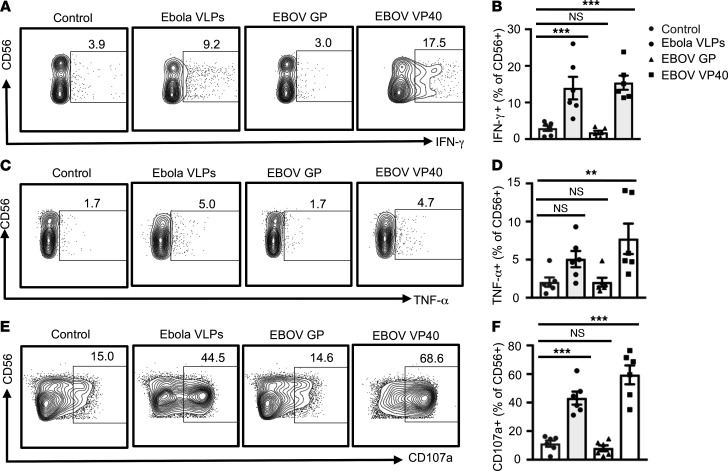
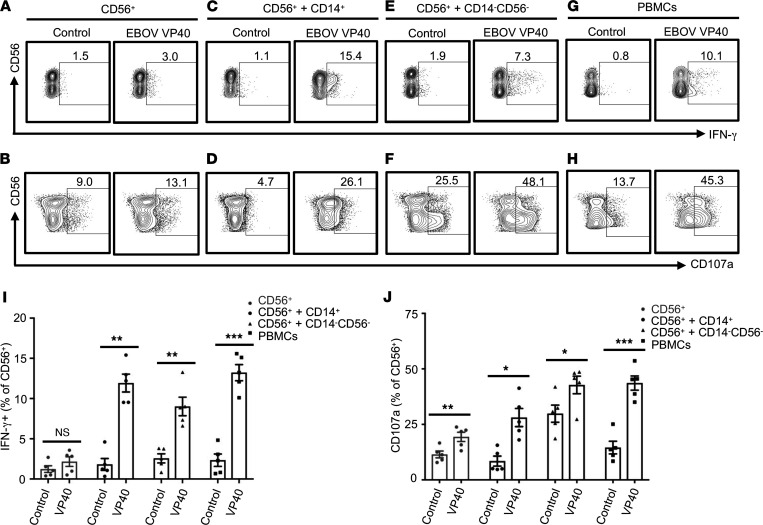
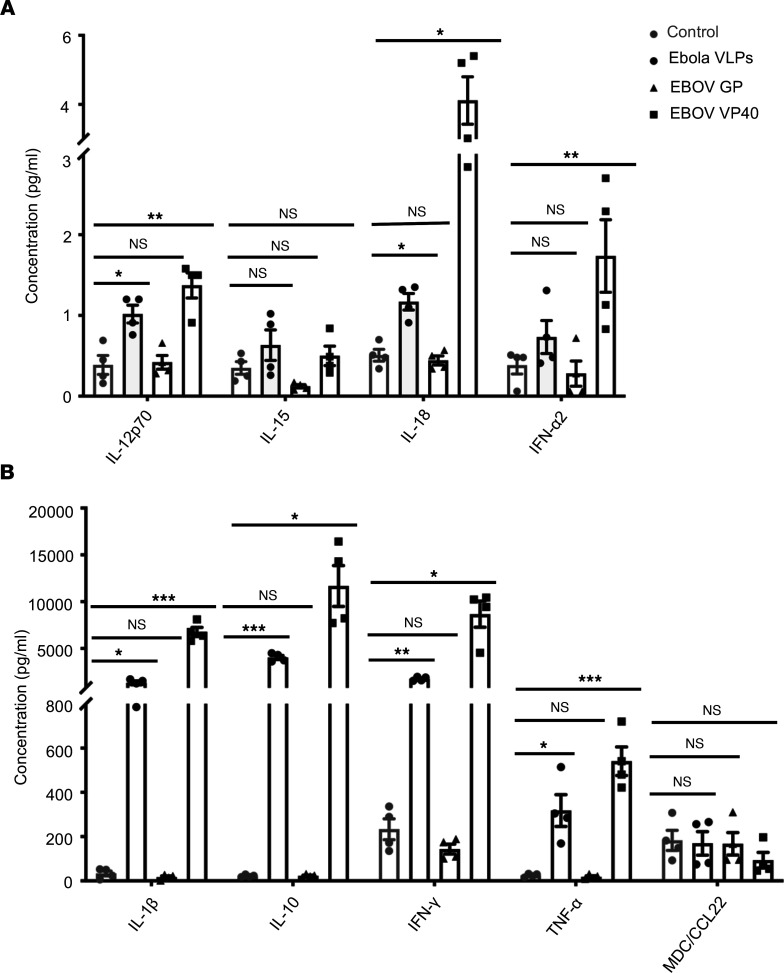
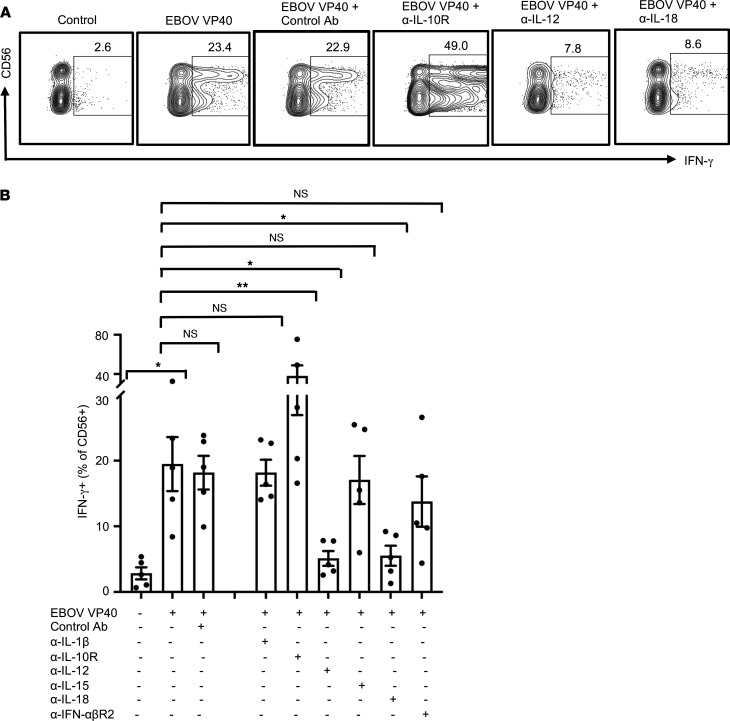
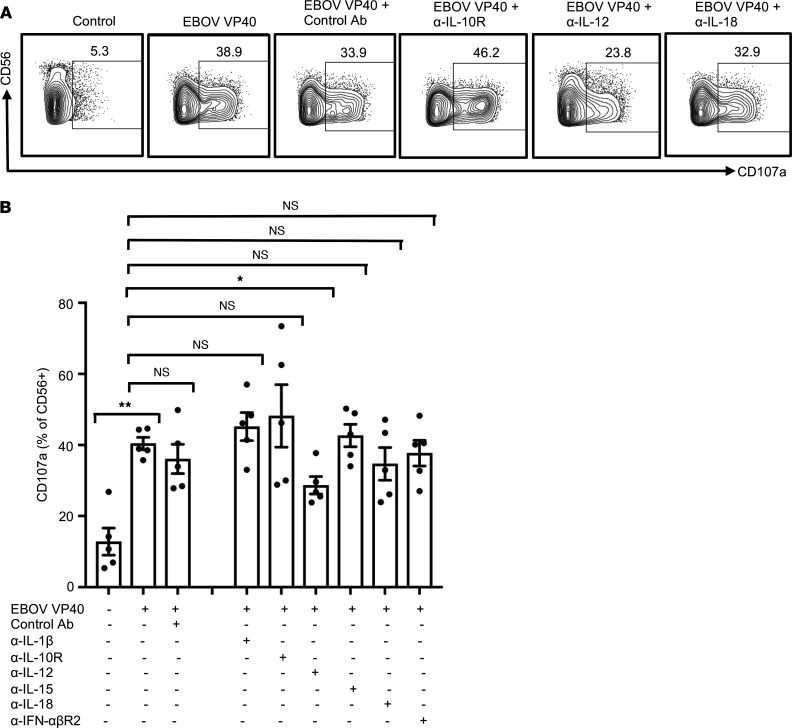
Accumulation of activated natural killer (NK) cells in tissues during Ebola virus infection contributes to Ebola virus disease (EVD) pathogenesis. Yet, immunization with Ebola virus-like particles (VLPs) comprising glycoprotein and matrix protein VP40 provides rapid, NK cell-mediated protection against Ebola challenge. We used Ebola VLPs as the viral surrogates to elucidate the molecular mechanism by which Ebola virus triggers heightened NK cell activity. Incubation of human peripheral blood mononuclear cells with Ebola VLPs or VP40 protein led to increased expression of IFN-γ, TNF-α, granzyme B, and perforin by CD3-CD56+ NK cells, along with increases in degranulation and cytotoxic activity of these cells. Optimal activation required accessory cells like CD14+ myeloid and CD14- cells and triggered increased secretion of numerous inflammatory cytokines. VP40-induced IFN-γ and TNF-α secretion by NK cells was dependent on IL-12 and IL-18 and suppressed by IL-10. In contrast, their increased degranulation was dependent on IL-12 with little influence of IL-18 or IL-10. These results demonstrate that Ebola VP40 stimulates NK cell functions in an IL-12- and IL-18-dependent manner that involves CD14+ and CD14- accessory cells. These potentially novel findings may help in designing improved intervention strategies required to control viral transmission during Ebola outbreaks.

Keywords: Immunology; Infectious disease; Innate immunity; NK cells.


Conflict of interest statement

Conflict of interest: The Ebola antibody-dependent cell-mediated cytotoxicity assay procedure and the target cells used in this study are the intellectual property of Emory University, Atlanta, Georgia, USA (Emory 16164 US, US patent application no. 16/258,484). PS, KS, and Xuemin Chen are listed as inventors on this patent.

Figures

Figure 1
Figure 1. Generation of EBOV GP-VP40 293F stable cell line and characterization of EBOV GP-VP40 VLPs (Ebola VLPs).
(A) EBOV GP-VP40 293F cells were cultured with or without doxycycline (Dox) for 24 hours and cell lysates probed for EBOV GP, EBOV VP40, or actin by Western blotting using specific antibodies. A representative Western blot is shown. (B) Cell lysates and VLPs collected from EBOV GP-VP40 293F cell cultures induced with doxycycline for 40 hours were probed by Western blotting using anti-EBOV GP and anti-EBOV VP40 antibodies. The majority of the EBOV GP and EBOV VP40 were secreted out of the cells as part of the VLPs. (C) Negative stain electron microscopy analysis of EBOV GP-VP40 VLPs showed filamentous particles of different shapes and sizes, covered abundantly with EBOV GP spikes. Scale bars are indicated with black lines (from left to right, 500 nm, 200 nm, and 100 nm). (D) Buoyancy density analysis of EBOV GP-VP40 VLPs. Ebola VLPs fractionated on 20% to 60% sucrose density gradient were analyzed by Western blotting for EBOV GP and EBOV VP40. Buoyance density of each fraction was calculated by measuring its refractive index. Buoyancy densities of the fractions enriched for Ebola VLPs (identified by the relative EBOV GP and VP40 contents) are shown with vertical arrows above those fractions. Numbers at left of blots indicate kilodaltons.
Figure 2
Figure 2. Enhanced frequencies of cytokine-secreting NK cells upon stimulation of human PBMCs with Ebola VLPs.
PBMCs were stimulated with or without Ebola VLPs (final concentration: 10 μg/mL of EBOV GP) for 6, 24, 48, 72, and 96 hours. Surface markers and intracellular cytokine expression were assessed by flow cytometry. Strategy for gating single and live CD3CD56+ NK cells is shown in Supplemental Figure 2. (A and C) Representative dot blots showing CD3CD56+ NK cells plotted for IFN-γ and TNF-α, respectively. (B and D) Summary data from 11 independent experiments performed with PBMCs from 11 (24 and 48 hours) or 5 (6, 72, and 96 hours) independent donors are shown for IFN-γ and TNF-α, respectively. Results are shown as mean ± SEM. *P < 0.05, **P < 0.01, ***P < 0.001, as calculated by 2-tailed paired Student’s t test.
Figure 3
Figure 3. Degranulation and cytotoxic function of NK cells are enhanced by exposure to Ebola VLPs.
PBMCs were stimulated with or without Ebola VLPs as in Figure 2. Cells were stained for the surface and cytotoxicity markers and data acquired and analyzed as described in Methods. Only single and live CD3CD56+ NK cells were included in the analysis. Representative dot blots (A) and the corresponding summary data from 11 independent experiments performed with PBMCs from 11 (24 and 48 hours) or 5 (6, 72, and 96 hours) independent donors (B) showing NK cells’ degranulation (CD107a surface expression) are shown. (CF) Representative histograms for intracellular granzyme B (C) and perforin (E) expression in gated CD3CD56+ NK cells from PBMC cultures stimulated with Ebola VLPs (black) for 48 hours are shown. NK cells from PBMCs left unstimulated are shown in gray. Dotted histograms represent corresponding isotype controls. D (granzyme B) and F (perforin) show corresponding summary data from 8 independent experiments performed with PBMCs from 8 independent donors. (G) ADCC killing of target cells mediated by either unexposed (gray circles) or Ebola VLP exposed (black circles) PBMCs. PBMCs exposed to Ebola VLPs for 48 hours were analyzed for their cytotoxic potential by mixing them with the target cells expressing EBOV GP and in the presence of anti-EBOV GP plasma. Combined data from 5 independent experiments with PBMCs from 5 donors are shown. Results are shown as mean ± SEM. **P < 0.01, ***P < 0.001, as calculated by 2-tailed paired Student’s t test.
Figure 4
Figure 4. Both immature and mature NK cells respond to Ebola VLPs but to different degrees.
PBMCs were stimulated with or without Ebola VLPs and stained as in Figures 2 and 3. Single and live CD3CD56+ NK cells were divided into CD56bright and CD56dim NK cells as shown in Supplemental Figure 2. Representative dot blots and the corresponding summary data for IFN-γ (AD), TNF-α (EH), and CD107a (IL) from 8 independent experiments with PBMCs from 8 donors are shown. Results are shown as mean ± SEM. *P < 0.05, **P < 0.01, ***P < 0.001 as calculated by 2-tailed paired Student’s t test.
Figure 5
Figure 5. Activation of NK cells by Ebola VLPs is mediated through its EBOV VP40 component.
PBMCs were left unstimulated or stimulated with Ebola VLPs (10 μg/mL), EBOV GP (10 μg/mL), or EBOV VP40 (5 μg/mL) for 24 hours (IFN-γ and TNF-α) or 48 hours (NK cell degranulation). Cells were stained for the surface and intracellular markers and data acquired as described earlier. Representative dot blots and the corresponding summary data showing gated CD3CD56+ NK cells plotted for IFN-γ (A and B), TNF-α (C and D), and NK cells’ degranulation (CD107a surface expression) (E and F) from 6 independent experiments performed with PBMCs from 6 donors are shown. All results are shown as mean ± SEM. **P < 0.01, ***P < 0.001, as calculated by repeated measures (RM) 1-way ANOVA followed by Dunnett’s multiple comparisons test.
Figure 6
Figure 6. CD14+ and CD14CD56 accessory cells are required for the EBOV VP40-induced optimal NK cell activation.
Purified CD56+ NK cells, cultured alone (A and B), with purified CD14+ cells (C and D), or with CD14CD56 fraction (E and F) and the parent PBMCs (G and H) were stimulated with or without EBOV VP40 (5 μg/mL) for 24 hours (IFN-γ) or 48 hours (CD107a). Cells were analyzed flow cytometrically. Representative dot blots with CD3CD56+ NK cells plotted for IFN-γ (A, C, E, and G) and CD107a (B, D, F, and H) are shown. Corresponding summary data from 5 independent experiments performed with cells isolated from 5 donors are shown in I and J, respectively. Results are shown as mean ± SEM. *P < 0.05, **P < 0.01, ***P < 0.001, as calculated by 2-tailed paired Student’s t test.
Figure 7
Figure 7. Secretion of inflammatory cytokines induced by Ebola VLPs and EBOV VP40.
PBMCs were cultured in media alone (gray circles) or stimulated with Ebola VLPs (10 μg/mL, black circles), EBOV GP (10 μg/mL, triangles), or EBOV VP40 (5 μg/mL, squares) for 24 hours as described earlier. Amounts of IL-12p70, IL-15, IL-18, andIFN-α2 (A) and IL-1β, IL-10, IFN-γ, TNF-α, and MDC/CCL22 (B) secreted into the culture supernatants were quantified by using a Milliplex human cytokine/chemokine multiplex kit. Results are shown as mean ± SEM of data from 4 donors. *P < 0.05, **P < 0.01, ***P < 0.001, as calculated by RM 1-way ANOVA followed by Dunnett’s multiple comparisons test. MDC, macrophage-derived chemokine.
Figure 8
Figure 8. IL-12 and IL-18 regulate EBOV VP40-induced NK cell IFN-γ responses.
PBMCs were cultured in complete media unstimulated or stimulated with EBOV VP40 (5 μg/mL) for 24 hours. Where indicated blocking monoclonal antibodies for IL-1β, IL-10R, IL-12, IL-15, IL-18, IFN-αβR2 or the corresponding isotype controls were included in the cultures (final concentration of 3 μg/mL). Cells were analyzed flow cytometrically as described earlier. Representative dot blots for CD3CD56+ NK cells secreting IFN-γ in the presence of the blocking antibodies that showed statistically significant effect compared with the EBOV VP40 alone are shown (A). Corresponding summary data from 5 independent experiments performed with PBMCs from 5 donors are shown (B). Results are shown as mean ± SEM. *P < 0.05, **P < 0.01, as calculated by RM 1-way ANOVA followed by Holm-Šidák multiple comparisons test. IL-10R, IL-10 receptor; IFN-αβR2, IFN-αβ receptor 2.
Figure 9
Figure 9. IL-12 regulates EBOV VP40-induced NK cell degranulation.
PBMCs were cultured, then stimulated with EBOV VP40 (5 μg/mL) for 48 hours in the presence of blocking monoclonal antibodies for IL-1β, IL-10R, IL-12, IL-15, IL-18, and IFN-αβR2 or the corresponding isotype controls (all at a final concentration of 3 μg/mL) and analyzed flow cytometrically as described earlier. Representative dot blots with CD3CD56+ NK cells plotted for surface CD107a are shown (A). Corresponding summary data from 5 independent experiments performed with PBMCs from 5 donors are shown (B). Results are shown as mean ± SEM. *P < 0.05, **P < 0.01, as calculated by RM 1-way ANOVA followed by Holm-Šidák multiple comparisons test.

Similar articles

Cited by

References

    1. Vivier E, et al. Functions of natural killer cells. Nat Immunol. 2008;9(5):503–510. doi: 10.1038/ni1582. - DOI - PubMed
    1. Lanier LL. Up on the tightrope: natural killer cell activation and inhibition. Nat Immunol. 2008;9(5):495–502. doi: 10.1038/ni1581. - DOI - PMC - PubMed
    1. Long EO, et al. Controlling natural killer cell responses: integration of signals for activation and inhibition. Annu Rev Immunol. 2013;31:227–258. doi: 10.1146/annurev-immunol-020711-075005. - DOI - PMC - PubMed
    1. Krzewski K, Coligan JE. Human NK cell lytic granules and regulation of their exocytosis. Front Immunol. 2012;3:335. - PMC - PubMed
    1. Lam VC, Lanier LL. NK cells in host responses to viral infections. Curr Opin Immunol. 2017;44:43–51. doi: 10.1016/j.coi.2016.11.003. - DOI - PMC - PubMed

Publication types