. 2023 Mar 14;25(3):459-470.
doi: 10.1093/neuonc/noac179.

ELF4 is a critical component of a miRNA-transcription factor network and is a bridge regulator of glioblastoma receptor signaling and lipid dynamics

Affiliations

ELF4 is a critical component of a miRNA-transcription factor network and is a bridge regulator of glioblastoma receptor signaling and lipid dynamics

Adam Kosti et al. Neuro Oncol. .

Abstract

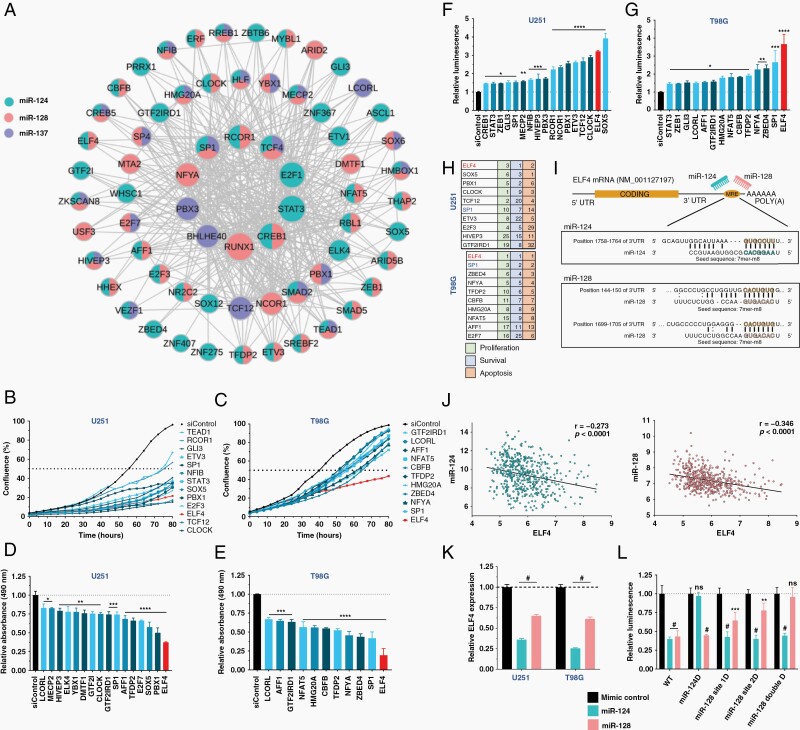
Background: The loss of neurogenic tumor suppressor microRNAs miR-124, miR-128, and miR-137 is associated with glioblastoma's undifferentiated state. Most of their impact comes via the repression of a network of oncogenic transcription factors. We conducted a high-throughput functional siRNA screen in glioblastoma cells and identify E74 like ETS transcription factor 4 (ELF4) as the leading contributor to oncogenic phenotypes.

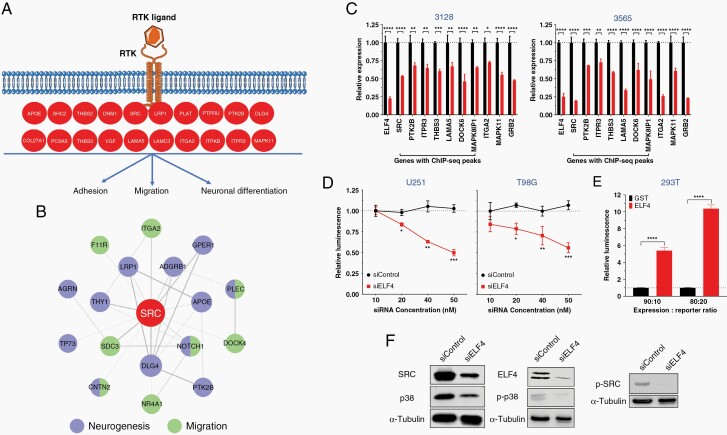
Methods: In vitro and in vivo assays were used to assess ELF4 impact on cancer phenotypes. We characterized ELF4's mechanism of action via genomic and lipidomic analyses. A MAPK reporter assay verified ELF4's impact on MAPK signaling, and qRT-PCR and western blotting were used to corroborate ELF4 regulatory role on most relevant target genes.

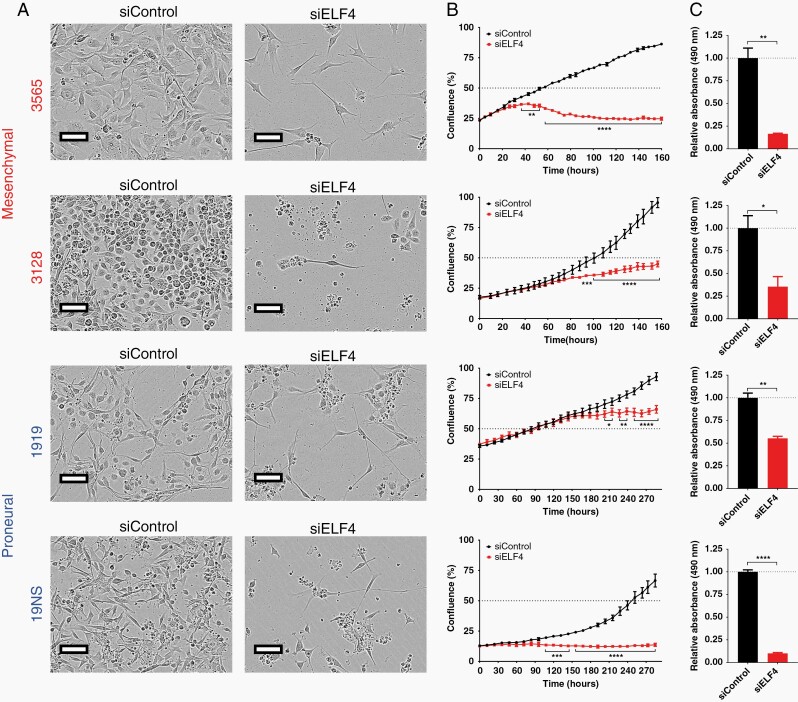
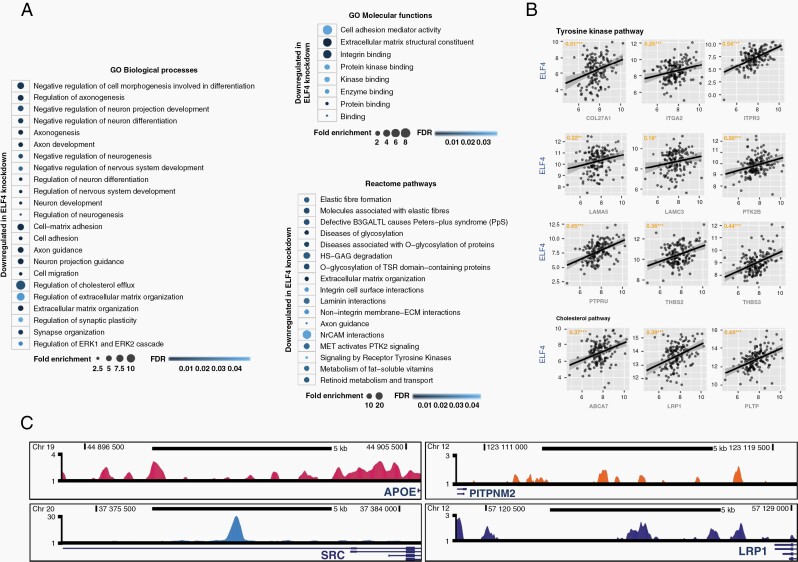
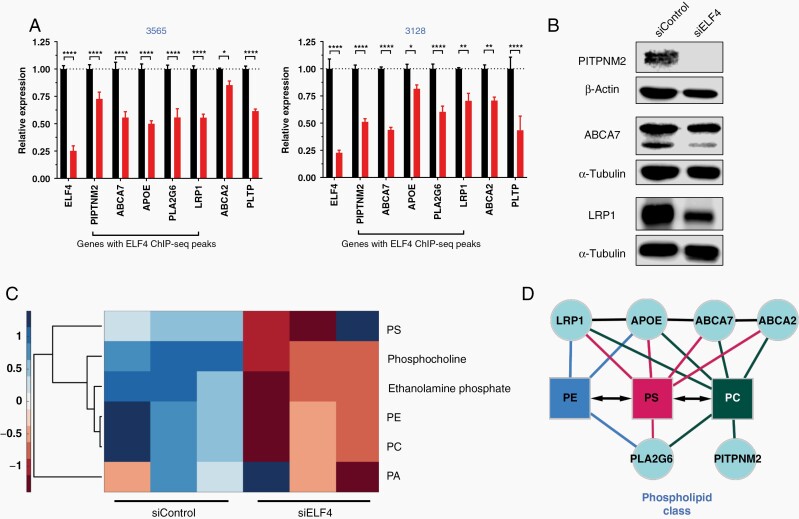
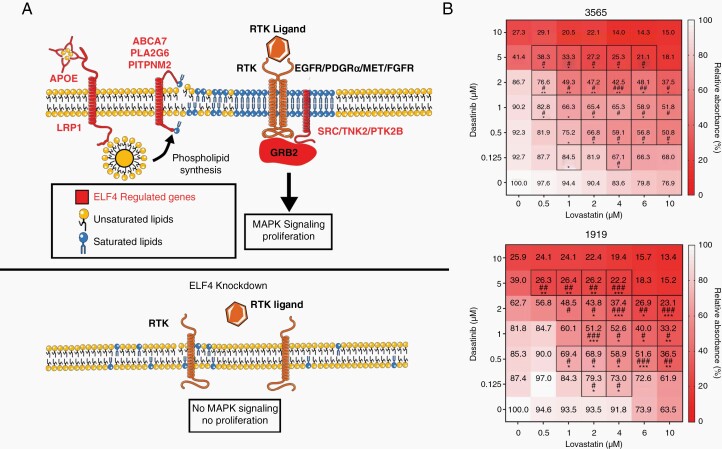
Results: ELF4 knockdown resulted in significant proliferation delay and apoptosis in GBM cells and long-term growth delay and morphological changes in glioma stem cells (GSCs). Transcriptomic analyses revealed that ELF4 controls two interlinked pathways: 1) Receptor tyrosine kinase signaling and 2) Lipid dynamics. ELF4 modulation directly affected receptor tyrosine kinase (RTK) signaling, as mitogen-activated protein kinase (MAPK) activity was dependent upon ELF4 levels. Furthermore, shotgun lipidomics revealed that ELF4 depletion disrupted several phospholipid classes, highlighting ELF4's importance in lipid homeostasis.

Conclusions: We found that ELF4 is critical for the GBM cell identity by controlling genes of two dependent pathways: RTK signaling (SRC, PTK2B, and TNK2) and lipid dynamics (LRP1, APOE, ABCA7, PLA2G6, and PITPNM2). Our data suggest that targeting these two pathways simultaneously may be therapeutically beneficial to GBM patients.

Keywords: ELF4; RTK signaling; glioblastoma; lipid dynamics; miRNA-transcription factor networks.


Figures

Figure 1.
Figure 1.
miR-124, -128, and -137 regulated transcription factors drive the glioblastoma phenotype. (A) TF network regulated by the three miRNAs. (B–G) U251 and T98G cells were reverse transfected with siRNAs against each TF. Only siRNAs that caused a significant difference from siControl are shown. (B, C) Cell proliferation was monitored using a live-cell imager (IncuCyte). (D, E) Cell viability was measured using an MTS assay 48 h after transfection. (F, G) Caspase-3/-7 activity in GBM cells 48 h after knockdown. (H) Summary table of screening results displaying top-10 TFs based on their rank in each assay. (I) miR-124/-128 binding sites in ELF4’s 3′UTR. (J) Correlation between ELF4 and miR-124/-128 RNA expression in the TCGA GBM cohort. (K) ELF4 expression 48 h after miRNA transfection. (L) 293T cells cotransfected with ELF4 3′UTR luciferase reporter and miRNA mimics. miRNA binding sites in (I) were deleted. Luminescence was measured after 48 h. Student’s t-test was used to determine statistical significance in qPCR and luciferase experiments, **P < .01, ***P < .001, #P < .0001. Significant differences in screening assays were determined by performing a Dunnett’s multiple comparison test against siControl (P-adjusted < .05). Full results in (Supplementary Table 4).
Figure 2.
Figure 2.
ELF4 is critical for glioma stem cell phenotype. GSCs were reverse transfected with siRNAs onto a Geltrex matrix. (A) GSCs displayed long-term morphological changes following transient knockdown of ELF4 (3565 and 3128: 160 h later; 1919 and 19NS: 286 h later). (B) Proliferation was monitored over time using a live-cell imager (IncuCyte). Statistical significance was determined by performing multiple t-tests with P-adjusted value corrected by the Holm–Šídák method (*P < .05; **P < .01; ***P < .001; and ****P < .0001). (C) MTS assay following the end of live-cell imaging. Student’s t-test was used to determine statistical significance *P < .05, **P < .01, ****P < .0001.
Figure 3.
Figure 3.
ELF4’s regulatory landscape. (A) Enriched gene ontology (GO) and reactome terms following ELF4 knockdown in 3565 cells. Gene set was analyzed using PANTHER (http://pantherdb.org; Supplementary Table 3). (B) Downregulated genes, in tyrosine kinase and cholesterol pathways, whose expression is strongly correlated with ELF4 in TCGA GBM patients. (C) ELF4 binding sites in the promoters of relevant genes in K562 cells (fold change over control; Supplementary Table 5).
Figure 4.
Figure 4.
(A) qPCR for RTK-related genes in 3565 and 3128 cells 48 h after transfection. Student’s t-test was used to determine statistical significance between siControl and siELF4, *P < .05, **P < .01, ***P < .001, ****P < .0001. (B) U251 and T98G cells stably expressing a construct containing firefly luciferase under the control of serum response element promoter (SRE-Luciferase), were reverse transfected with different concentrations of siRNA. About 24 h later, luciferase activity was measured. Statistical significance was determined by performing multiple t-tests with P-adjusted value corrected by the Holm–Šídák method (*P < .05; **P < .01; ***P < .001). (C) HEK 293T cells were cotransfected with either GST (control) or ELF4 expression construct along with the SRE-luciferase construct, and luminescence was measured 24 h later. Student’s t-test was used to determine statistical significance between GST and ELF4, ****P < .0001. (D) Immunoblot analysis 48 h after transfection.
Figure 5.
Figure 5.
ELF4 controls lipid dynamics. (A) qPCR for RTK-related genes in 3565 and 3128 cells 48 h after transfection. Student’s t-test was used to determine statistical significance between siControl and siELF4, *P < .05, **P < .01, ***P < .001, ****P < .0001. (B) Immunoblot analysis 48 h after transfection. (C) Heatmap displaying major phospholipid classes and corresponding polar head groups based on lipidomics analysis (Supplementary Table 6). (D) Network analysis. Protein–protein interactions based on STRING using Text mining, Experiments, and Databases with a 0.4 confidence score. Protein interactions with phospholipids based on literature.
Figure 6.
Figure 6.
Model of ELF4 in GBM reveals synergy between SRC and lipid inhibitors (A) Model of ELF4 in GBM. Normal RTK signaling and lipid dynamics occurs in the presence of ELF4. Knockdown of ELF4 results in disrupted RTK signaling and lipid dynamics and no proliferation. (B) Dose–response matrices for mesenchymal and proneural GSCs 168 h after treatment with different doses of dasatinib and/or lovastatin. Viability was measured with an MTS assay. Boxed in combinations are considered synergistic based on either Bliss (*) or Loewe’s (#) model of synergy which were calculated by Combenfit. */#P < .05, **/##P < .01, ***/###P < .001.

Similar articles

Cited by

References

    1. Stupp R, Mason WP, van den Bent MJ, et al. . Radiotherapy plus concomitant and adjuvant temozolomide for glioblastoma. N Engl J Med. 2005;352(10):987–996. - PubMed
    1. Weller M, Felsberg J, Hartmann C, et al. . Molecular predictors of progression-free and overall survival in patients with newly diagnosed glioblastoma: a prospective translational study of the German Glioma Network. J Clin Oncol. 2009;27(34):5743–5750. - PubMed
    1. Verhaak RG, Hoadley KA, Purdom E, et al. . Integrated genomic analysis identifies clinically relevant subtypes of glioblastoma characterized by abnormalities in PDGFRA, IDH1, EGFR, and NF1. Cancer Cell. 2010;17(1):98–110. - PMC - PubMed
    1. Brennan CW, Verhaak RG, McKenna A, et al. . The somatic genomic landscape of glioblastoma. Cell. 2013;155(2):462–477. - PMC - PubMed
    1. Neftel C, Laffy J, Filbin MG, et al. . An integrative model of cellular states, plasticity, and genetics for glioblastoma. Cell. 2019;178(4):835–849.e21. - PMC - PubMed

Publication types