

Pseudo-Octahedral Iron(II) Complexes with Near-Degenerate Charge Transfer and Ligand Field States at the Franck-Condon Geometry
- PMID: 35862259
- PMCID: PMC9804653
- DOI: 10.1002/chem.202201858
Pseudo-Octahedral Iron(II) Complexes with Near-Degenerate Charge Transfer and Ligand Field States at the Franck-Condon Geometry
Abstract
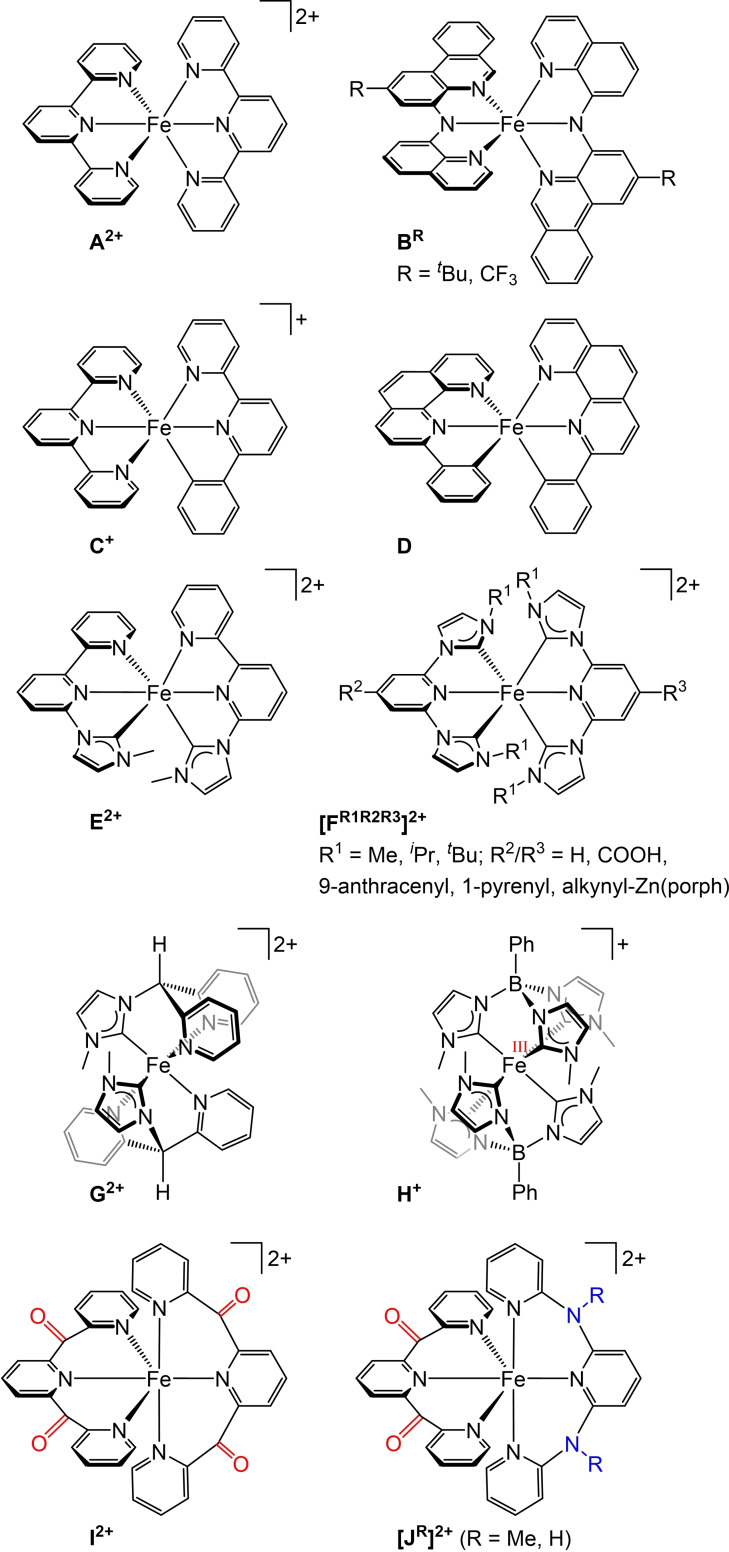
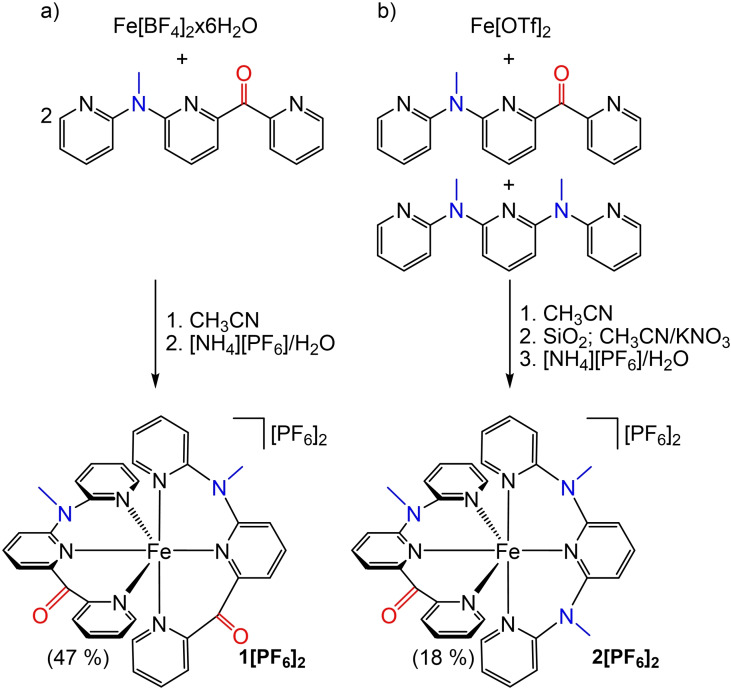
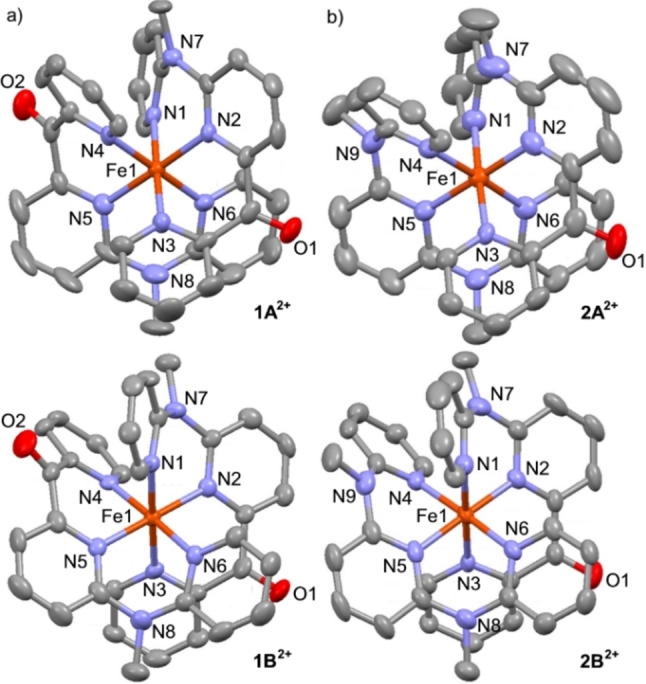
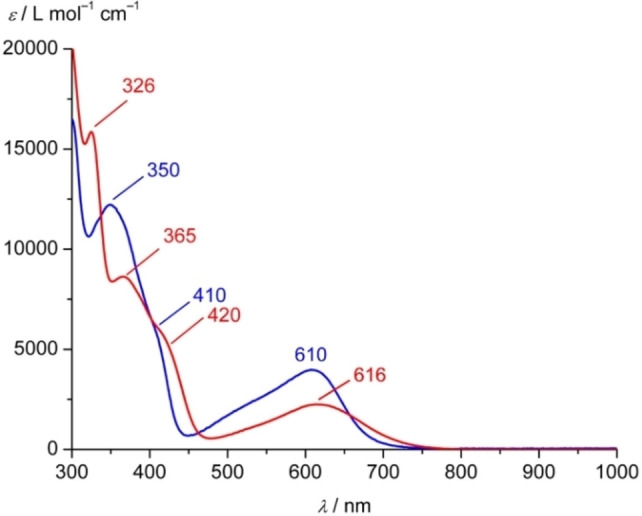
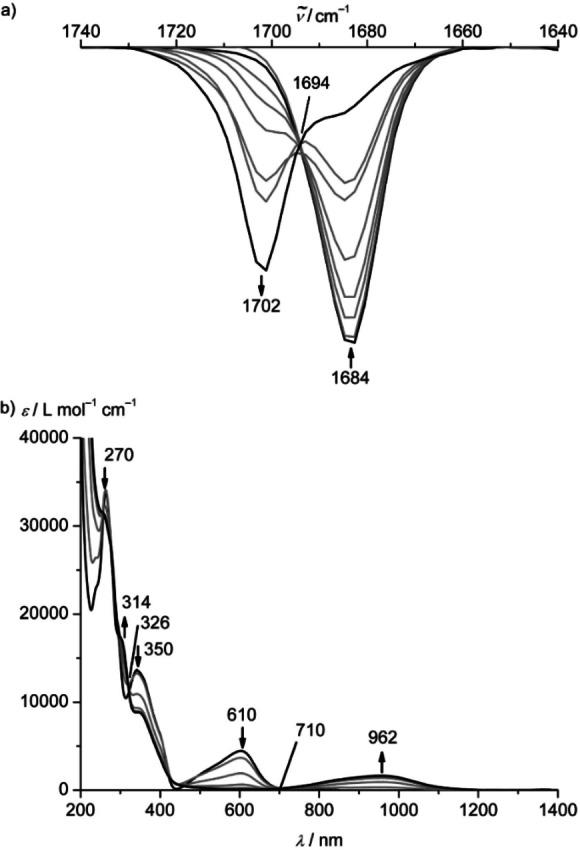
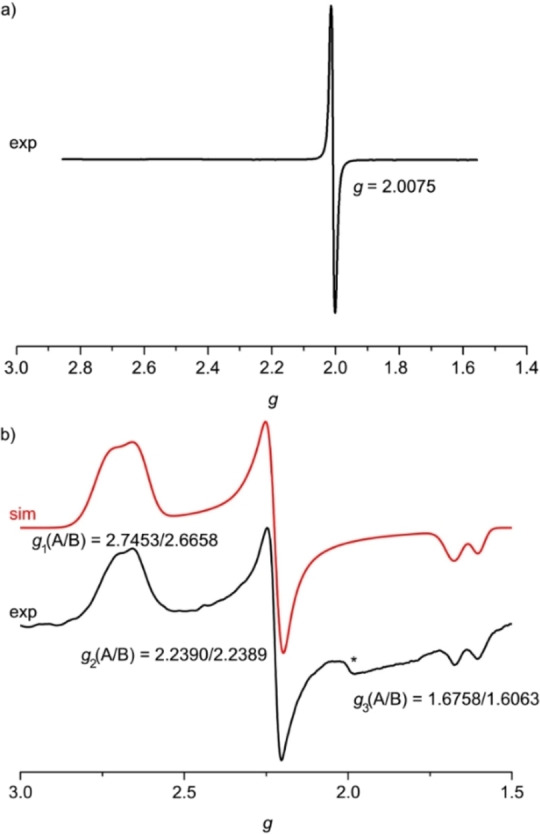
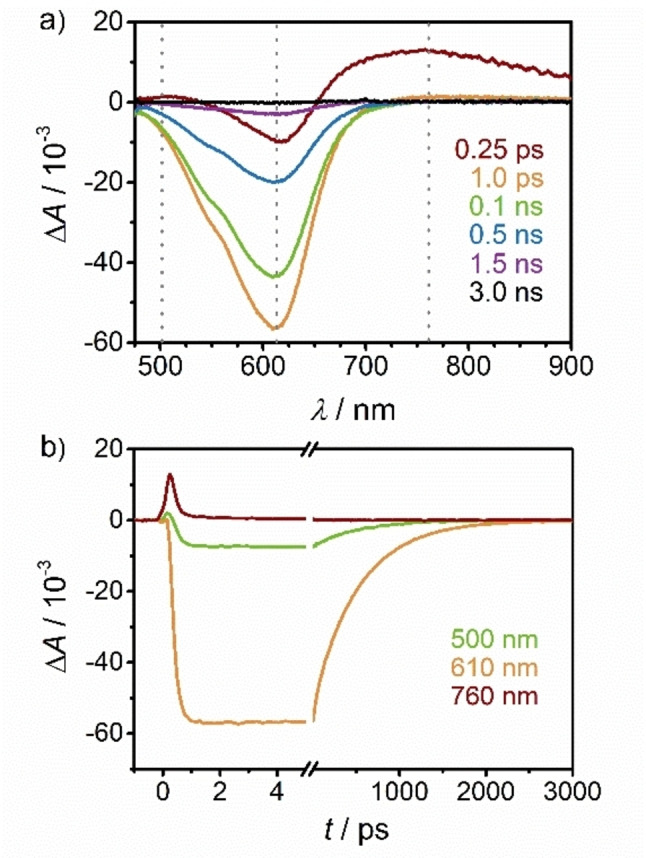
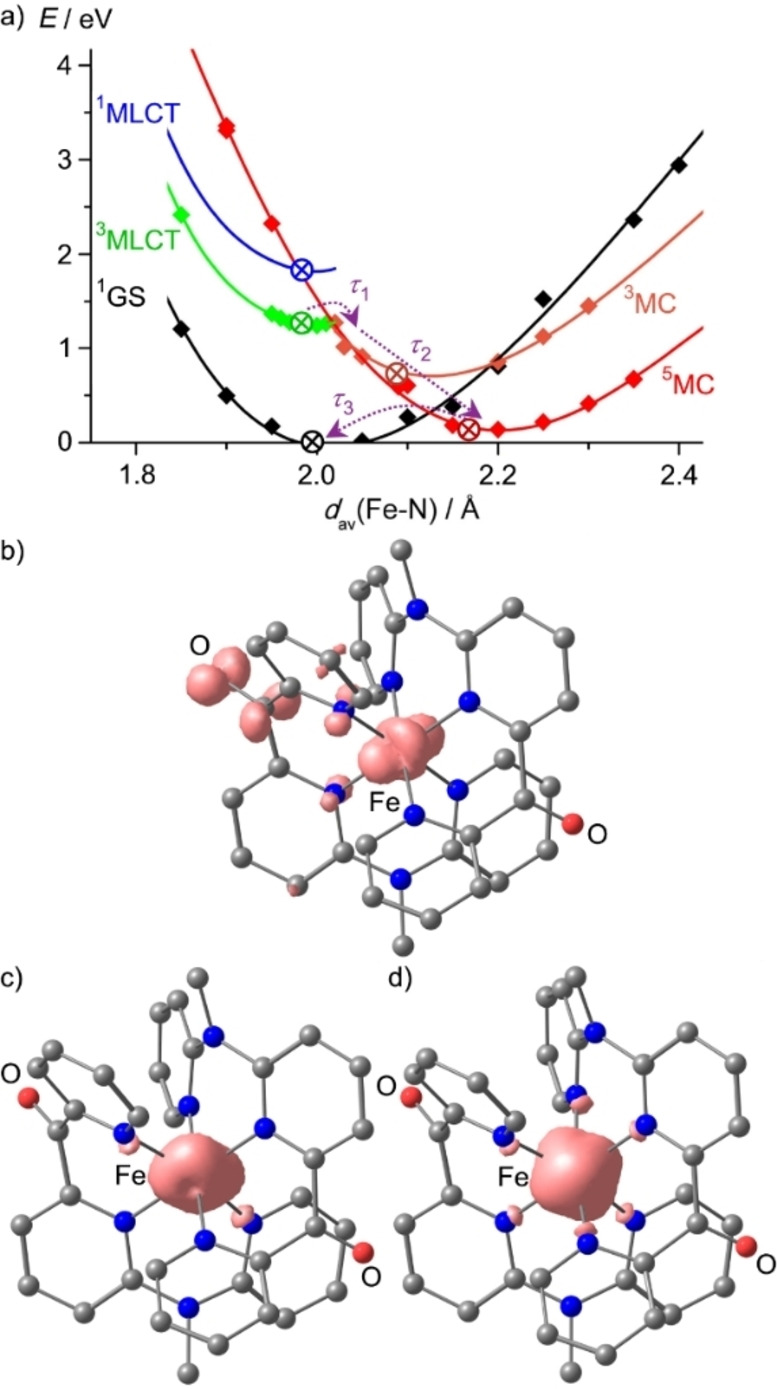
Increasing the metal-to-ligand charge transfer (MLCT) excited state lifetime of polypyridine iron(II) complexes can be achieved by lowering the ligand's π* orbital energy and by increasing the ligand field splitting. In the homo- and heteroleptic complexes [Fe(cpmp)2 ]2+ (12+ ) and [Fe(cpmp)(ddpd)]2+ (22+ ) with the tridentate ligands 6,2''-carboxypyridyl-2,2'-methylamine-pyridyl-pyridine (cpmp) and N,N'-dimethyl-N,N'-di-pyridin-2-ylpyridine-2,6-diamine (ddpd) two or one dipyridyl ketone moieties provide low energy π* acceptor orbitals. A good metal-ligand orbital overlap to increase the ligand field splitting is achieved by optimizing the octahedricity through CO and NMe units between the coordinating pyridines which enable the formation of six-membered chelate rings. The push-pull ligand cpmp provides intra-ligand and ligand-to-ligand charge transfer (ILCT, LL'CT) excited states in addition to MLCT excited states. Ground and excited state properties of 12+ and 22+ were accessed by X-ray diffraction analyses, resonance Raman spectroscopy, (spectro)electrochemistry, EPR spectroscopy, X-ray emission spectroscopy, static and time-resolved IR and UV/Vis/NIR absorption spectroscopy as well as quantum chemical calculations.
Keywords: iron; photophysics; polypyridine ligands; time-resolved spectroscopy; tridentate ligands.
© 2022 The Authors. Chemistry - A European Journal published by Wiley-VCH GmbH.
Conflict of interest statement
The authors declare no conflict of interest.
Figures

References
-
- Campagna S., Puntoriero F., Nastasi F., Bergamini G., Balzani V., Top. Curr. Chem. 2007, 280, 117–214.
-
- Sauvage J. P., Collin J. P., Chambron J. C., Guillerez S., Coudret C., Balzani V., Barigelletti F., de Cola L., Flamigni L., Chem. Rev. 1994, 94, 993–1019.
-
- Durham B., Caspar J. V., Nagle J. K., Meyer T. J., J. Am. Chem. Soc. 1982, 104, 4803–4810.
-
- O′Regan B., Grätzel M., Nature 1991, 353, 737–740.
-
- Yin J.-F., Velayudham M., Bhattacharya D., Lin H.-C., Lu K.-L., Coord. Chem. Rev. 2012, 256, 3008–3035.
Grants and funding
LinkOut - more resources
Full Text Sources
Research Materials
Miscellaneous
