. 2022 Jul 22;71(29):940-947.
doi: 10.15585/mmwr.mm7129e2.

Vital Signs: Drug Overdose Deaths, by Selected Sociodemographic and Social Determinants of Health Characteristics - 25 States and the District of Columbia, 2019-2020

Vital Signs: Drug Overdose Deaths, by Selected Sociodemographic and Social Determinants of Health Characteristics - 25 States and the District of Columbia, 2019-2020

Mbabazi Kariisa et al. MMWR Morb Mortal Wkly Rep. .

Abstract

Introduction: Drug overdose deaths increased approximately 30% from 2019 to 2020 in the United States. Examining rates by demographic and social determinants of health characteristics can identify disproportionately affected populations and inform strategies to reduce drug overdose deaths.

Methods: Data from the State Unintentional Drug Overdose Reporting System (SUDORS) were used to analyze overdose death rates from 2019 to 2020 in 25 states and the District of Columbia. Rates were examined by race and ethnicity and county-level social determinants of health (e.g., income inequality and treatment provider availability).

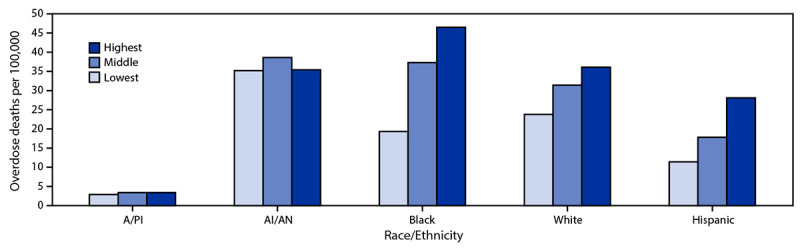
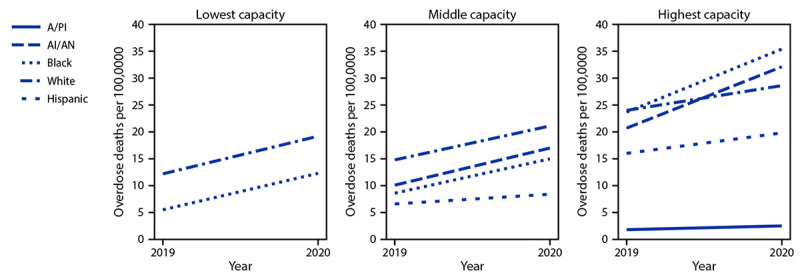
Results: From 2019 to 2020, drug overdose death rates increased by 44% and 39% among non-Hispanic Black (Black) and non-Hispanic American Indian or Alaska Native (AI/AN) persons, respectively. Significant disparities were found across sex, age, and racial and ethnic subgroups. In particular, the rate in 2020 among Black males aged ≥65 years (52.6 per 100,000) was nearly seven times that of non-Hispanic White males aged ≥65 years (7.7). A history of substance use was frequently reported. Evidence of previous substance use treatment was lowest for Black persons (8.3%). Disparities in overdose deaths, particularly among Black persons, were larger in counties with greater income inequality. Opioid overdose rates in 2020 were higher in areas with more opioid treatment program availability compared with areas with lower opioid treatment availability, particularly among Black (34.3 versus 16.6) and AI/AN (33.4 versus 16.2) persons.

Conclusions and implications for public health practice: Health disparities in overdose rates continue to worsen, particularly among Black and AI/AN persons; social determinants of health, such as income inequality, exacerbate these inequities. Implementation of available, evidence-based, culturally responsive overdose prevention and response efforts that address health disparities impacting disproportionately affected populations are urgently needed.


Conflict of interest statement

All authors have completed and submitted the International Committee of Medical Journal Editors form for disclosure of potential conflicts of interest. No potential conflicts of interest were disclosed.

Figures

FIGURE 1
FIGURE 1
Age-adjusted rates of drug overdose deaths, by race/ethnicity and income inequality ratio — 25 states and the District of Columbia, 2020 Abbreviations: A/PI = Asian or Pacific Islander; AI/AN = American Indian or Alaska Native. * Rates (overdose deaths per 100,000 population) age-adjusted to the 2000 U.S. standard population using the vintage year population of the data year. A/PI, AI/AN, Black, and White persons are non-Hispanic; Hispanic persons could be of any race. Data for Hispanic origin should be interpreted with caution; studies comparing Hispanic origin on death certificates and on U.S. Census Bureau surveys have shown inconsistent reporting on Hispanic ethnicity. Potential race misclassification might lead to underestimates for certain categories, primarily non-Hispanic A/PI and non-Hispanic AI/AN decedents. https://www.cdc.gov/nchs/data/series/sr_02/sr02_172.pdf § The 2021 County Health Rankings used data from the 2015–2019 American Community Survey for the income inequality ratio. Income inequality is defined as the ratio of household income at the 80th percentile to income at the 20th percentile (i.e., when the incomes of all households in a county are listed from highest to lowest, the 80th percentile is the level of income at which only 20% of households have higher incomes, and the 20th percentile is the level of income at which only 20% of households have lower incomes). A higher inequality ratio indicates greater division between the top and bottom ends of the income spectrum. The specific ranges for income inequality groups are defined as lowest (2.7–4.1), middle (4.2–4.7), and highest (4.8–10.5). Alaska, Connecticut, Delaware, District of Columbia, Georgia, Kentucky, Maine, Massachusetts, Minnesota, Nevada, New Hampshire, New Jersey, New Mexico, North Carolina, Ohio, Oklahoma, Rhode Island, Tennessee, Utah, Vermont, Virginia, and West Virginia were funded to report cause of death data on all overdose deaths within the jurisdiction in 2019 and 2020. Illinois, Missouri, Pennsylvania, and Washington were funded to report cause of death data on ≥75% of all overdose deaths within a jurisdiction in 2019 and 2020. Jurisdictions were included in rate calculations if they met data submission deadlines and addressed data entry errors in 2019 and 2020.
FIGURE 2
FIGURE 2
Changes in age-adjusted rates of opioid overdose deaths, by race/ethnicity and Drug Addiction Treatment Act–waived provider capacity tertile — 25 states and the District of Columbia, 2019–2020 Abbreviations: A/PI = Asian or Pacific Islander; AI/AN = American Indian or Alaska Native; DATA = Drug Addiction Treatment Act. * Rates (overdose deaths per 100,000 population) age-adjusted to the 2000 U.S. standard population using the vintage year population of the data year. Rates based on <20 deaths are not considered reliable and not reported. This suppression rule applied to A/PI and AI/AN persons in the lowest-capacity tertile as well as A/PI persons in the medium-capacity tertile for 2019 and 2020. The suppression rule also applied to Hispanic persons in the lowest-capacity tertile in 2019; however, the age-adjusted rate for Hispanic persons in 2020 (8.9 per 100,000) was not presented because it could not be compared with a 2019 rate. § A/PI, AI/AN, Black, and White persons are non-Hispanic; Hispanic persons could be of any race. Data for Hispanic origin should be interpreted with caution; studies comparing Hispanic origin on death certificates and on U.S. Census Bureau surveys have shown inconsistent reporting of Hispanic ethnicity. Potential race misclassification might lead to underestimates for certain categories, primarily non-Hispanic A/PI and non-Hispanic AI/AN decedents. https://www.cdc.gov/nchs/data/series/sr_02/sr02_172.pdf In 2000, DATA granted waivers to qualified physicians to prescribe buprenorphine in in-office settings for opioid use disorder treatment. In 2016, the Comprehensive Addiction and Recovery Act permitted nurse practitioners and physician assistants to obtain DATA waivers to prescribe buprenorphine. DATA-waived clinicians can provide office-based opioid treatment to 30, 100, or 275 patients at a given time. Potential treatment capacity was calculated by multiplying the number of DATA-waived providers by their maximum patient limit (30, 100, or 275 patients) and presented by tertile. The specific ranges for DATA-waived provider capacity are lowest capacity (0–119), middle capacity (120–769), and highest capacity (770–64,105). ** Alaska, Connecticut, Delaware, District of Columbia, Georgia, Kentucky, Maine, Massachusetts, Minnesota, Nevada, New Hampshire, New Jersey, New Mexico, North Carolina, Ohio, Oklahoma, Rhode Island, Tennessee, Utah, Vermont, Virginia, and West Virginia were funded to report cause of death data on all overdose deaths within the jurisdiction in 2019 and 2020. Illinois, Missouri, Pennsylvania, and Washington were funded to report cause of death data on ≥75% of all overdose deaths within a jurisdiction in 2019 and 2020. Jurisdictions were included in rate calculations if they met data submission deadlines and addressed data entry errors in 2019 and 2020.

Similar articles

Cited by

References

    1. Hedegaard H, Miniño AM, Spencer MR, Warner M. Drug overdose deaths in the United States, 1999–2020. NCHS data brief, no. 428. Hyattsville, MD: US Department of Health and Human Services, CDC, National Center for Health Statistics; 2021. 10.15620/cdc:112340 - DOI
    1. Friedman JR, Hansen H. Evaluation of increases in drug overdose mortality rates in the US by race and ethnicity before and during the COVID-19 pandemic. JAMA Psychiatry 2022;79:379–81. 10.1001/jamapsychiatry.2022.0004 - DOI - PMC - PubMed
    1. Mattson CL, Tanz LJ, Quinn K, Kariisa M, Patel P, Davis NL. Trends and geographic patterns in drug and synthetic opioid overdose deaths—United States, 2013–2019. MMWR Morb Mortal Wkly Rep 2021;70:202–7. 10.15585/mmwr.mm7006a4 - DOI - PMC - PubMed
    1. O’Donnell J, Tanz LJ, Gladden RM, Davis NL, Bitting J. Trends in and characteristics of drug overdose deaths involving illicitly manufactured fentanyls—United States, 2019–2020. MMWR Morb Mortal Wkly Rep 2021;70:1740–6. 10.15585/mmwr.mm7050e3 - DOI - PMC - PubMed
    1. Kariisa M, Scholl L, Wilson N, Seth P, Hoots B. Drug overdose deaths involving cocaine and psychostimulants with abuse potential—United States, 2003–2017. MMWR Morb Mortal Wkly Rep 2019;68:388–95. 10.15585/mmwr.mm6817a3 - DOI - PMC - PubMed

Substances