. 2022 Jul 21;17(7):e0271730.
doi: 10.1371/journal.pone.0271730. eCollection 2022.

Alteration of osteoclast activity in childhood cancer survivors: Role of iron and of CB2/TRPV1 receptors

Affiliations

Alteration of osteoclast activity in childhood cancer survivors: Role of iron and of CB2/TRPV1 receptors

Francesca Rossi et al. PLoS One. .

Abstract

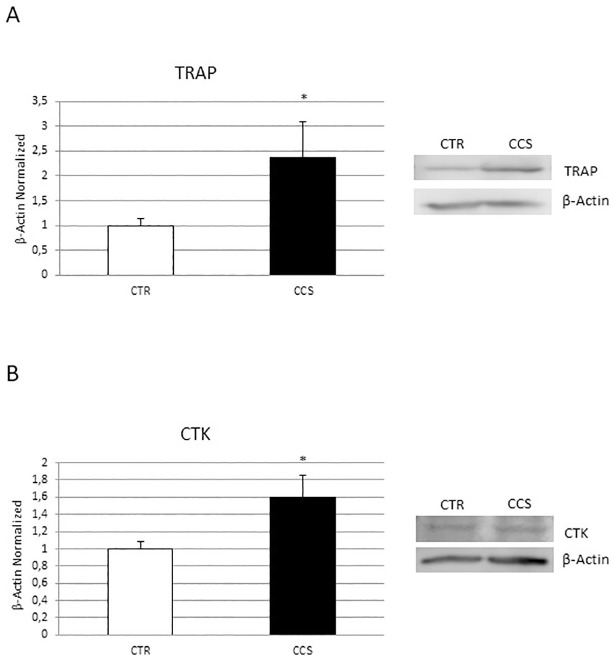
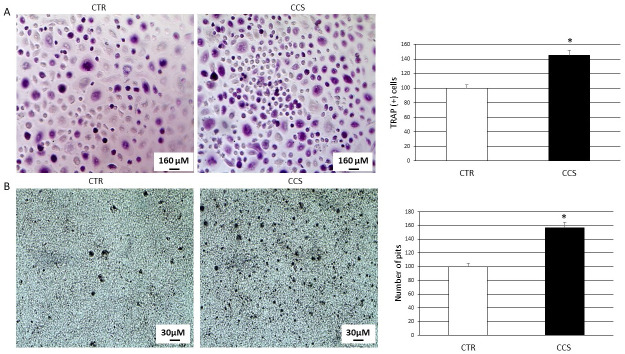
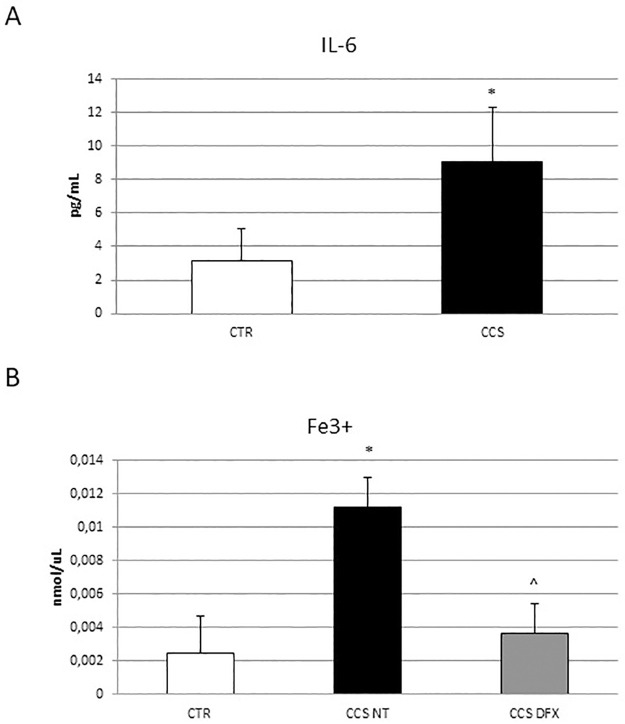
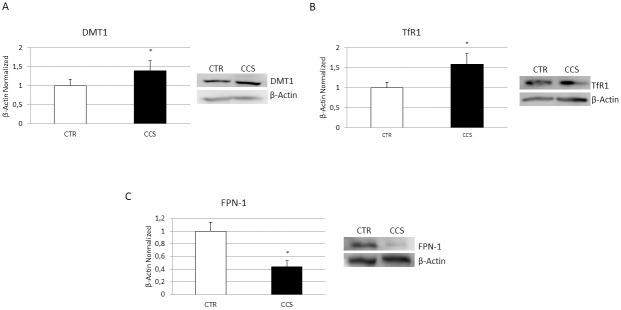
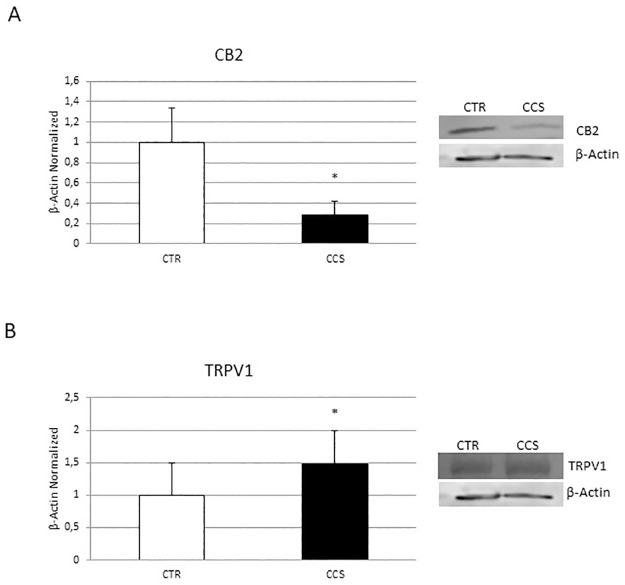
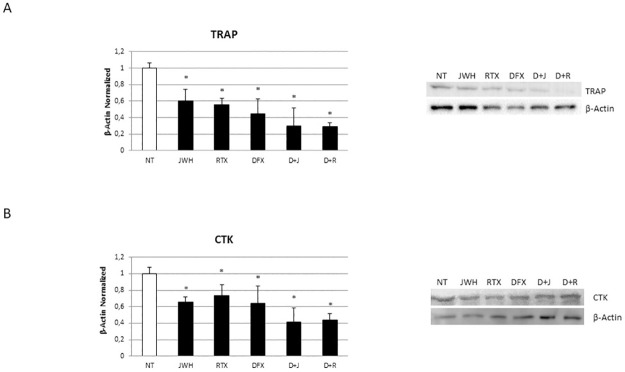
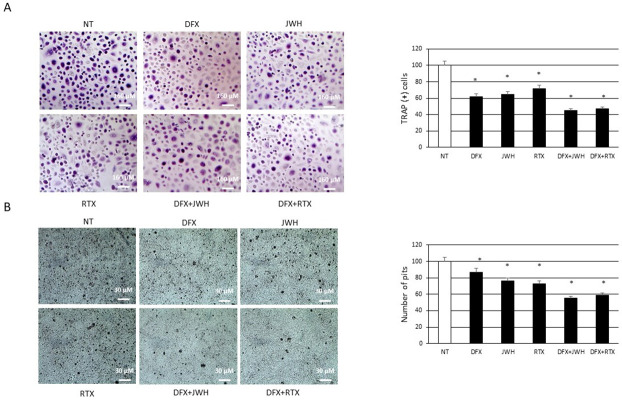
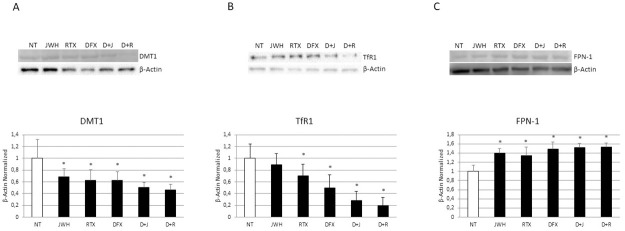
Childhood cancer survivors (CCS) are predisposed to the onset of osteoporosis (OP). It is known that iron overload induces osteoclasts (OCs) overactivity and that the iron chelator Deferasirox (DFX) can counteract it. The Cannabinoid Receptor type 2 (CB2) and the transient receptor potential vanilloid type-1 (TRPV1) are potential therapeutic targets for OP. In this study we isolated OCs from peripheral blood of 20 CCS and investigated osteoclast biomarkers expression and iron metabolism evaluating iron release by OCs and the expression of several molecules involved in its regulation. Moreover, we analyzed the effects of CB2 and TRPV1 stimulation in combination with DFX on osteoclast activity and iron metabolism. We observed, for the first time, an osteoclast hyperactivation in CCS suggesting a role for iron in its development. Moreover, we confirmed the well-known role of CB2 and TRPV1 receptors in bone metabolism, suggesting the receptors as possible key biomarkers of bone damage. Moreover, we demonstrated a promising synergism between pharmacological compounds, stimulating CB2 or inhibiting/desensitizing TRPV1 and DFX, in counteracting osteoclast overactivity in CCS to improve their quality of life.


Conflict of interest statement

No authors have competing interests.

Figures

Fig 1
Fig 1. Characterization of OCs derived from CCS.
TRAP (A), Cathepsin K (CTK) (B) protein expression in osteoclasts (OCs) from 5 Childhood cancer survivors (CCS) compared with OCs from 5 healthy subjects (CTR), determined by Western Blot starting from 15μg of total lysate. The most representative images are showed. The Image Studio Digits software has been used for the protein bands density detection. The intensity ratios of immunoblots compared to CTR, considered as 1, were quantified after normalization with the housekeeping protein β-Actin. Histograms represent the relative quantification for TRAP and CTK expression as mean ± SD of independent experiments on each individual sample. For statistical analysis it has been used a t-test. *Indicates p ≤ 0.05 compared to CTR.
Fig 2
Fig 2
(A) TRAP assay on 5 CCS compared with OCs from 5 CTR. The most representative images are displayed (10x magnification). An AE2000 inverted microscope has been used to count TRAP (+) multinucleated (n ≥ 3) OCs (stained purple) in at least three different wells for each individual sample. Histogram shows the percentage number of TRAP (+) cells respect to the total cell number for each sample as mean ± SD. (B) Bone resorption assay on 5 CCS compared with OCs from 5 CTR. The most representative images are displayed (10x magnification). An AE2000 inverted microscope has been used to count the pits (represented in the image as darker areas) on the plate in at least three different wells for each individual sample. Histogram shows the percentage number of pits as mean ± SD. For statistical analysis it has been used a t-test. *Indicates p ≤ 0.05 compared to CTR.
Fig 3
Fig 3. IL-6 and iron release in OCs derived from CCS.
(A) Concentration of IL-6 (pg/mL) in 5 Childhood cancer survivors (CCS) compared to OCs from 5 healthy subjects (CTR) determined by ELISA Assay. Histogram shows concentration of IL-6 expressed as mean ± S.D. of independent experiments on each individual sample. Concentration of cytokine was calculated on a standard concentration curve. For statistical analysis it has been used a t-test. *Indicates p ≤ 0.05 compared to CTR. (B) Fe3+ intracellular concentrations (nmol/μL) in 5 Childhood cancer survivors (CCS) before and after Deferoxamine (DFX) [5μM] administration compared to OCs from 5 healthy subjects (CTR) detected by Iron Assay. Histogram shows concentration of Fe3+ expressed as the mean ± SD of independent experiments on each individual sample. For statistical analysis it has been used ANOVA test followed by a post hoc test. *Indicates p ≤ 0.05 compared to CTR. ^ indicates p ≤ 0.05 compared to CCS NT.
Fig 4
Fig 4. Iron metabolism in OCs derived from CCS.
Protein expression of DMT1 (A), Transferrin Receptor 1, TfR1(B), Ferroportin, FPN1 (C) in OCs from 5 Childhood cancer survivors (CCS) compared with OCs from 5 healthy subjects (CTR), determined by Western Blot starting from 15μg of total lysate. The most representative images are showed. The Image Studio Digits software has been used for the protein bands density detection. The intensity ratios of immunoblots compared to CTR, considered as 1, were quantified after normalization with the housekeeping protein β-Actin. Histogram show the relative quantification for DMT1, TfR1 and FPN-1 as mean ± SD of independent experiments on each individual sample. For statistical analysis it has been used a t-test. *Indicates p ≤ 0.05 compared to CTR.
Fig 5
Fig 5. CB2 and TRPV1 expression in OCs derived from CCS.
Protein expression of CB2 (A) and TRPV1 (B) in OCs from 5 Childhood cancer survivors (CCS) compared with OCs from 5 healthy subjects (CTR), determined by Western Blot starting from 15μg of total lysate. The most representative images are showed. The Image Studio Digits software has been used for the protein bands density detection. The intensity ratios of immunoblots compared to CTR, considered as 1, were quantified after normalization with the housekeeping protein β-Actin. Histogram shows the relative quantification for CB2 and TRPV1 expression as mean ± SD of independent experiments on each individual sample. For statistical analysis it has been used a t-test. *Indicates p ≤ 0.05 compared to CTR.
Fig 6
Fig 6. Effects of treatments on osteoclast biomarkers expression.
Protein expression of TRAP (A) and Cathepsin K (CTK) (B) in OCs, differentiated or not in presence of DFX [5μM], from 5 Childhood cancer survivors (CCS) after 48h of exposure with JWH-133 [100nM] and RTX [5μM], determined by Western Blot starting from 15 μg of total lysate. The most representative images are showed. The Image Studio Digits software has been used for the protein bands density detection. The intensity ratios of immunoblots compared to CTR, considered as 1, were quantified after normalization with the housekeeping protein β-Actin. Histogram shows the relative quantification for TRAP and CTK as mean ± SD of independent experiments on each individual sample. For statistical analysis it has been used ANOVA test followed by a post hoc test. *Indicates p ≤ 0.05 compared to the untreated control (NT).
Fig 7
Fig 7. Effects of treatments on osteoclast number and activity.
(A) TRAP assay on OCs, differentiated or not in presence of DFX [5μM], from 5 Childhood cancer survivors (CCS) after 48h of exposure with JWH-133 [100nM] and RTX [5μM]. The most representative images are showed (10x magnification). An AE2000 inverted microscope has been used to count TRAP (+) multinucleated (n ≥ 3) OCs (stained purple) in at least three different wells for each individual sample. Histogram shows the percentage number of TRAP (+) cells respect to the total cell number for each sample as mean ± SD. (B) Bone resorption assay on OCs, differentiated or not in presence of DFX [5μM], from 5 Childhood cancer survivors (CCS) after 48h of exposure with JWH-133 [100nM] and RTX [5μM]. The most representative images are displayed (10x magnification). An AE2000 inverted microscope has been used to count the pits (represented in the image as darker areas) on the plate in at least three different wells for each individual sample. Histogram shows the percentage number of pits as mean ± SD. For statistical analysis it has been used ANOVA test followed by a post hoc test. *Indicates p ≤ 0.05 compared to the untreated control (NT).
Fig 8
Fig 8. Effects of treatments on iron metabolism.
Protein expression of DMT1 (A), Transferrin Receptor 1, TfF1(B), Ferroportin, FPN1 (C) in OCs, differentiated or not in presence of DFX [5μM], from 5 Childhood cancer survivors (CCS) after 48h of exposure with JWH-133 [100nM] and RTX [5μM], determined by Western Blot starting from 15 μg of total lysate. The most representative images are showed. The Image Studio Digits software has been used for the protein bands density detection. The intensity ratios of immunoblots compared to CTR, considered as 1, were quantified after normalization with the housekeeping protein β-Actin. Histogram shows the relative quantification for DMT1, TfR1, FPN1 expression is presented in histogram as mean ± SD of independent experiments on each individual sample. For statistical analysis it has been used ANOVA test followed by a post hoc test. *Indicates p ≤ 0.05 compared to the untreated control (NT).

Similar articles

Cited by

References

    1. Chemaitilly W, Cohen LE, Mostoufi-Moab S, Patterson BC, Simmons JH, Meacham LR, et al.. Endocrine Late Effects in Childhood Cancer Survivors. J Clin Oncol. 2018;36(21):2153–9. doi: 10.1200/JCO.2017.76.3268 . - DOI - PubMed
    1. Landier W, Skinner R, Wallace WH, Hjorth L, Mulder RL, Wong FL, et al.. Surveillance for Late Effects in Childhood Cancer Survivors. J Clin Oncol. 2018;36(21):2216–22. doi: 10.1200/JCO.2017.77.0180 . - DOI - PMC - PubMed
    1. Hayek S, Gibson TM, Leisenring WM, Guida JL, Gramatges MM, Lupo PJ, et al.. Prevalence and Predictors of Frailty in Childhood Cancer Survivors and Siblings: A Report From the Childhood Cancer Survivor Study. J Clin Oncol. 2020;38(3):232–47. doi: 10.1200/JCO.19.01226 . - DOI - PMC - PubMed
    1. Ness KK, Armstrong GT, Kundu M, Wilson CL, Tchkonia T, Kirkland JL. Frailty in childhood cancer survivors. Cancer. 2015;121(10):1540–7. doi: 10.1002/cncr.29211 . - DOI - PMC - PubMed
    1. Zuo L, Prather ER, Stetskiv M, Garrison DE, Meade JR, Peace TI, et al.. Inflammaging and Oxidative Stress in Human Diseases: From Molecular Mechanisms to Novel Treatments. Int J Mol Sci. 2019;20(18). doi: 10.3390/ijms20184472 . - DOI - PMC - PubMed

Publication types