. 2022 Jul 21;17(7):e0271377.
doi: 10.1371/journal.pone.0271377. eCollection 2022.

Automated breast lesion localisation in microwave imaging employing simplified pulse coupled neural network

Affiliations

Automated breast lesion localisation in microwave imaging employing simplified pulse coupled neural network

Maitreyee Dey et al. PLoS One. .

Abstract

MammoWave is a microwave imaging device for breast lesion detection, employing two antennas which rotate azimuthally (horizontally) around the breast. The antennas operate in the 1-9 GHz band and are set in free space, i.e., pivotally, no matching liquid is required. Microwave images, subsequently obtained through the application of Huygens Principle, are intensity maps, representing the homogeneity of the dielectric properties of the breast tissues under test. In this paper, MammoWave is used to realise tissues dielectric differences and localise lesions by segmenting microwave images adaptively employing pulse coupled neural network (PCNN). Subsequently, a non-parametric thresholding technique is modelled to differentiate between breasts having no radiological finding (NF) or benign (BF) and breasts with malignant finding (MF). Resultant findings verify that automated breast lesion localization with microwave imaging matches the gold standard achieving 81.82% sensitivity in MF detection. The proposed method is tested on microwave images acquired from a feasibility study performed in Foligno Hospital, Italy. This study is based on 61 breasts from 35 patients; performance may vary with larger number of datasets and will be subsequently investigated.


Conflict of interest statement

Lorenzo Sani, Alessandro Vispa and Giovanni Raspa are employed by UBT - Umbria Bioengineering Technologies. Gianluigi Tiberi and Lorenzo Sani are shareholders of UBT - Umbria Bioengineering Technologies. This does not alter our adherence to PLOS ONE policies on sharing data and materials.

Figures

Fig 1
Fig 1. Flow chart of the proposed work; the clinical data collection procedure using MammoWave system and the proposed lesion localisation using the MammoWave created images.
Fig 2
Fig 2. The apparatus measurement procedure; the antennas inside the container (covered to absorb microwaves) are fitted at the constant height, in free space and can rotate across the azimuth for collecting the microwave signals from diverse angular locations.
For every transmitting and receiving spot, the complex S21 is gathered from 1 to 9 GHz, along with 5 MHz sampling.
Fig 3
Fig 3. Microwave images of a single breast for different conductivity level generated via the MammoWave signal.
(a) represent the image created for σ1 conductivity level, (b) represent the image created for σ2 conductivity, (c) represent the image created for σ3 conductivity, and (d) represent the image created for σ4 conductivity. Images given here are two-dimensional (2D) image in the azimuthal, i.e. coronal, plane. The x-axis and y-axis are given in meter and the colour bar represents the intensity in arbitrary units.
Fig 4
Fig 4. The flow graph of the adaptive image segmentation using PCNN [31].
Fig 5
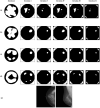
Fig 5. Six PCNN iterations for one MF breast images for different conductivity (a) input image formed using σ1, (b) input image formed using σ2, (c) input image formed using σ3, and (d) input image formed using σ4.
The radiologist study review “MF” for this heterogeneously dense breast has been obtained with the support of mammography images given in the bottom row, giving as output the presence of a cluster of microcalcifications, plus follow-up.
Fig 6
Fig 6. The results obtained over PCNN iterations for one of the NF+BF breast images with different conductivity: (a) Input image formed using σ1, (b) input image formed using σ2, (c) input image formed using σ3, and (d) input image formed using σ4.
The radiologist study review “NF” for this scattered area of fibroglandular density breast has been obtained with the support of mammography images given in the bottom row.
Fig 7
Fig 7. Box whisker plot for the examined breast images with the thresholding.
61 breasts’ data have been filtered through Gaussian kernel to decide the threshold value, where the x-axis represent the number of breasts’ index and y-axis represent the peak intensity (arbitrary units) of each breast.
Fig 8
Fig 8. Confusion matrix obtained from the non-parametric thresholding method.

References

    1. Onega Tracy, et al.. “Facility mammography volume in relation to breast cancer screening outcomes.” Journal of medical screening 23.1 (2016): 31–37. doi: 10.1177/0969141315595254 - DOI - PubMed
    1. Wang J, Gottschal P, Ding L, van Veldhuizen DW, Lu W, Houssami N, et al.. Mammographic sensitivity as a function of tumour size: a novel estimation based on population-based screening data. The Breast. 2020. Dec 9. doi: 10.1016/j.breast.2020.12.003 - DOI - PMC - PubMed
    1. Seiffert K, Thoene K, Zu Eulenburg C, Behrens S, Schmalfeldt B, Becher H, et al.. The effect of family history on screening procedures and prognosis in breast cancer patients-Results of a large population-based case-control study. The Breast. 2020. Dec 24. doi: 10.1016/j.breast.2020.12.008 - DOI - PMC - PubMed
    1. Moloney B.M.; O’Loughlin D.; Abd Elwahab S.; Kerin M.J. Breast Cancer Detection—A Synopsis of Conventional Modalities and the Potential Role of Microwave Imaging. Diagnostics 2020, 10, 103. doi: 10.3390/diagnostics10020103 - DOI - PMC - PubMed
    1. Meaney Paul M., et al.. “Initial clinical experience with microwave breast imaging in women with normal mammography.” Academic radiology 14.2 (2007): 207–218. doi: 10.1016/j.acra.2006.10.016 - DOI - PMC - PubMed

Publication types