. 2022 Jul 21;17(7):e0271725.
doi: 10.1371/journal.pone.0271725. eCollection 2022.

Epigenetic and transcriptome responsiveness to ER modulation by tissue selective estrogen complexes in breast epithelial and breast cancer cells

Affiliations

Epigenetic and transcriptome responsiveness to ER modulation by tissue selective estrogen complexes in breast epithelial and breast cancer cells

Terri L Messier et al. PLoS One. .

Abstract

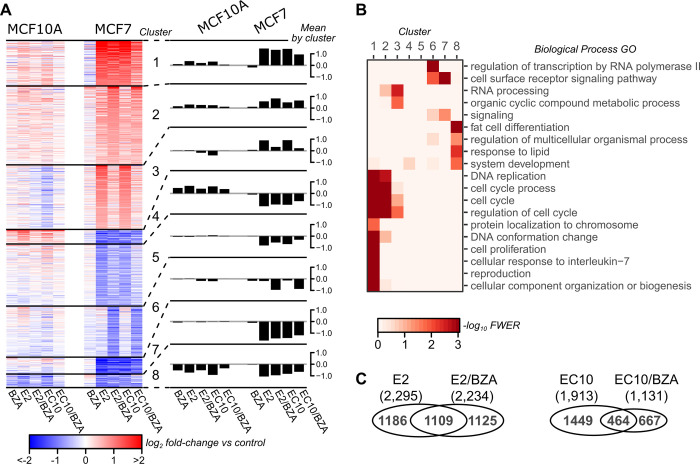
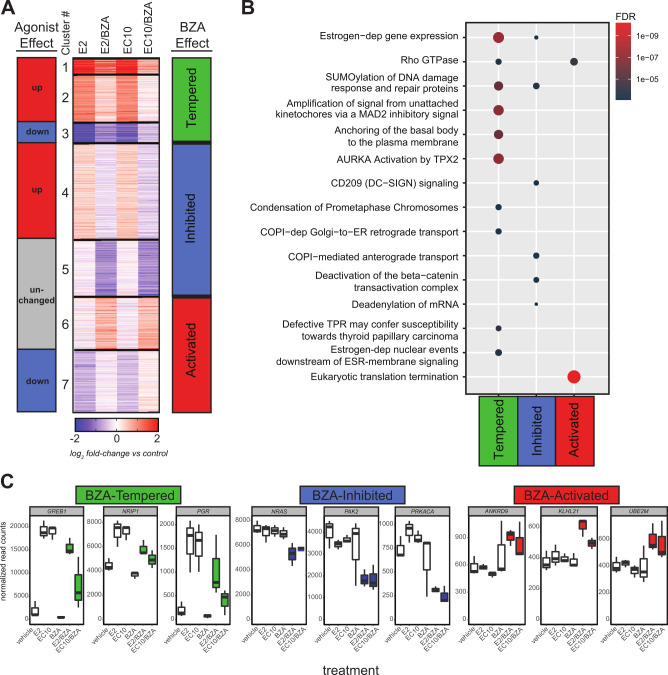
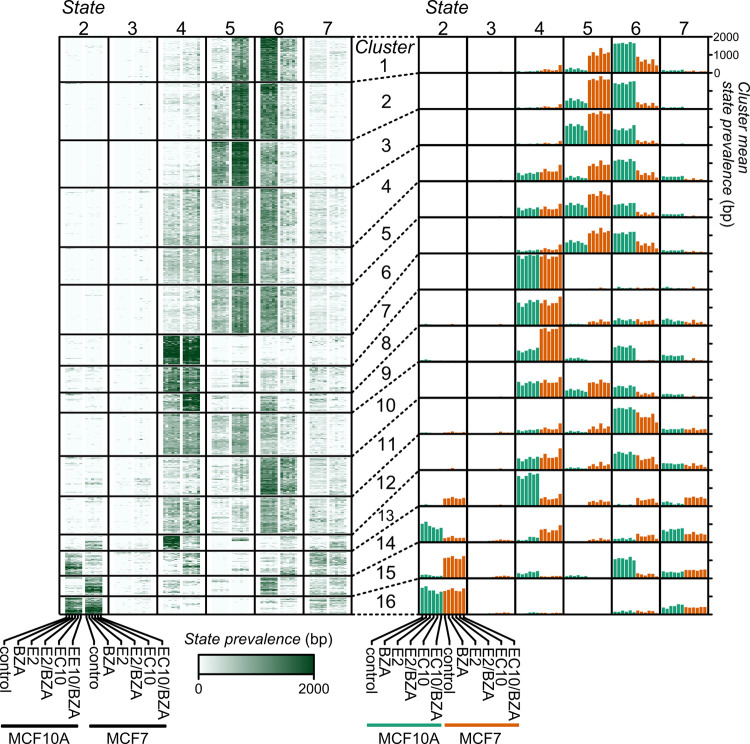
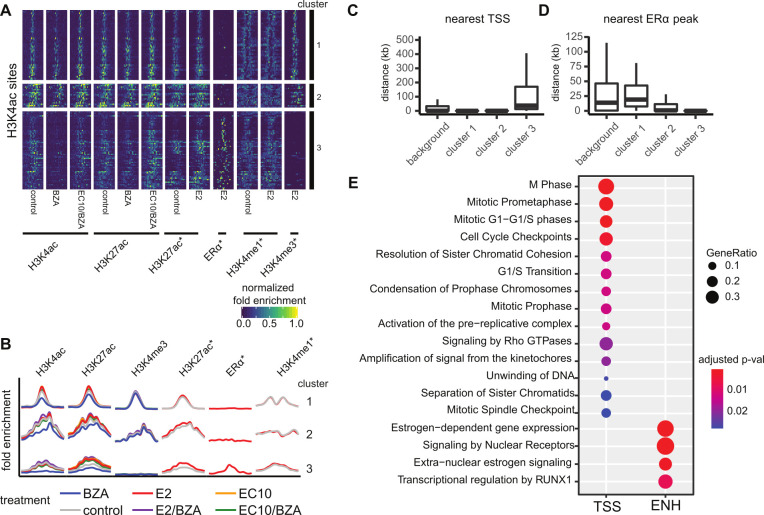
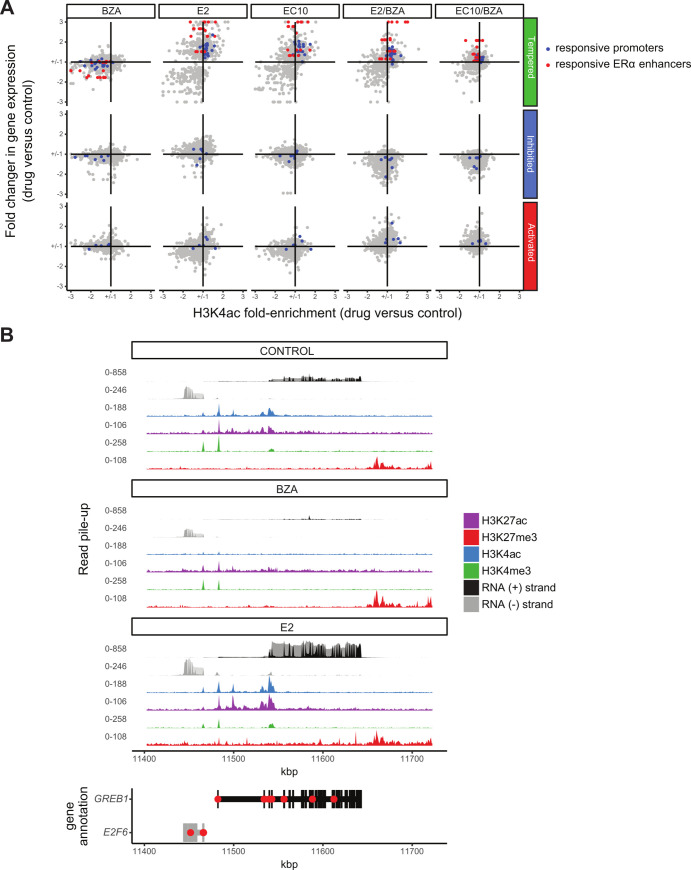
Selective estrogen receptor modulators (SERMs), including the SERM/SERD bazedoxifene (BZA), are used to treat postmenopausal osteoporosis and may reduce breast cancer (BCa) risk. One of the most persistent unresolved questions regarding menopausal hormone therapy is compromised control of proliferation and phenotype because of short- or long-term administration of mixed-function estrogen receptor (ER) ligands. To gain insight into epigenetic effectors of the transcriptomes of hormone and BZA-treated BCa cells, we evaluated a panel of histone modifications. The impact of short-term hormone treatment and BZA on gene expression and genome-wide epigenetic profiles was examined in ERαneg mammary epithelial cells (MCF10A) and ERα+ luminal breast cancer cells (MCF7). We tested individual components and combinations of 17β-estradiol (E2), estrogen compounds (EC10) and BZA. RNA-seq for gene expression and ChIP-seq for active (H3K4me3, H3K4ac, H3K27ac) and repressive (H3K27me3) histone modifications were performed. Our results show that the combination of BZA with E2 or EC10 reduces estrogen-mediated patterns of histone modifications and gene expression in MCF-7ERα+ cells. In contrast, BZA has minimal effects on these parameters in MCF10A mammary epithelial cells. BZA-induced changes in histone modifications in MCF7 cells are characterized by altered H3K4ac patterns, with changes at distal enhancers of ERα-target genes and at promoters of non-ERα bound proliferation-related genes. Notably, the ERα target gene GREB1 is the most sensitive to BZA treatment. Our findings provide direct mechanistic-based evidence that BZA induces epigenetic changes in E2 and EC10 mediated control of ERα regulatory programs to target distinctive proliferation gene pathways that restrain the potential for breast cancer development.


Conflict of interest statement

The authors have declared that no competing interests exist.

Figures

Fig 1
Fig 1. Gene expression changes with SERM/SERD treatments (bazedoxifene–BZA) in MCF10A and MCF7 cell lines, as evaluated by RNA-seq.
A) Clustering of 3,820 differentially expressed genes. Values are average log2 fold change (FC) of normalized counts in 3 independent replicates relative to the untreated control for each cell line. Eight clusters were calculated using k-means. Data for individual genes are presented in the left panel heatmap, and mean values (log2 fold-change) in each cluster are presented in the right panel barplots. B) Biological process gene ontology (GO) enrichment per cluster. Terms shown are the least redundant terms as determined by REViGO. C) Venn diagram comparing differentially expressed genes in MCF7 between E2 vs E2/BZA (left) and EC10 versus EC10/BZA (right); each of the 4 groups are relative to control.
Fig 2
Fig 2. BZA alters steroid responsiveness in the MCF7 cell line.
A) Clustering analysis of 2,332 genes comparing BZA-induced changes in E2 or EC10 responses. There are seven distinct clusters that group into different agonist effect groups (E2 or EC10) or into three different BZA-effect groups (Tempered, Inhibited, Activated) based on the effect of BZA on agonist responses. B) Reactome pathway enrichment analysis of BZA-effect groups from Fig 2A. The top enriched Reactome gene sets are shown in dot plot, where each dot is an enriched gene set, the color represents the significance, and the size signifies the gene set size. C) Normalized RNA-seq expression values of selected genes from each BZA-effect group (Tempered, Inhibited, Activated). Data shown are from MCF7 RNA-seq DESeq2-normalized read counts from each treatment group (n = 3 replicates per group). The E2/BZA and EC10/BZA treatments are color-coded according to the BZA-effect groups from Fig 2A.
Fig 3
Fig 3. Chromatin state dynamics near RefSeq gene Transcription Start Sites (TSS) in MCF10A and MCF7 cells treated with bazedoxifene.
The number of base pairs assigned to each state is within a 2kb window centered on 18,614 TSSs clustered and presented in heatmaps (left) or aggregated barplots (right). State 1 is omitted due to its extreme rarity in order to improve clarity. Minor columns represent the prevalence of the state in each cell line and treatment combination as indicated at the bottom, repeating in each major column (left panel). For the right panel, the clusters are summarized by mean value and the columns are arranged as in the left panel. Chromatin states: 2 –repression; 3 –mixed signal; 4 –low signal; 5 –active; 6 –poised; 7 –low signal.
Fig 4
Fig 4. H3K4ac is regulated in response to bazedoxifene treatment in MCF7 cells.
Clustering of 130 differentially enriched H3K4ac marked regions reveals two distinct epigenetic signatures. A) Heatmap of enrichment profiles across genomic regions within 4kb of H3K4ac sites clustered using k-means (k = 3). B) Aggregated mean profiles of clusters identified in A; the x-axis corresponds to the mean normalized fold-enrichment values. C) Distance by cluster from each site to the nearest transcript start site (TSS) of a protein-coding gene. D) Distance by cluster from each site to the nearest ERα peak. E) KEGG enrichment analysis of pathways associated with genes nearby cluster 1 and 2 promoter proximal regions (TSS) or cluster 3 enhancer (ENH) regions.
Fig 5
Fig 5. Changes in H3K4ac correspond to expression changes for nearby genes.
A) Scatterplots showing the fold-change in gene expression versus the fold-enrichment change in H3K4ac signal for each drug treatment versus control, respectively. The two types of significantly differentially enriched H3K4ac regions are shown separately for genes that belong to each BZA-effect group (Tempered, Inhibited and Activated). The color of the dots is based on clustering from Fig 4 and corresponds to the genes of non-ERα bound promoters (blue points) and ERα bound enhancers (red points). Fold enrichment changes are capped at 3 for each comparison. B) Effects of BZA and E2 on GREB1 gene expression and histone modifications relative to Control.

Similar articles

Cited by

References

    1. Rossouw JE, Anderson GL, Prentice RL, LaCroix AZ, Kooperberg C, Stefanick ML, et al.. Risks and benefits of estrogen plus progestin in healthy postmenopausal women: principal results From the Women’s Health Initiative randomized controlled trial. JAMA. 2002;288(3):321–33. doi: 10.1001/jama.288.3.321 - DOI - PubMed
    1. Tsai SA, Stefanick ML, Stafford RS. Trends in menopausal hormone therapy use of US office-based physicians, 2000–2009. Menopause. 2011;18(4):385–92. doi: 10.1097/gme.0b013e3181f43404 - DOI - PMC - PubMed
    1. Komm BS, Mirkin S. An overview of current and emerging SERMs. The Journal of steroid biochemistry and molecular biology. 2014;143:207–22. doi: 10.1016/j.jsbmb.2014.03.003 - DOI - PubMed
    1. Mirkin S, Pickar JH. Selective estrogen receptor modulators (SERMs): a review of clinical data. Maturitas. 2015;80(1):52–7. doi: 10.1016/j.maturitas.2014.10.010 - DOI - PubMed
    1. Pickar JH, MacNeil T, Ohleth K. SERMs: progress and future perspectives. Maturitas. 2010;67(2):129–38. doi: 10.1016/j.maturitas.2010.05.009 - DOI - PubMed

Publication types

MeSH terms