. 2022 Aug 10;96(15):e0068922.
doi: 10.1128/jvi.00689-22. Epub 2022 Jul 12.

A Virion-Based Combination Vaccine Protects against Influenza and SARS-CoV-2 Disease in Mice

Affiliations

A Virion-Based Combination Vaccine Protects against Influenza and SARS-CoV-2 Disease in Mice

Ryan R Chaparian et al. J Virol. .

Abstract

Vaccines targeting SARS-CoV-2 have been shown to be highly effective; however, the breadth against emerging variants and the longevity of protection remains unclear. Postimmunization boosting has been shown to be beneficial for disease protection, and as new variants continue to emerge, periodic (and perhaps annual) vaccination will likely be recommended. New seasonal influenza virus vaccines currently need to be developed every year due to continual antigenic drift, an undertaking made possible by a robust global vaccine production and distribution infrastructure. To create a seasonal combination vaccine targeting both influenza viruses and SARS-CoV-2 that is also amenable to frequent reformulation, we have developed an influenza A virus (IAV) genetic platform that allows the incorporation of an immunogenic domain of the SARS-CoV-2 spike (S) protein onto IAV particles. Vaccination with this combination vaccine elicited neutralizing antibodies and provided protection from lethal challenge with both pathogens in mice. This approach may allow the leveraging of established influenza vaccine infrastructure to generate a cost-effective and scalable seasonal vaccine solution for both influenza and coronaviruses. IMPORTANCE The rapid emergence of SARS-CoV-2 variants since the onset of the pandemic has highlighted the need for both periodic vaccination "boosts" and a platform that can be rapidly reformulated to manufacture new vaccines. In this work, we report an approach that can utilize current influenza vaccine manufacturing infrastructure to generate combination vaccines capable of protecting from both influenza virus- and SARS-CoV-2-induced disease. The production of a combined influenza/SARS-CoV-2 vaccine may represent a practical solution to boost immunity to these important respiratory viruses without the increased cost and administration burden of multiple independent vaccines.

Keywords: SARS-CoV-2; influenza vaccines.


Conflict of interest statement

The authors declare a conflict of interest. Duke University has filed for intellectual property protection of the approaches in this manuscript.

Figures

FIG 1
FIG 1
Generation of an IAV that encodes a vaccine antigen in the HA segment. (A) Diagram showing genetic modulation of the HA segment to enable insertion of a foreign ORF. The SARS-CoV-2 RBD was fused to the NA transmembrane domain, and a PTV1-2A site was introduced to allow for cotranslation of the RBD and HA. (B) Agarose gel showing segment 4 RT-PCRs from WT and TM-RBD-HA viruses. (C) Immunofluorescence microscopy images of unpermeablized MDCK cells infected without virus (top), WT virus (middle), or TM-RBD-HA virus (bottom); cells were subsequently stained with antibodies/dyes against nuclei (first column), HA (second column), or SARS-CoV-2 RBD (third column). Merged images are presented in the fourth column. Scale bar indicates 100 μm. (D) HA assays of WT and TM-RBD-HA viruses after growth in embryonated chicken eggs for 72 h. Each dot represents an individual egg; n = 4. (E) HA assays of WT and TM-RBD-HA viruses grown in embryonated chicken eggs at 24, 48, and 72 h; n = 4. (F) Plaque assays of WT and TM-RBD-HA viruses after growth in embryonated chicken eggs for 72 h from panel E. Each dot represents an individual egg; n = 4. (G) Segment 4 RT-PCRs with WT and TM-RBD-HA viruses after 10 passages on MDCK cells. P0 indicates the stock of virus used for the experiment. Statistical analyses were performed using unpaired Mann-Whitney tests. For all panels, asterisks indicate P values of <0.05. Error bars indicate the standard error of the mean (SEM).
FIG 2
FIG 2
The SARS-CoV-2 RBD is stably incorporated into IAV particles without disrupting other viral envelope proteins. (A) Western blot analysis of WT and TM-RBD HA viral particles purified after growth in embryonated chicken eggs. Samples were normalized via M1 protein signal using pixel densitometry. (B) ELISAs (left) against whole virus particles using the PY102 anti-HA antibody and area under the curve analysis (right, n = 4). (C) ELISAs (left) against whole virus particles using a SARS-CoV-2 RBD antibody (binds a nonstructural epitope) and area under the curve analysis (right, n = 4). (D) ELISAs (left) against whole virus particles using a SARS-CoV-2 neutralizing antibody (DH1041, binds a structural epitope on the RBD) and area under the curve analysis (right, n = 4). (E) Same analysis as in panel D using a different conformation-specific SARS-CoV-2 neutralizing antibody, DH1044 (n = 4). (F) Sandwich ELISA of WT/TM-RBD-HA viruses in which DH1041 antibody was used to capture virus and PY102 was subsequently used to detect virus; n = 4. Statistical analyses were performed using unpaired Mann-Whitney tests. For all panels, asterisks indicate P values of <0.05. Error bars indicate the SEM.
FIG 3
FIG 3
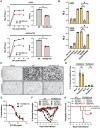
The TM-RBD-HA virus is attenuated in vitro and in vivo and does not functionally bind ACE2. (A) Growth curves (n = 3) and endpoint titers (n = 4) of WT and TM-RBD-HA viruses on A549 and A549-ACE2 cells. (B) Transduction of A549 and A549-ACE2 cells with pseudotyped lentiviral particles; relative light units (RLU) were measured as a proxy for cell entry (n = 4). (C) Infection of Sialidase A-treated A549-ACE2 cells with WT and TM-RBD-HA viruses. (D) Number of infected cells from 5 representative sections from panel C. (E) PRNTs using anti-HA PY102 with WT and TM-RBD-HA viruses (n = 4). (F) Body weights of K18-hACE2 mice infected with WT or TM-RBD-HA viruses (n = 4). (G) Survival of mice from panel F. Statistical analyses were performed using unpaired Mann-Whitney tests for panels A, B, and D and Mantel-Cox tests for panel G. For survival plots, statistical tests were applied to compare the survival rates of mice infected with the same amount of WT or TM-RBD-HA virus. For all panels, P values denoted with asterisks correspond to the following values: **, P < 0.01; *, P < 0.05; ns, not significant. Dotted lines represent PRNT50 or humane endpoints. Error bars indicate the SEM.
FIG 4
FIG 4
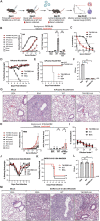
Vaccination of mice with inactivated TM-RBD-HA virus elicits neutralizing antibody responses and protective immunity against IAV but not SARS-CoV-2. (A) Experimental design for the inactivated vaccination and challenge. (B) ELISAs (left) against purified soluble HA and area under the curve analysis (right) using sera from C57BL/6J mice vaccinated with inactivated virus (n = 5). (C) Plaque reduction neutralization tests (PRNT) with sera from vaccinated C57BL/6J mice against live A/Puerto Rico/8/1934 virus (n = 5). (D) Body weights of C57BL/6J mice vaccinated with either WT virus, TM-RBD-HA virus, or BSA and challenged with a lethal dose (500 PFU) of A/Puerto Rico/8/1934 (n = 5). (E) Survival of mice from panel D. (F) Quantification of IAV PFU in lung homogenates from vaccinated/challenged C57BL/6J mice (n = 4). (G) Lung tissue histology (hematoxylin and eosin [H&E] staining) of vaccinated/challenged C57BL/6J mice (representative images, n = 3). (H) ELISAs (left) against purified soluble RBD protein and area under the curve analysis (right) using sera from K18-hACE2 mice vaccinated with inactivated virus (n = 4). (I) Sera from mice vaccinated with inactivated TM-RBD-HA virus (n = 4) were used for PRNTs against SARS-CoV-2 USA-WA/2020. (J) Body weights of K18-hACE2 mice vaccinated with either WT, TM-RBD-HA, or BSA and challenged with a lethal dose (3 × 104 PFU) of SARS-CoV-2 USA-WA/2020 (n = 8, except TM-RBD-HA, n = 7). (K) Survival of mice from panel J. (L) Quantification of CoV PFU in lung homogenates from vaccinated/challenged K18-hACE2 mice (n = 4). (M) Lung tissue histology (H&E staining) of vaccinated/challenged K18-hACE2 mice (representative images, n = 3). Statistical analyses were performed using unpaired Mann-Whitney tests except for the survival analysis, which used Mantel-Cox tests. For survival plots, statistical tests were applied to compare the WT/TM-RBD-HA groups against the BSA group. For all panels, P values denoted with asterisks correspond to the following values: *, P < 0.05; **, P < 0.01; ns, not significant. For all microscopy images, the scale bar indicates 200 μm. Error bars indicate the SEM. Dotted lines represent the limit of detection (LOD), PRNT50, or humane endpoints; for undetectable samples, data points have been assigned the LOD value.
FIG 5
FIG 5
Live-attenuated vaccination of mice with TM-RBD-HA virus elicits neutralizing antibody responses against both IAV and SARS-CoV-2. (A) Diagram illustrating vaccination and sample collection time points. (B) (Left) ELISAs against purified soluble HA protein using sera from C57BL/6J mice vaccinated with the live-attenuated regimen (n = 4). (Right) Area under the curve analysis. (C) (Left) ELISAs against purified soluble NA protein using sera from C57BL/6J mice vaccinated with the live-attenuated regimen (n = 4). (Right) Area under the curve analysis. (D) ELISAs (left) against purified soluble HA protein and area under the curve analysis (right) using sera from C57BL/6J mice vaccinated with either the live-attenuated regimen (n = 4) or the inactivated regimen (n = 5). (E) PRNTs with sera from vaccinated C57BL/6J mice against live A/Puerto Rico/8/1934 virus (n = 4). (F) Neutralization titer quantification of PRNTs from panel E. (G) ELISAs against purified soluble RBD protein using sera from K18-hACE2 mice vaccinated with the live-attenuated regimen (n = 8). (Right) Area under the curve analysis. (H) ELISAs (left) against purified soluble RBD protein and area under the curve analysis (right) using sera from K18-hACE2 mice vaccinated with the live-attenuated regimen (n = 4) or inactivated regimen (n = 8 for BSA and WT n = 7 for TM-RBD-HA). (I) PRNTs with sera from vaccinated K18-hACE2 mice against live SARS-CoV-2 USA-WA/2020 virus (n = 8). (J) Neutralization titer quantification of PRNTs from (I). Statistical analyses were performed using unpaired Mann-Whitney tests. For all panels, P values denoted with asterisks correspond to the following values: **, P < 0.01; *, P < 0.05; ns, not significant. Error bars indicate the SEM. Error bars corresponding to values less than 0 have been clipped from panel E. Dotted lines represent the limit of detection (LOD) or PRNT50; for undetectable samples, data points have been assigned the LOD value.
FIG 6
FIG 6
Live-attenuated vaccination with TM-RBD-HA virus provides protection against IAV and SARS-CoV-2 challenge in mice. (A) Experimental design displaying vaccination/challenge time points. (B) Body weights of C57BL/6J mice vaccinated with either WT virus, TM-RBD-HA virus, or BSA and challenged with a lethal dose of A/Puerto Rico/8/1934 (n = 5). (C) Survival of mice from (B). (D) Quantification of IAV PFU in lung homogenates from vaccinated/challenged mice (n = 5). (E) Lung tissue histology (H&E staining) of mice challenged with A/Puerto Rico/8/1934 (representative images, n = 3). (F) Body weights of K18-hACE2 mice vaccinated with either WT virus, TM-RBD-HA virus, or BSA and challenged with a lethal dose of SARS-CoV-2 USA-WA/2020, (n = 8, except TM-RBD-HA, n = 7). (G) Survival of mice from panel F. (H) Quantification of CoV PFU in lung homogenates from vaccinated/challenged mice (n = 4). (I) Lung tissue histology (H&E staining) of mice challenged with SARS-CoV-2 USA-WA/2020 (representative images, n = 4). For all microscopy images, the scale bars indicate 200 μm and 50 μm for the ×10 and ×40 magnified samples, respectively. Unpaired Mann-Whitney tests and Mantel-Cox tests were used for panels D/H and C/G, respectively. For survival plots, statistical tests were applied to compare WT/TM-RBD-HA groups against the BSA group. For all panels, P values denoted with asterisks correspond to the following values: ***, P < 0.001; **, P < 0.01; *, P < 0.05. Error bars indicate the SEM. Dotted lines represent the limit of detection (LOD) or humane endpoints; for undetectable samples, data points have been assigned the LOD value.

References

    1. Harding AT, Heaton NS. 2018. Efforts to improve the seasonal influenza vaccine. Vaccines 6:19. 10.3390/vaccines6020019. - DOI - PMC - PubMed
    1. Trombetta CM, Gianchecchi E, Montomoli E. 2018. Influenza vaccines: evaluation of the safety profile. Hum Vaccin Immunother 14:657–670. 10.1080/21645515.2017.1423153. - DOI - PMC - PubMed
    1. Savidan E, Chevat C, Marsh G. 2008. Economic evidence of influenza vaccination in children. Health Policy 86:142–152. 10.1016/j.healthpol.2007.09.009. - DOI - PubMed
    1. Sullivan SG, Price OH, Regan AK. 2019. Burden, effectiveness and safety of influenza vaccines in elderly, paediatric and pregnant populations. Ther Adv Vaccines Immunother 7:2515135519826481. 10.1177/2515135519826481. - DOI - PMC - PubMed
    1. Wei CJ, Crank MC, Shiver J, Graham BS, Mascola JR, Nabel GJ. 2020. Next-generation influenza vaccines: opportunities and challenges. Nat Rev Drug Discov 19:239–252. 10.1038/s41573-019-0056-x. - DOI - PMC - PubMed

MeSH terms

Supplementary concepts