. 2022 Oct 6;140(14):1621-1634.
doi: 10.1182/blood.2022015724.

Erythroblastic islands foster granulopoiesis in parallel to terminal erythropoiesis

Affiliations

Erythroblastic islands foster granulopoiesis in parallel to terminal erythropoiesis

Laurel Romano et al. Blood. .

Abstract

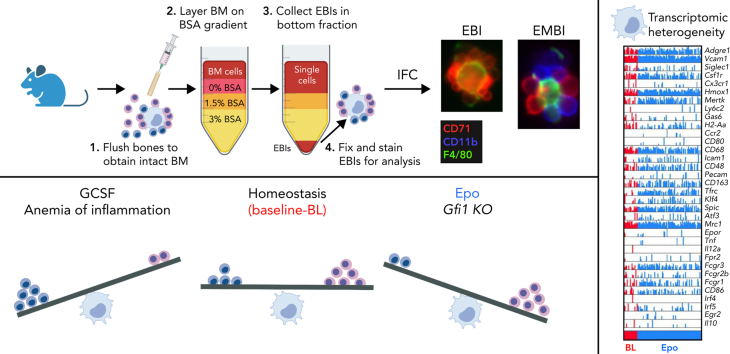
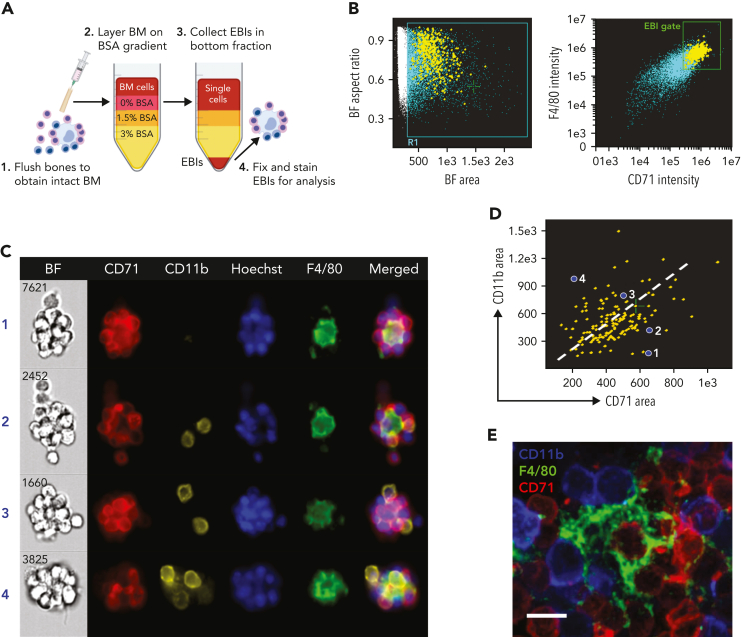
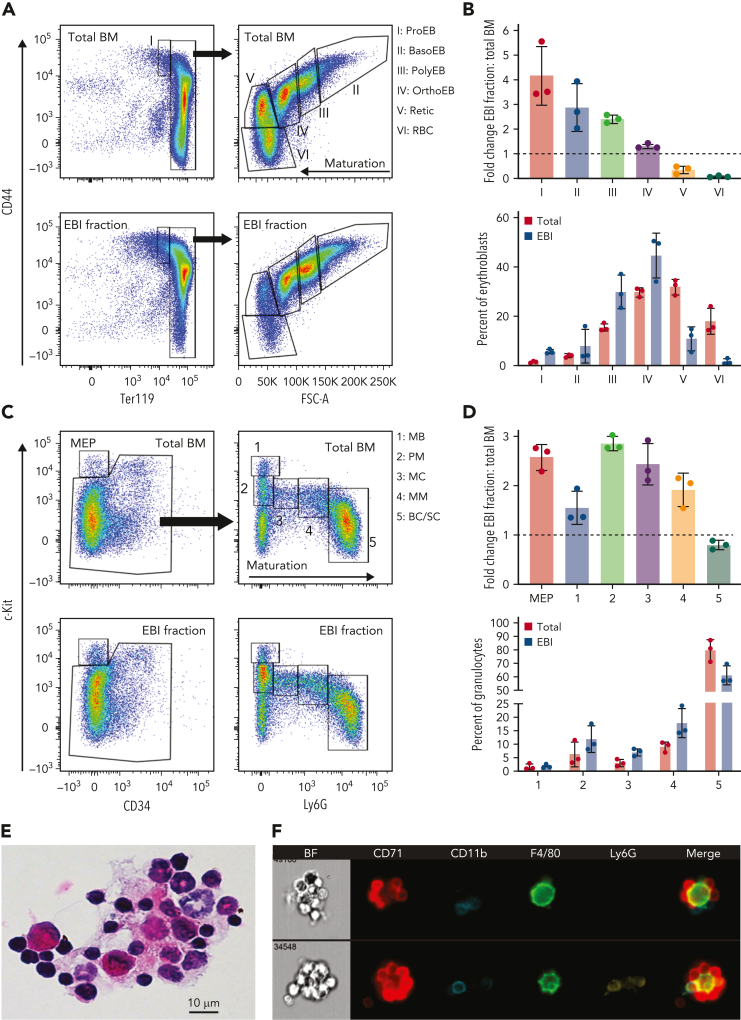
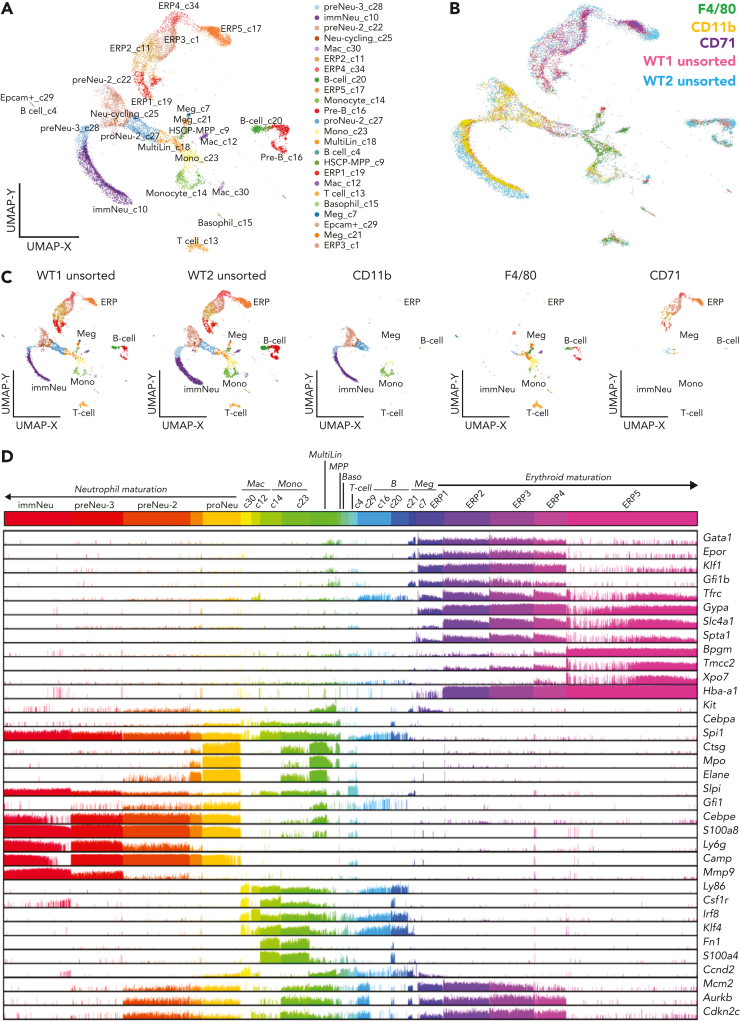
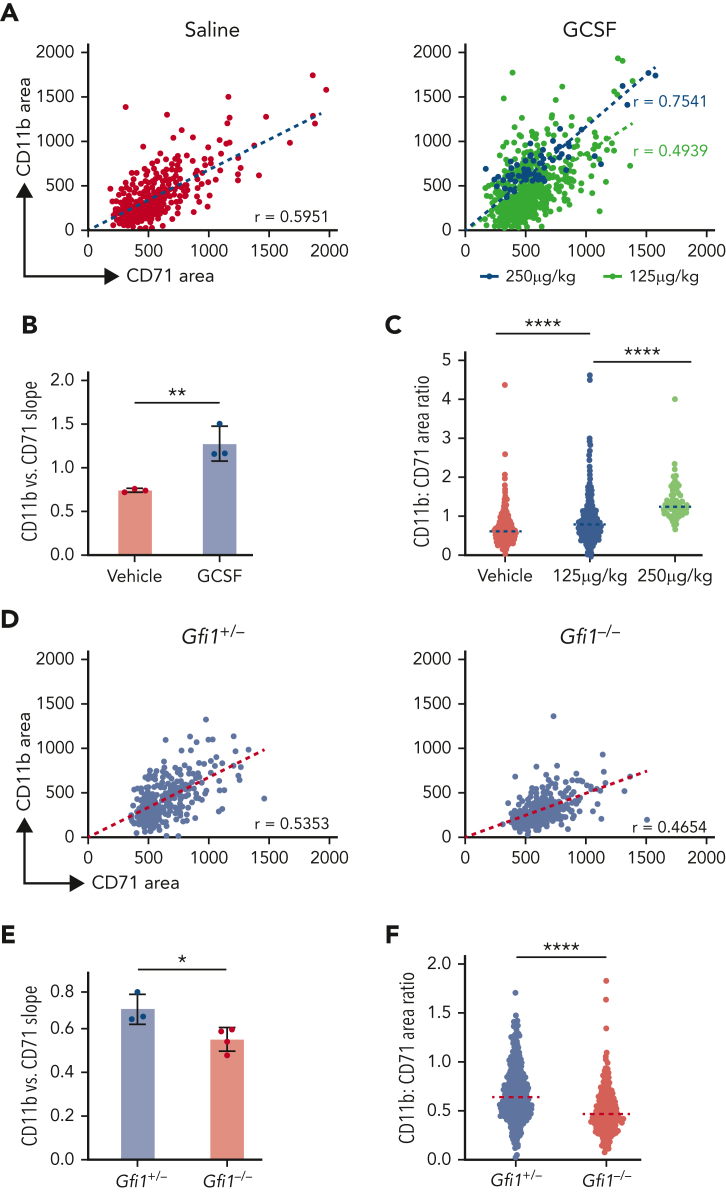
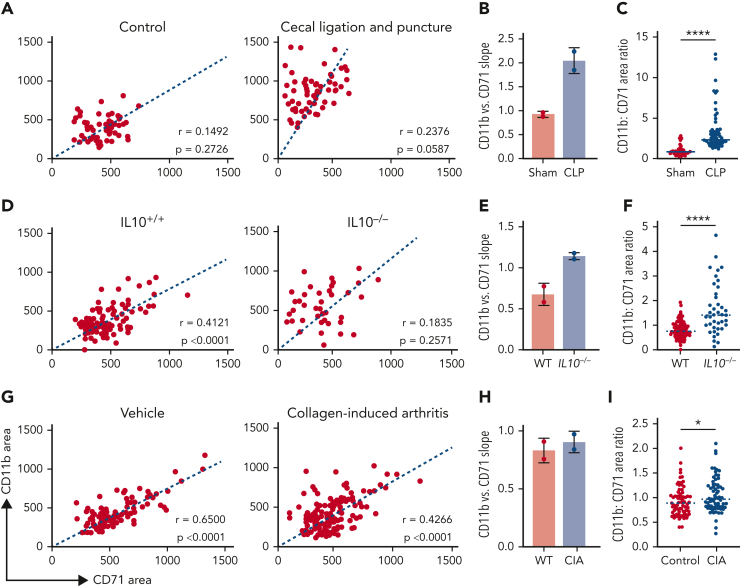
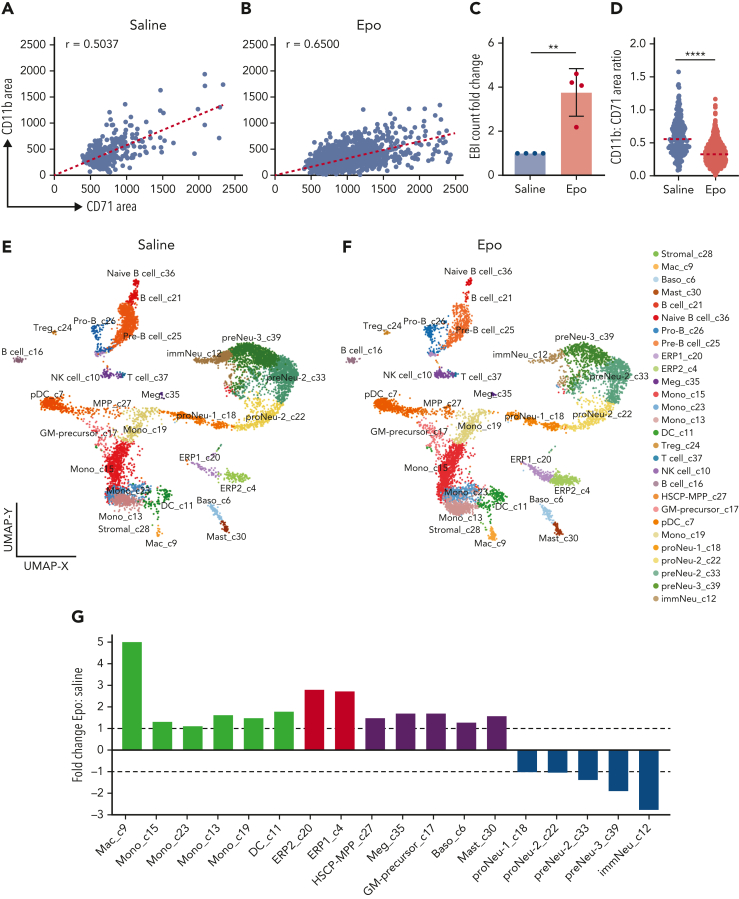
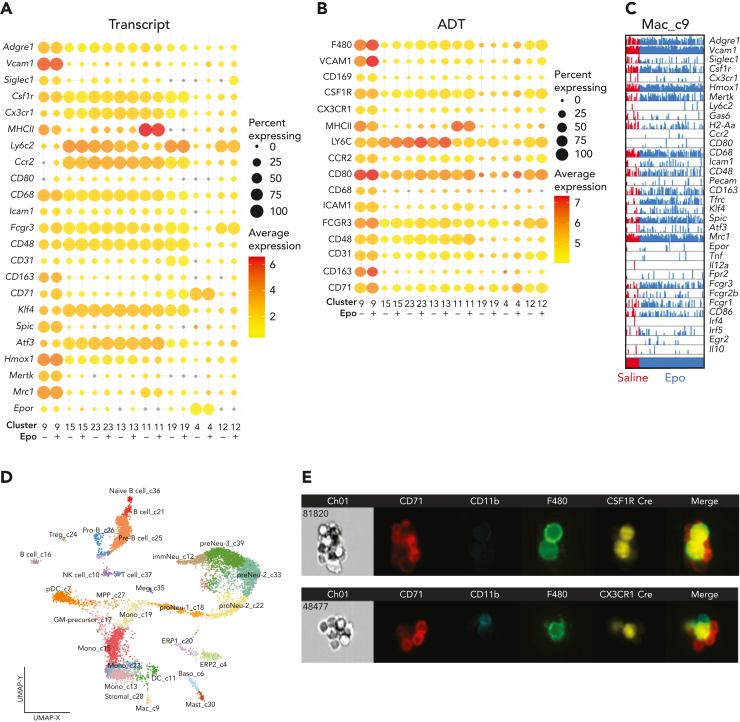
The erythroblastic island (EBI), composed of a central macrophage surrounded by maturing erythroblasts, is the erythroid precursor niche. Despite numerous studies, its precise composition is still unclear. Using multispectral imaging flow cytometry, in vitro island reconstitution, and single-cell RNA sequencing of adult mouse bone marrow (BM) EBI-component cells enriched by gradient sedimentation, we present evidence that the CD11b+ cells present in the EBIs are neutrophil precursors specifically associated with BM EBI macrophages, indicating that erythro-(myelo)-blastic islands are a site for terminal granulopoiesis and erythropoiesis. We further demonstrate that the balance between these dominant and terminal differentiation programs is dynamically regulated within this BM niche by pathophysiological states that favor granulopoiesis during anemia of inflammation and favor erythropoiesis after erythropoietin stimulation. Finally, by molecular profiling, we reveal the heterogeneity of EBI macrophages by cellular indexing of transcriptome and epitope sequencing of mouse BM EBIs at baseline and after erythropoietin stimulation in vivo and provide a searchable online viewer of these data characterizing the macrophage subsets serving as hematopoietic niches. Taken together, our findings demonstrate that EBIs serve a dual role as niches for terminal erythropoiesis and granulopoiesis and the central macrophages adapt to optimize production of red blood cells or neutrophils.


Figures

Image 1
Graphical abstract
Figure 1.
Figure 1.
CD11b+ cells participate in BM EBIs in a constant ratio with erythroblasts. (A) BM clusters, enriched in EBIs, are collected by gravity sedimentation through a BSA gradient. (B) A population of large cell clusters is gated based on their large area in the bright field, which are then gated for double positivity for F4/80 and CD71; EBIs are then selected manually out of this gate after direct visualization. Upon visual inspection and identification of a cluster as an EBI (central F4/80+ macrophages surrounded with at least 3 CD71+ erythroblasts), the event is marked in yellow and designated to the manually tagged EBI population. (C) Representative images of EBIs from ImageStream analysis demonstrating varying ratios of CD11b to CD71. (D) Flow cytogram of CD11b+ area vs CD71+ area in the EBIs for one representative experiment. Each point represents an EBI observed by IFC. Upon visual inspection and identification of a cluster as an EBI, the event is marked in yellow and designated as a tagged EBI. All EBIs observed in one biological replicate are shown. Least-square linear regression was used to produce the dotted line, with the constraint to cross the point (X0, Y0), and therefore, because the intercept is 0, the slope represents the ratio of CD11b+ area to CD71+ area within EBIs. The average slope in 5 experiments was in a fairly narrow range of 0.690 ± 0.035, indicating a constant ratio of CD11b+ cells to erythroblasts in the EBIs and implying a physiologic significance. Spearman correlation coefficient r values for all replicates ranged from 0.4 to 0.6 (P < .0001). (E) Whole-mount immunofluorescence staining of intact BM shows cells stained for CD11b (blue) and CD71 (red) intimately associated with an F4/80+ macrophage (green) in situ. Image shown is a maximum-intensity projection of a confocal Z-stack. Scale bar represents 10 μm.
Figure 2.
Figure 2.
Immature granulocytes are enriched within the EBI fraction, similarly to erythroblasts, and are present in isolated EBIs. Total unfractionated BM and the EBI fraction, after cell dissociation, were evaluated by flow cytometry for erythroblasts and granulocytic precursors. (A) Representative flow plots showing terminal erythropoiesis populations in total unfractionated BM and the EBI fraction. Populations I to VI correspond to proerythroblasts (ProEB), basophilic (BasoEB), polychromatophilic (PolyEB), and orthochromatic (OrthoEB) erythroblasts, reticulocytes (Retic), and mature red blood cells (RBC), respectively. (B) Top graph: the fold change of each population in the EBI fraction vs the whole BM was calculated in 3 biologic repeats (fold change is shown as mean ± SD). Bottom graph: the percentage of each erythroblast population out of total erythroblasts in the total BM (red bars) and the 3% BSA fraction (blue bars) demonstrates the incremental presence of maturing erythroblast populations in total BM and EBI fraction as expected. (C) Representative flow plots showing terminal granulopoiesis populations in total unfractionated BM and EBI fraction. Populations 1 to 5 contain predominantly myeloblasts (MB), promyelocytes (PM), myelocytes (MC), metamyelocytes (MM), and band and segmented cells (BC/SC), respectively. (D) The fold change of each population in the EBI fraction vs the whole BM was calculated in 3 biologic repeats (fold change is shown as mean ± SD). (E) Hematoxylin and eosin staining of cytospins of the EBI fraction showing macrophages surrounded by erythroblasts and granulocytic precursors. (F) IFC of the EBI fraction showing CD11b+Ly6Gneg immature granulocyte precursors and more mature Ly6G+ granulocyte precursors within erythromyeloblastic islands.
Figure 3.
Figure 3.
scRNA-seq analysis of EBI constituent cells reveals terminal granulopoiesis alongside terminal erythropoiesis. (A) Uniform Manifold Approximation and Projection (UMAP) plot generated by ICGS2 (Iterative Clustering and Guide-gene Selection version 2) depicting the different populations of cells composing the EBI fraction. The naming of cell populations was marker gene–driven, with an emphasis on prior well-defined hematopoietic lineage notations. (B) Visualization in the UMAP plot of the sorted F4/80+ (green), CD11b+ (yellow), and CD71+ (purple) populations, representing the main component populations within the EBIs, showing their alignment to the unsorted cells (pink, blue) of the EBI fraction from C57BL/6 WT BM. (C) Individual contribution of each capture to the UMAP plot pictured in A. Cell numbers for each sample were as follows: WT1 unsorted, n = 4963; WT2 unsorted, n = 7224; CD11b, n = 2668; F4/80 n = 1335; and CD71, n = 1264. (D) Comb plot showing the relative expression level of genes characteristic of each population (erythroblasts, granulocytic precursors, macrophages). ERP1 to ERP4 are marked by high expression of erythroid commitment and differentiation genes such as Gata1, Epor, Klf1, and Gfi1b, whereas transcripts of membrane and cytoskeletal proteins such as transferrin receptor CD71 (Tfrc), glycoprotein A (Gypa), band 3 (Slc4a1), and α-spectrin (Spta1) are most significantly expressed in ERP2 to ERP4. ERP5 was marked by genes known to be expressed in orthochromatic erythroblasts and reticulocytes such as Bpgm and Xpo7, , and was the most frequent erythroblast population in unsorted and in CD71+ population sorted from the EBIs, as expected for the most mature erythroblasts. CD11b+ sorted cells segregate into 3 transcriptionally distinct clusters that represent granulocytic precursors associated with previously defined neutrophil specification (proNeu) and commitment cell states (preNeu to immNeu). Downregulation of cell cycle–related genes Mcm2, Aurkb, and Cdkn2c, especially in ERP5 and immNeu, confirms that these populations consist of terminally differentiated erythroid and granulocytic cells.
Figure 4.
Figure 4.
Changing the balance of granulocyte and erythrocyte production within EBIs. Each point represents an EBI observed by IFC; all EBIs observed in one biological replicate are shown. (A) Administration of GCSF leads to an increase in CD11b+ cells within the EBIs along with a decrease in the number of BM EBIs that contain 2 or more erythroblasts per cluster. Plots of CD11b+ area vs CD71+ area measured by IFC for all EBIs in a representative experiment for each condition are shown. In the case of 250 μg/kg GCSF treatment which dramatically suppressed medullary erythropoiesis, clusters with 3 CD71+ cells were rare because of the overall paucity of erythroblasts in the BM, so clusters with just 2 CD71+ cells were considered as EBIs in this analysis. Spearman correlation coefficient r values are shown on the graphs (P < .0001). (B) Quantification of the slope of CD11b+ vs CD71+ area in control and GCSF-injected (n = 3, mean ± SD is shown in the bar graphs; ∗∗P < .01 based on unpaired Student t test). (C) Ratio of CD11b:CD71 area within each EBI, with the line representing the median CD11b+:CD71+ area ratio (∗∗∗∗P < .0001 by Mann-Whitney test). (D) EBIs from Gfi1−/− mice, which have an arrest in early granulopoiesis, show the reverse trend as imaged by IFC, with fewer CD11b+ cells and a predominance of CD71+ cells within the EMBIs. Of note, these mice were analyzed at 8 to 9 weeks of age because of the early mortality associated with complete deficiency of Gfi1. (E) Quantification of the slope of CD11b+ vs CD71+ area in control and Gfi1−/− mice (n = 3-4 biologic repeats per condition as shown, mean ± SD is shown in the bar graphs; ∗P = .0306 based on unpaired Student t test). (F) Ratio of CD11b+:CD71+ area within each EBI, with the line representing the median CD11b:CD71 area ratio (∗∗∗∗P < .0001 by Mann-Whitney test).
Figure 5.
Figure 5.
The balance between CD71+ erythroblasts and CD11b+ granulocytes in the EBIs is altered in AoI. EBI analysis was performed for 3 different models of AoI. Representative plots of CD11b+ area vs CD71+ area for each of the 3 models of AoI and corresponding controls are shown in order of decreasing acuity and consequently decreasing CD11b vs CD71 slope. Each point represents an EBI observed by IFC; all EBIs observed in one biological replicate are shown. Spearman correlation coefficient r values along with corresponding P values for correlation are shown on the graphs. (A) Cecal ligation and puncture (CLP) model resembles sepsis and shows the most dramatic increase in CD11b+ vs CD71+ slope. (B) Quantification of the slope of CD11b+ vs CD71+ area in control and CLP (n = 2, mean ± SD is shown in the bar graphs). (C) Ratio of CD11b+:CD71+ within each EBI (median shown in graph; ∗∗∗∗P < .0001 by Mann-Whitney test). (D) IL10−/− mice, when they develop inflammatory bowel disease, show a moderate increase in CD11b vs CD71 slope. (E) Quantification of the slope of CD11b vs CD71 area in control and IL10−/− (n = 2; mean ± SD is shown in the bar graphs). (F) Ratio of CD11b+:CD71+ within each EBI (median shown in graph; ∗∗∗∗P < .0001 by Mann-Whitney test). (G) Collagen-induced arthritis (CIA) models show mild inflammation relative to the CLP and IL10−/− with colitis models associated with a mild increase in CD11b+ vs CD71+ slope. (H) Quantification of the slope of CD11b vs CD71 area in control and CIA (n = 2, mean ± SD is shown in the bar graphs). (I) Ratio of CD11b+:CD71+ within each EBI (median shown in graph, ∗P < .05 by Mann-Whitney test). No statistical test was performed for the comparison of slopes in B, E, and H, in which 2 samples for each experimental and each control mouse model of AoI were analyzed.
Figure 6.
Figure 6.
EBIs and EBI macrophages are increased following administration of Epo, permitting characterization of EBI macrophages by CITE-seq. IFC analysis of EBIs from saline solution–treated (A) vs Epo-treated (B) mouse BM demonstrates an increase not only in the size of EBIs (increased CD71+ area) but also in the number of EBIs after Epo stimulation, indicating a parallel increase in the number of EBI macrophages. Each point represents an EBI observed by IFC; all EBIs observed in one biological replicate are shown. Spearman correlation coefficient r values are shown on the graphs (P < .0001). (C) The number of EBIs after Epo stimulation increased approximately 4-fold by IFC evaluation (n = 4 biologic repeats, mean ± SD shown in the bar graph; ∗∗P = .002 comparing raw values with unpaired Student t test). (D) Ratio of CD11b+:CD71+ area within each EBI (median shown in graph; ∗∗∗∗P < .0001 by Mann-Whitney test). (E,F) ICGS2 (Iterative Clustering and Guide-gene selection version 2) analysis and CellHarmony of single-cell CITE-seq data collected from the BM clusters enriched in EBIs of saline solution–treated (E) and Epo-treated (F) BM reveals 28 distinct clusters. Clusters 4 and 20 are composed of early erythroblasts remaining despite Ter119+ depletion; clusters 18, 22, 33, 39, and 12 are granulocyte precursors that were also not completely removed despite depletion for Ly6G; and clusters 9, 13, 15, 23, and 19 have a transcriptome compatible with macrophage/monocyte lineage. Cluster 7 demonstrates transcriptomic characteristics of plasmacytoid dendritic cells, such as Siglech, Bst2, and Ly6d, and therefore is not considered a macrophage subset. (G) Fold change in relative frequencies of the cells in the macrophage/monocyte, erythroid, and granulocytic clusters at baseline vs with Epo treatment as indicated by percentage of captured cells in each sample.
Figure 7.
Figure 7.
CITE-seq of EBI constituent cells coupled with IFC demonstrates EBI macrophage heterogeneity and plasticity. (A,B) Bubble plots of mRNA (A) and ADTs (B) comparing classically defined EBI macrophage cluster 9 with the other macrophage/monocyte clusters in the CITE-seq capture, along with erythroid cluster 4 and granulocyte cluster 12 for comparison. The size of the bubble indicates the percentage of cells from each treatment within the cluster expressing the gene or being positive for the ADT, and the color of the bubble represents the average expression level. (C) Comb plot of cells in cluster 9 demonstrates the heterogeneity within EBI macrophage populations in saline solution– and Epo-treated mice. (D) Uniform Manifold Approximation and Projection (UMAP) plot of CITE-seq as a reference for the clusters included in the bubble plot. (E) IFC demonstrates positivity of EBI macrophages for Csf1R and Cx3cr1 using the tdTomato-reporter of the corresponding cre models.

Comment in

References

    1. Palis J. Primitive and definitive erythropoiesis in mammals. Front Physiol. 2014;5:3. - PMC - PubMed
    1. Bessis M. L’ilot erythroblastique. Unite functionelle de la moelle osseuse. Erythroblastic island, functional unity of bone marrowRev Hematol (Paris) 1958;13(1):8–11. - PubMed
    1. Chasis JA, Mohandas N. Erythroblastic islands: niches for erythropoiesis. Blood. 2008;112(3):470–478. - PMC - PubMed
    1. Manwani D, Bieker JJ. The erythroblastic island. Curr Top Dev Biol. 2008;82:23–53. - PMC - PubMed
    1. Rhodes MM, Kopsombut P, Bondurant MC, Price JO, Koury MJ. Adherence to macrophages in erythroblastic islands enhances erythroblast proliferation and increases erythrocyte production by a different mechanism than erythropoietin. Blood. 2008;111(3):1700–1708. - PMC - PubMed

Publication types