. 2022 Aug 30;13(4):e0145422.
doi: 10.1128/mbio.01454-22. Epub 2022 Jul 12.

A Multitrait Locus Regulates Sarbecovirus Pathogenesis

Affiliations

A Multitrait Locus Regulates Sarbecovirus Pathogenesis

Alexandra Schäfer et al. mBio. .

Abstract

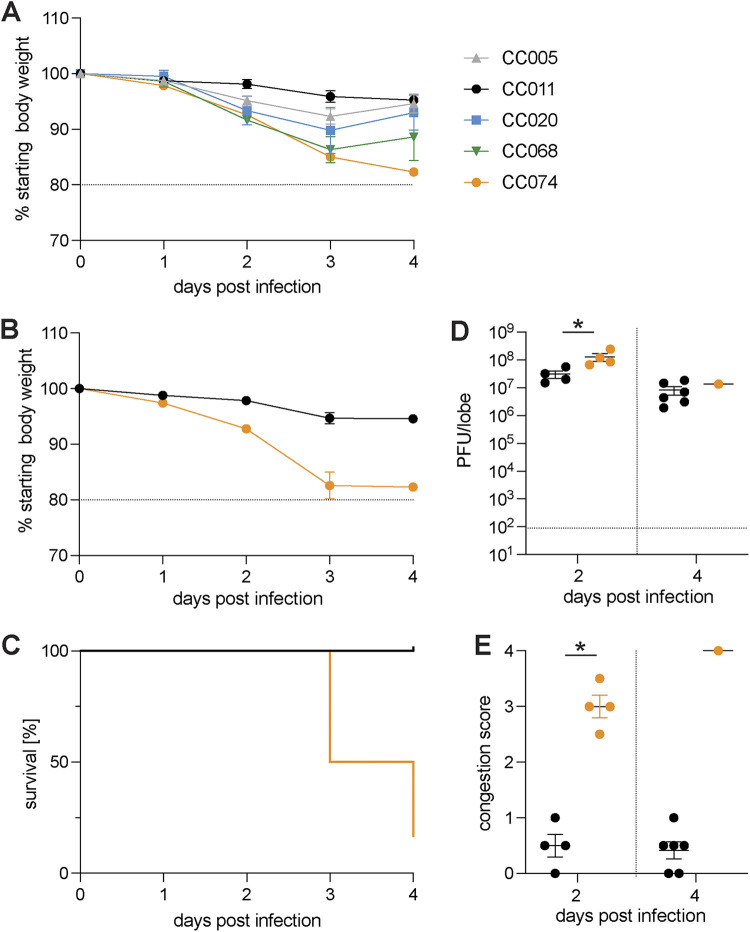
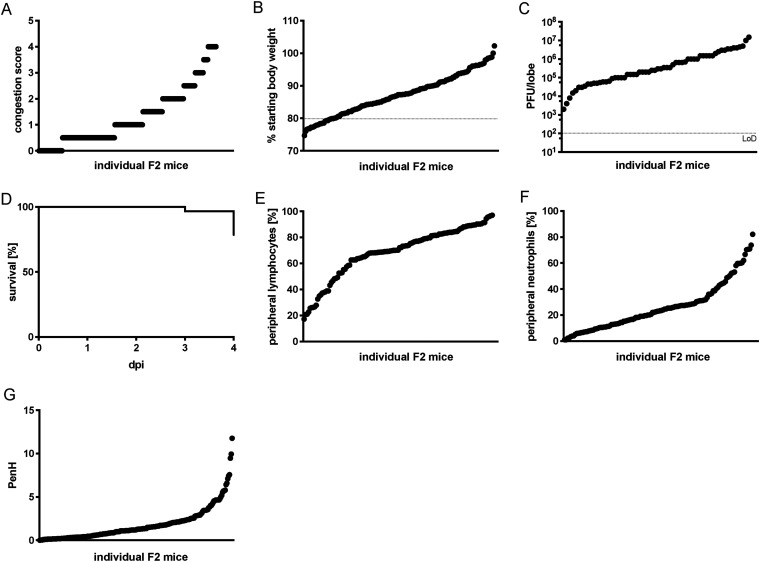
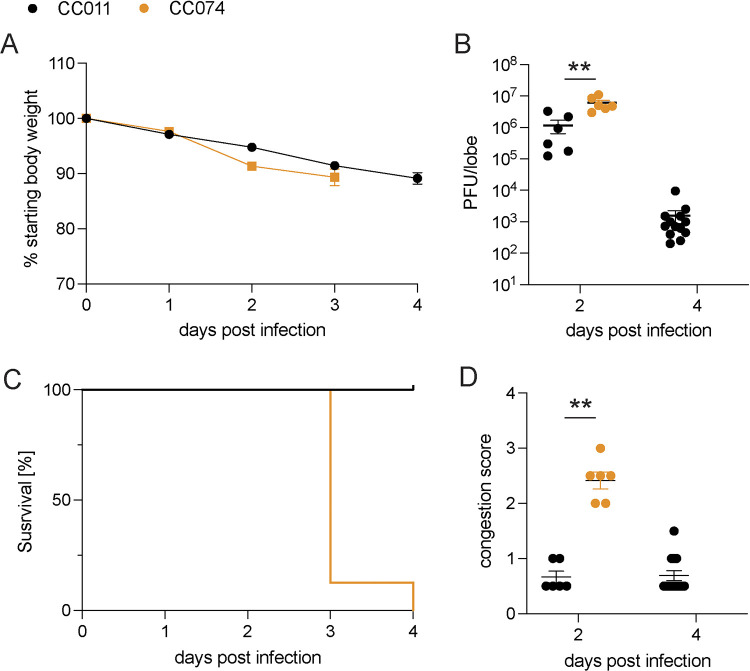
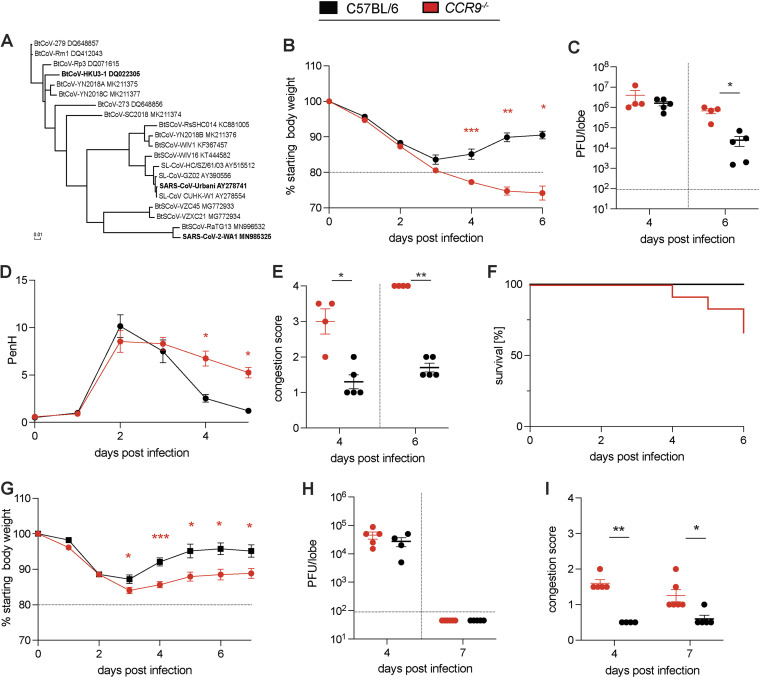
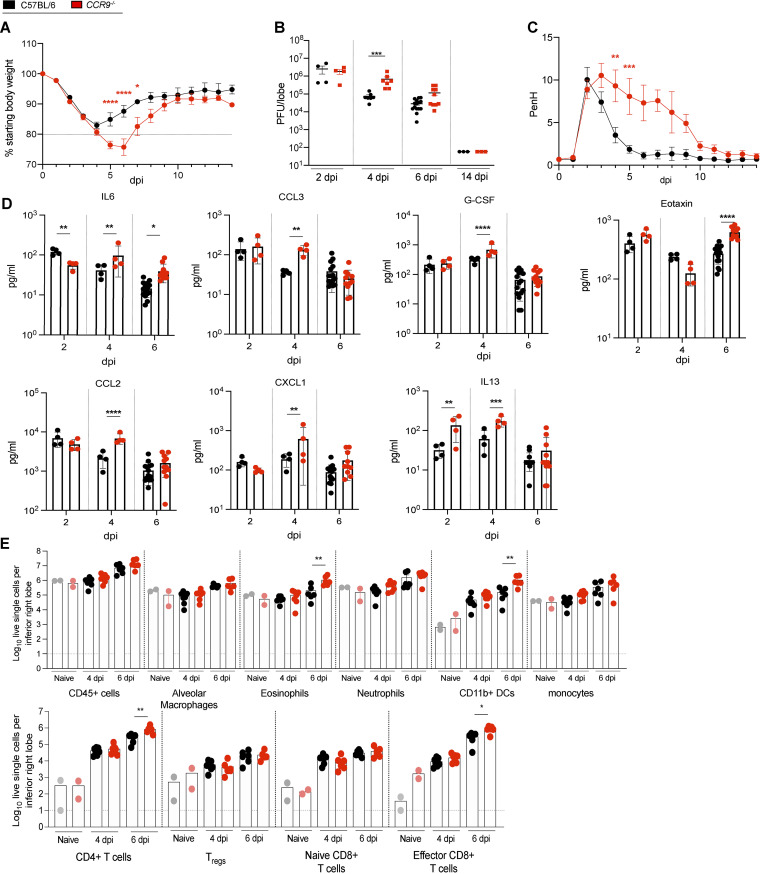
Infectious diseases have shaped the human population genetic structure, and genetic variation influences the susceptibility to many viral diseases. However, a variety of challenges have made the implementation of traditional human Genome-wide Association Studies (GWAS) approaches to study these infectious outcomes challenging. In contrast, mouse models of infectious diseases provide an experimental control and precision, which facilitates analyses and mechanistic studies of the role of genetic variation on infection. Here we use a genetic mapping cross between two distinct Collaborative Cross mouse strains with respect to severe acute respiratory syndrome coronavirus (SARS-CoV) disease outcomes. We find several loci control differential disease outcome for a variety of traits in the context of SARS-CoV infection. Importantly, we identify a locus on mouse chromosome 9 that shows conserved synteny with a human GWAS locus for SARS-CoV-2 severe disease. We follow-up and confirm a role for this locus, and identify two candidate genes, CCR9 and CXCR6, that both play a key role in regulating the severity of SARS-CoV, SARS-CoV-2, and a distantly related bat sarbecovirus disease outcomes. As such we provide a template for using experimental mouse crosses to identify and characterize multitrait loci that regulate pathogenic infectious outcomes across species. IMPORTANCE Host genetic variation is an important determinant that predicts disease outcomes following infection. In the setting of highly pathogenic coronavirus infections genetic determinants underlying host susceptibility and mortality remain unclear. To elucidate the role of host genetic variation on sarbecovirus pathogenesis and disease outcomes, we utilized the Collaborative Cross (CC) mouse genetic reference population as a model to identify susceptibility alleles to SARS-CoV and SARS-CoV-2 infections. Our findings reveal that a multitrait loci found in chromosome 9 is an important regulator of sarbecovirus pathogenesis in mice. Within this locus, we identified and validated CCR9 and CXCR6 as important regulators of host disease outcomes. Specifically, both CCR9 and CXCR6 are protective against severe SARS-CoV, SARS-CoV-2, and SARS-related HKU3 virus disease in mice. This chromosome 9 multitrait locus may be important to help identify genes that regulate coronavirus disease outcomes in humans.

Keywords: SARS-CoV-2; collaborative cross; host response; pathogenesis; sarbecoviruses.


Conflict of interest statement

The authors declare no conflict of interest.

Figures

FIG 1
FIG 1
CC strains demonstrate different susceptibility to SARS-CoV infection and disease. Age-matched female mice (n = 4) of 5 different CC strains (CC005, CC011, CC020, CC068, and CC074) were infected with 1 × 104 PFU and monitored for weight loss until 4 dpi. An additional group of age-matched CC011 and CC074 (both sexes) were infected with 1 × 104 PFU, and mice were monitored for disease progression until 4 dpi. (A) Weight loss for CC strains CC005, CC011, CC020, CC068, and CC074. (B) Weight loss of the two parental CC strains CC011 and CC074. (C) Percentage survival of the two parental CC strains CC011 and CC074. (D) Lung viral titer of the two parental CC strains CC011 and CC074 on 2 and 4 dpi. (E) Lung congestion score of the two parental CC strains CC011 and CC074 (female 10- to 12-week-old mice were infected with 1 × 104 PFU SARS-CoV MA15; CC011: n = 4 for 2 dpi and n = 6 for 4 dpi; CC074: n = 4 for 2 dpi and n = 6 for 4 dpi, respectively). Data were analyzed using Mann-Whitney test (lung titer and congestion scores); *, P < 0.05.
FIG 2
FIG 2
Disease phenotypes after SARS-CoV MA15 infection in the CC011xCC074-F2 mice. The 10-to 12-week-old CC011xCC074-F2 mice (n = 403; 226 males, 177 females) were generated and infected with 1 × 104 PFU of SARS-CoV MA15 and followed for 4 days to record clinical disease outcomes. (A) Congestion score of CC011xCC074-F2 mice at 4 dpi. (B) Weight loss of CC011xCC074-F2 mice. (C) Lung viral titer of CC011xCC074-F2 mice at 4 dpi. (D) Percentage survival of CC011xCC074-F2 mice over the time of infection. (E) Percentage of peripheral blood lymphocytes of CC011xCC074-F2 mice at 4 dpi. (F) Percentage of peripheral blood neutrophils of CC011xCC074-F2 mice at 4 dpi. (G) PenH (airway resistance) of CC011xCC074-F2 mice at 2 dpi.
FIG 3
FIG 3
CC011 and CC074 disease outcomes after mouse-adapted SARS-CoV-2 infection. Groups of parental CC011 and CC074 mice were infected with 1 × 104 PFU of SARS-CoV-2 MA10 and followed for several days for clinical disease outcomes. (A) Weight loss of the two parental CC strains CC011 and CC074. (B) Lung viral titer of the two parental CC strains CC011 and CC074 on 2 and 4 dpi. (C) Percentage survival of the two parental CC strains CC011 and CC074. (D) Lung congestion score of the two parental CC strains CC011 and CC074 (female 10- to 12-week-old mice were infected with 1 × 104 PFU SARS-CoV-2 MA10; CC011: n = 6 for 2 dpi and n = 13 for 4 dpi; CC074: n = 6 for 2 dpi and n = 15 for 4 dpi, respectively). Data were analyzed using 2-way ANOVA with multiple comparison (weight and PenH), log-rank (survival), and Mann-Whitney test (lung titer and congestion scores); **, P < 0.005.
FIG 4
FIG 4
Identification of a Multitrait QTL on Chr9. Each of the individual F2 mice were genotyped using MiniMuga and QTL mapping conducted by testing the strength of association between each F2 mouse’s phenotype and their genotypes at each marker. (A) A quantitative multitrait locus with major effect was identified on Chr9 (74.9–124 Mb), which affected mortality, weight loss, lung congestion, lung function, and peripheral hematology. CC011/Unc has a C57BL/6/PWK haplotype and CC074/Unc has an A/J/PWK haplotype in this QTL region. (B) Expression levels of Ccr9, Cxcr6, Xcr1, Lztfl1, Fyco1, and Slc6a20a/b of SARS-CoV-2 MA10-infected CC011 and CC074 mice at 4 dpi, determined by quantitative RT-PCR, normalized to Gapdh (female 10- to 12-week-old mice were infected with 1 × 104 PFU SARS-CoV-2 MA10; CC011: n = 5, CC074: n = 5). Data were analyzed using Mann-Whitney test; *, P < 0.05; **, P < 0.005.
FIG 5
FIG 5
Validation of Ccr9 as susceptibility gene during SARS-CoV MA15 and HKU3-SRBD MA infection. To validate CCR9 as a susceptibility gene during SARS-CoV infection, groups of age-matched CCR9−/− mice were infected with 1 × 105 PFU SARS-CoV MA15 and HKU3-SRBD MA and followed for several days for disease outcomes. The Spike protein sequences of selected Sarbecoviruses were aligned and phylogenetically compared. Sequences were aligned using free end gaps with the Blosum62 cost matrix, and the tree was constructed using the neighbor-joining method with a Jukes-Cantor genetic distance model based on the multiple sequence alignment in Geneious Prime. The GenBank accession numbers for each genome sequence are shown. The tree was then output and visualized using EvolView. (A) Phylogenetic tree of sarbecoviruses. The Spike protein sequences of selected sarbecoviruses were aligned and phylogenetically compared. Sequences were aligned using free end gaps with the Blosum62 cost matrix, and the tree was constructed using the neighbor-joining method with a Jukes-Cantor genetic distance model based on the multiple sequence alignment in Geneious Prime. The GenBank accession numbers for each genome sequence are shown. The tree was then output and visualized using EvolView (bold indicates viruses tested). (B) Weight loss of CCR9−/− mice and C57BL/6NJ control mice. (C) Lung viral titer of CCR9−/− mice and C57BL/6NJ control mice on 4 and 6 dpi. (D) PenH of CCR9−/− mice and C57BL/6NJ control mice. (E) Congestion of CCR9−/− mice and C57BL/6NJ control mice on 4 and 6 dpi. (F) Percentage survival of CCR9−/− mice and C57BL/6NJ control mice. (G) Weight loss of CCR9−/− mice and C57BL/6NJ control mice. (H) Lung viral titer of CCR9−/− mice and C57BL/6NJ control mice on 4 and 7 dpi. I. Lung congestion of CCR9−/− mice and C57BL/6NJ control mice on 4 and 7 dpi (15-18-week-old mice were infected with 1 × 105 PFU SARS-CoV MA15; C57BL/6NJ: n = 5 for 4 dpi and n = 5 for d6pi; CCR9−/−: n = 4 for 4 dpi and n = 4 for 6 dpi, respectively; C57BL/6NJ: n = 10 and CCR9−/−: n = 12 for survival study). Data were analyzed using Mann-Whitney test; *, P < 0.05; **, P < 0.005 (15- to 18-week-old mice were infected with 1 × 105 PFU HKU3-SRBD MA; C57BL/6NJ: n = 4 for 4 dpi and n = 5 for 6 dpi; CCR9−/−: n = 5 for 4 dpi and n = 6 for 6 dpi, respectively). Data were analyzed using 2-way ANOVA with multiple comparison (weight and PenH), log-rank (survival), and Mann-Whitney test (viral titer, congestion score); *, P < 0.05; **, P < 0.005; ***, P < 0.0005.
FIG 6
FIG 6
Ccr9 Regulates sarbecovirus infection and pathogenesis in vivo. To study the effect of Ccr9 on the susceptibility to SARS-COV-2 infection, groups of age-matched CCR9−/− mice were infected with 1 × 105 PFU SARS-CoV-2 MA10 and followed for several days for disease outcomes. (A) Weight loss of CCR9−/− mice and C57BL/6NJ control mice. (B) Lung viral titer of CCR9−/− mice and C57BL/6NJ control mice on 2, 4, 6, and 14 dpi. (C) PenH of CCR9−/− mice and C57BL/6NJ control mice. (D) cytokine/chemokine distribution in the lung of CCR9−/− mice and C57BL/6NJ control mice on 2, 4, and 6 dpi. (E) Composition of lung infiltrating immune cells in the lung of CCR9−/− mice and C57BL/6NJ control mice on 4 and 6 dpi (15- to 18-week-old mice were infected with 1 × 105 PFU SARS-CoV-2 MA10; C57BL/6NJ: n = 29, n = 4 for 2 dpi, n = 7 for 4 dpi, n = 15 for 6 dpi, and n = 3 for 14 dpi; CCR9−/−: n = 24 total, n = 4 for 2 dpi, n = 7 for 4 dpi, n = 10 for 6 dpi, and n = 3 for 14 dpi, respectively, for weight loss and viral titer, C57BL/6NJ: n = 4 and CCR9−/−: n = 4 lung function analysis, 57BL/6NJ: n = 4 for 2 dpi, n = 4 for 4 dpi, n = 15 for 6 dpi; CCR9−/−: n = 4 for 2 dpi, n = 4 for 4 dpi; n = 11 for 6 dpi for chemokine/cytokine analysis; n = 12 CCR9−/− and n = 13 C57BL/6NJ with n = 2 each for mock, n = 6-7 for 4 dpi, and n = 5-6 for 6 dpi for analysis of infiltrating cells). Data were analyzed using 2-way ANOVA with multiple comparison (weight and PenH) and Mann-Whitney test (viral titer, congestion score, cytokine/chemokine, and infiltrating cells); *, P < 0.05; **, P < 0.005; ***, P < ; 0.0005; ****, P < 0.0001.
FIG 7
FIG 7
Cxcr6 regulates SARS-CoV-2 MA10 pathogenesis in mice. To study the effect of Cxcr6 on the susceptibility to SARS-COV-2 infection, groups of age-matched CXCR6−/− mice were infected with 1 × 105 PFU SARS-CoV-2 MA10 and followed for several days for disease outcomes. (A) Weight loss of CXCR6−/− mice and C57BL/6J control mice. (B) PenH of CXCR6−/− mice and C57BL/6J control mice. (C) Lung viral titer of CXCR6−/− mice and C57BL/6J control mice on 2, 4, and 7 dpi. (D) Congestion score of CXCR6−/− mice and C57BL/6J control mice on 2, 4, and 7 dpi. (E) Cytokine/chemokine distribution in the lung of CXCR6−/− mice and C57BL/6J control mice on 2, 4, and 7 dpi. (F) Composition of lung infiltrating immune cells in the lung of CXCR6−/− mice and C57BL/6J control mice on 4 dpi (15-18-week-old mice were infected with 1 × 105 PFU SARS-CoV-2 MA10; C57BL/6NJ: n = 15, n = 5 for 2 dpi, n = 5 for 4 dpi, n = 5 for 7 dpi; CXCR6−/−: n = 12 total, n = 4 for 2 dpi, n = 5 for 4 dpi, n = 3 for 7 dpi for weight loss, viral titer, congestion score, and chemokine/cytokine analysis; C57BL/6NJ: n = 4 and CXCR6−/−: n = 4 for lung function analysis, n = 8–9 CXCR6−/− and n = 10 C57BL/6NJ with n = 2 each for mock, n = 6–8 for 4 dpi for analysis of infiltrating cells). Data were analyzed using 2-way ANOVA with multiple comparison (weight and PenH) and Mann-Whitney test (viral titer, congestion score, cytokine/chemokine, and infiltrating cells); *, P < 0.05; **, P < 0.005; ***, P < 0.0005; ****, P < 0.00001.

Update of

  • A Multitrait Locus Regulates Sarbecovirus Pathogenesis.
    Schäfer A, Leist SR, Gralinski LE, Martinez DR, Winkler ES, Okuda K, Hawkins PE, Gully KL, Graham RL, Scobey DT, Bell TA, Hock P, Shaw GD, Loome JF, Madden EA, Anderson E, Baxter VK, Taft-Benz SA, Zweigart MR, May SR, Dong S, Clark M, Miller DR, Lynch RM, Heise MT, Tisch R, Boucher RC, Pardo Manuel de Villena F, Montgomery SA, Diamond MS, Ferris MT, Baric RS. Schäfer A, et al. bioRxiv [Preprint]. 2022 Jun 2:2022.06.01.494461. doi: 10.1101/2022.06.01.494461. bioRxiv. 2022. Update in: mBio. 2022 Aug 30;13(4):e0145422. doi: 10.1128/mbio.01454-22. PMID: 35677067 Free PMC article. Updated. Preprint.

References

    1. Ge D, Fellay J, Thompson AJ, Simon JS, Shianna KV, Urban TJ, Heinzen EL, Qiu P, Bertelsen AH, Muir AJ, Sulkowski M, McHutchison JG, Goldstein DB. 2009. Genetic variation in IL28B predicts hepatitis C treatment-induced viral clearance. Nature 461:399–401. doi:10.1038/nature08309. - DOI - PubMed
    1. McLaren PJ, Coulonges C, Bartha I, Lenz TL, Deutsch AJ, Bashirova A, Buchbinder S, Carrington MN, Cossarizza A, Dalmau J, De Luca A, Goedert JJ, Gurdasani D, Haas DW, Herbeck JT, Johnson EO, Kirk GD, Lambotte O, Luo M, Mallal S, van Manen D, Martinez-Picado J, Meyer L, Miro JM, Mullins JI, Obel N, Poli G, Sandhu MS, Schuitemaker H, Shea PR, Theodorou I, Walker BD, Weintrob AC, Winkler CA, Wolinsky SM, Raychaudhuri S, Goldstein DB, Telenti A, de Bakker PIW, Zagury J-F, Fellay J. 2015. Polymorphisms of large effect explain the majority of the host genetic contribution to variation of HIV-1 virus load. Proc Natl Acad Sci USA 112:14658–14663. doi:10.1073/pnas.1514867112. - DOI - PMC - PubMed
    1. Chen B, Tian E-K, He B, Tian L, Han R, Wang S, Xiang Q, Zhang S, El Arnaout T, Cheng W. 2020. Overview of lethal human coronaviruses. Signal Transduct Target Ther 5:89. doi:10.1038/s41392-020-0190-2. - DOI - PMC - PubMed
    1. Wang Q, Vlasova AN, Kenney SP, Saif LJ. 2019. Emerging and re-emerging coronaviruses in pigs. Curr Opin Virol 34:39–49. doi:10.1016/j.coviro.2018.12.001. - DOI - PMC - PubMed
    1. Zhang YZ, Holmes EC. 2020. A genomic perspective on the origin and emergence of SARS-CoV-2. Cell 181:223–227. doi:10.1016/j.cell.2020.03.035. - DOI - PMC - PubMed

Publication types