. 2022 Aug 31;7(4):e0023522.
doi: 10.1128/msphere.00235-22. Epub 2022 Jul 7.

Tight Complex Formation of the Fumarate Sensing DcuS-DcuR Two-Component System at the Membrane and Target Promoter Search by Free DcuR Diffusion

Affiliations

Tight Complex Formation of the Fumarate Sensing DcuS-DcuR Two-Component System at the Membrane and Target Promoter Search by Free DcuR Diffusion

Stefaniya Gencheva et al. mSphere. .

Abstract

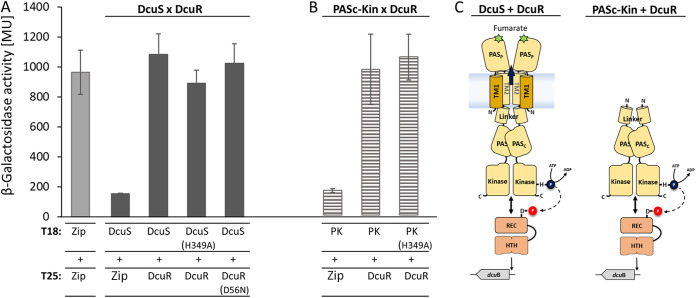
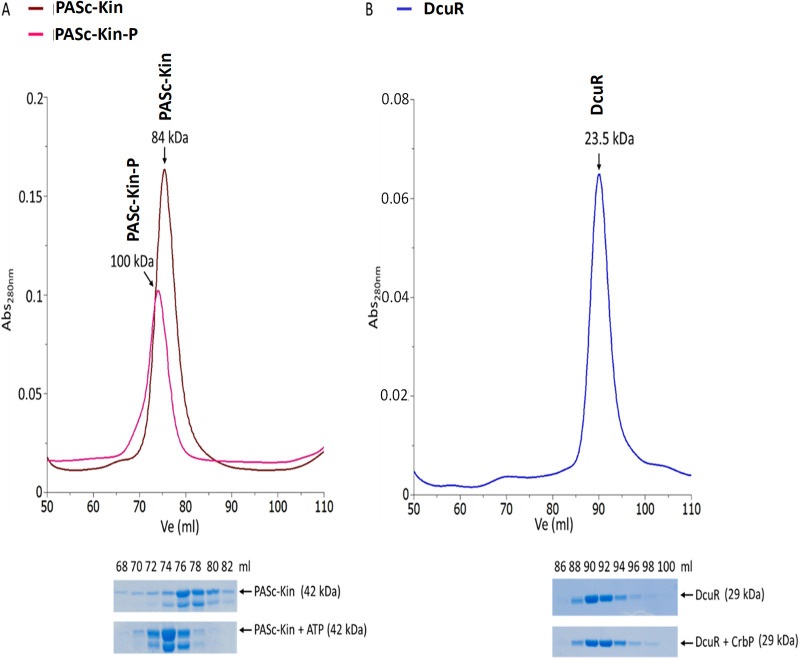
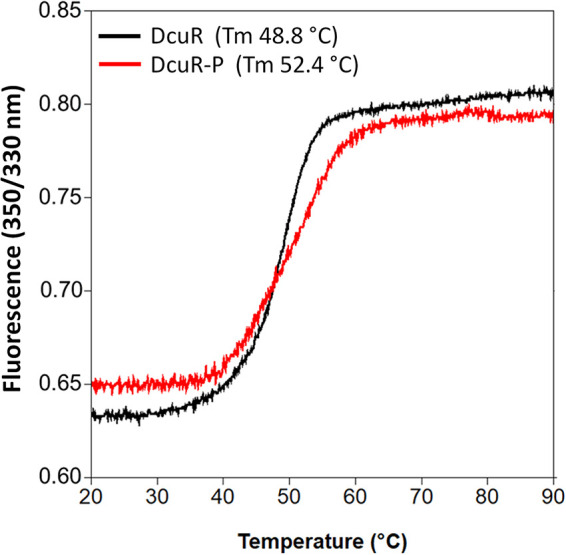
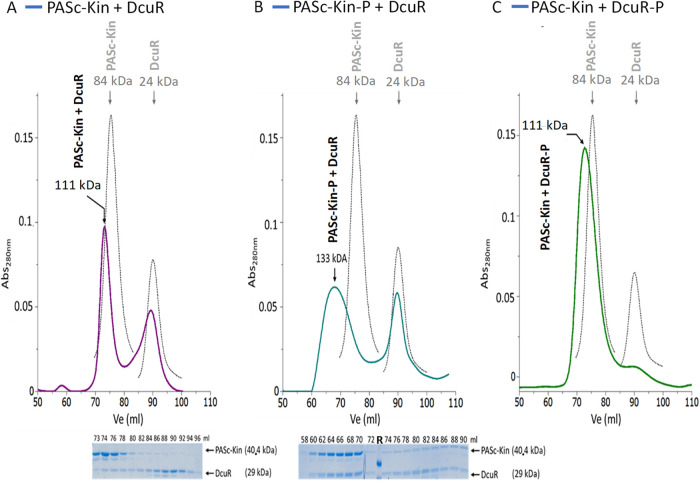
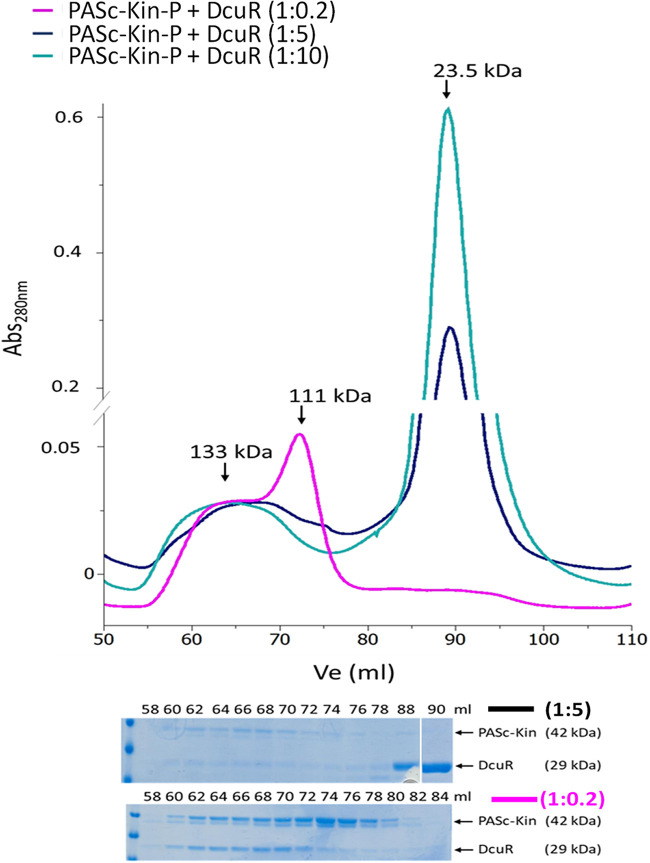
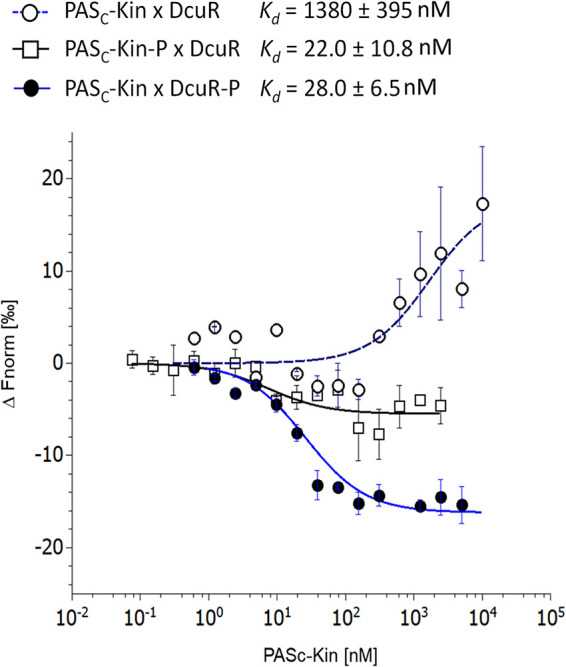
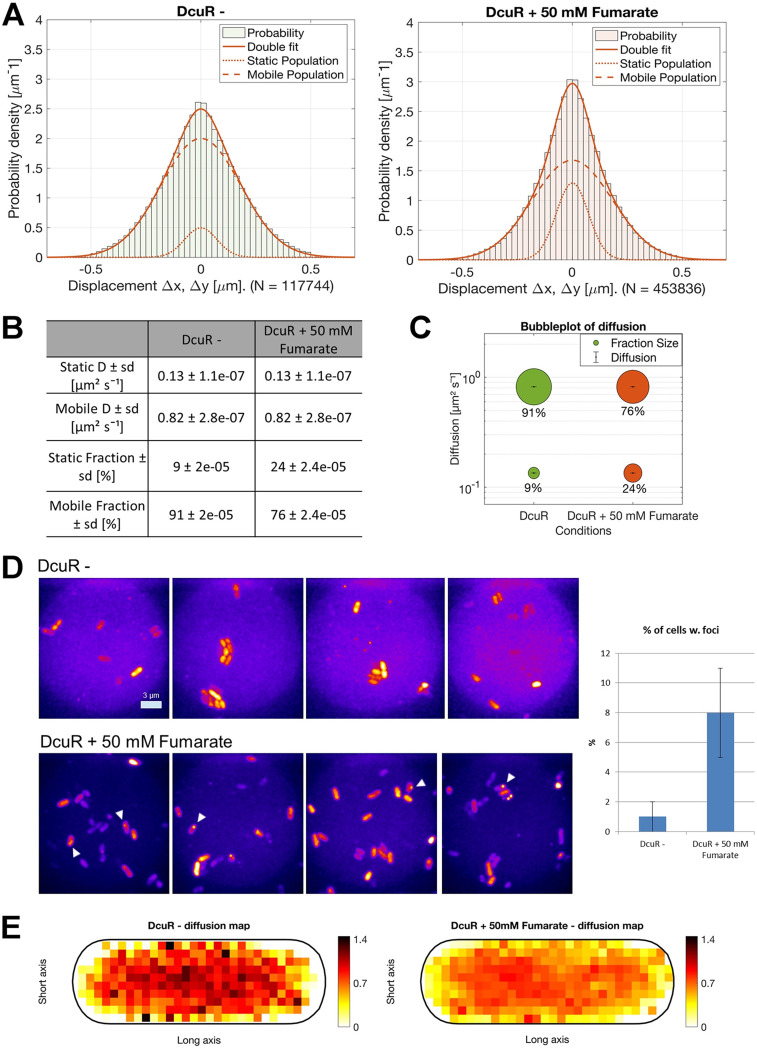
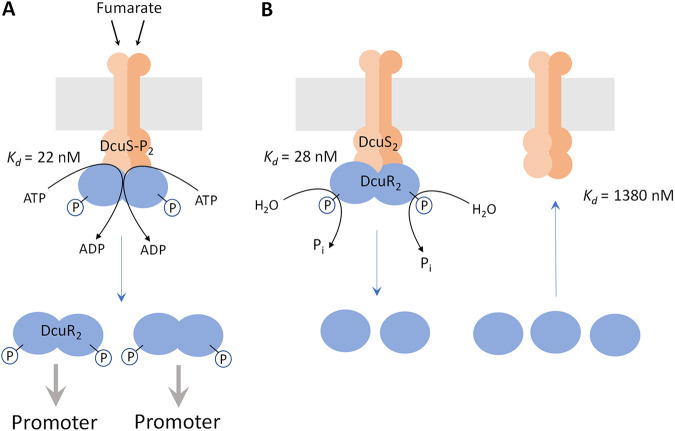
Signaling of two-component systems by phosphoryl transfer requires interaction of the sensor kinase with the response regulator. Interaction of the C4-dicarboxylate-responsive and membrane-integral sensor kinase DcuS with the response regulator DcuR was studied. In vitro, the cytoplasmic part of DcuS (PASC-Kin) was employed. Stable complexes were formed, when either DcuS or DcuR were phosphorylated (Kd 22 ± 11 and 28 ± 7 nM, respectively). The unphosphorylated proteins produced a more labile complex (Kd 1380 ± 395 nM). Bacterial two-hybrid studies confirm interaction of DcuR with DcuS (and PASC-Kin) in vivo. The absolute contents of DcuR (197-979 pmol mg-1 protein) in the bacteria exceeded those of DcuS by more than 1 order of magnitude. According to the Kd values, DcuS exists in complex, with phosphorylated but also unphosphorylated DcuR. In live cell imaging, the predominantly freely diffusing DcuR becomes markedly less mobile after phosphorylation and activation of DcuS by fumarate. Portions of the low mobility fraction accumulated at the cell poles, the preferred location of DcuS, and other portions within the cell, representing phosphorylated DcuR bound to promoters. In the model, acitvation of DcuS increases the affinity toward DcuR, leading to DcuS-P × DcuR formation and phosphorylation of DcuR. The complex is stable enough for phosphate-transfer, but labile enough to allow exchange between DcuR from the cytosol and DcuR-P of the complex. Released DcuR-P diffuses to target promoters and binds. Uncomplexed DcuR-P in the cytosol binds to nonactivated DcuS and becomes dephosphorylated. The lower affinity between DcuR and DcuS avoids blocking of DcuS and allows rapid exchange of DcuR. IMPORTANCE Complex formation of membrane-bound sensor kinases with the response regulators represents an inherent step of signaling from the membrane to the promoters on the DNA. In the C4-dicarboxylate-sensing DcuS-DcuR two-component system, complex formation is strengthened by activation (phosphorylation) in vitro and in vivo, with trapping of the response regulator DcuR at the membrane. Single-molecule tracking of DcuR in the bacterial cell demonstrates two populations of DcuR with decreased mobility in the bacteria after activation: one at the membrane, but a second in the cytosol, likely representing DNA-bound DcuR. The data suggest a model with binding of DcuR to DcuS-P for phosphorylation, and of DcuR-P to DcuS for dephosphorylation, allowing rapid adaptation of the DcuR phosphorylation state. DcuR-P is released and transferred to DNA by 3D diffusion.

Keywords: DcuS-DcuR; bacteria; complex formation; sensor complex; sensor kinase; two-component system.


Conflict of interest statement

The authors declare no conflict of interest.

Figures

FIG 1
FIG 1
Interaction of DcuR with DcuS (A) or PASC-Kin (B) in vivo, and schematic presentation of domains of DcuS and PASC-Kin (C). Interaction was tested using the bacterial BACTH two-hybrid system. E. coli BTH101(ΔcyaA) was co-transformed with two plasmids that encoded proteins fused with the T25 and T18 domains of Bordetella pertussis adenylate cyclase. T25 was fused N-terminally to DcuR (T25-DcuR) and T18 C-terminally to DcuS (DcuS-T18) (Part A), or PASc-Kin (PASc-Kin-T18, or PK) (Part B). The corresponding plasmids are listed in Table 2. β-Galactosidase activities are presented in Miller units (MU). The leucine zipper pair, T18-Zip and T25-Zip, served as a positive control (28, 29), the T25-Zip/DcuS-T18, T25-Zip/PASc-Kin-T18 and T18-Zip/T25-DcuR pair served as the negative control (background β-galactosidase activity). All activities were tested in triplicates of three biological repeats. Mean values ± SD are given. Abbreviations of the domains in (C): PASP, periplasmic PAS (Per-ARNT-SIM); PASC, cytoplasmic PAS; TM1, TM2, transmembrane helix 1 (or 2); REC, receiver domain; HTH, helix-turn-helix DNA binding domain;SD, (standard deviation). Figure C modified from (30).
FIG 2
FIG 2
Size exclusion chromatography (SEC) of PASC-Kin (A) and DcuR (B) in the phosphoryl-free and the phosphorylated states. 6His-PASc-Kinase (45 μM) and DcuR-6His (55 μM) were loaded on a HiLoad 16/600 Sephadex 200 column. For phosphorylation, the PASC-Kin was incubated with ATP (1 mM) 30 min prior to SEC. DcuR was phosphorylated by incubation with 50 mM carbamoyl phosphate for 60 min. The relative molar masses (Mr) of proteins (peak positions) of the SEC experiments were determined by calibration with protein standards. SDS-PAGE: Samples (20 μL each) from the eluted fractions were applied to SDS-PAGE and stained with Coomassie brilliant blue. Positions of PASC-Kin and DcuR are indicated. Each of the experiments was performed at least in triplicate, the calibration curve for determining the Mr of the proteins by SEC is shown in Fig. S3 in the supplemental material.
FIG 3
FIG 3
Thermal denaturation profile of DcuR in the phosphate-free (black) and phosphorylated (red) state. For thermal denaturation 10 μL samples from the corresponding SEC peaks (Fig. 2) were heated in Prometheus NT.48. The ratio of the intrinsic fluorescence recorded at 330 nm and 350 nm was used to construct the denaturation curve. The Tm values were determined from the first derivative of the curves employing the software supplied by the manufacturer. The graphs show the mean of two sets of experiments each. Thermal denaturation experiments were performed also for a set of DcuR samples which were stored at −80°C after purification and before thermal denaturation (Fig. S5 in the supplemental material). The denaturation temperature of the samples previously stored at −80°C was generally lower than that of the samples used immediately after purification (Fig. S5). However, the difference in denaturation temperature between nonphosphorylated and phosphorylated DcuR was very similar (>3°C for both sets). For comparison, the thermal denaturation profile of PASC-Kin in the free (black) and phosphorylated (red) state is shown in Fig. S6.
FIG 4
FIG 4
SEC of mixtures of PASC-Kin and DcuR (phosphate-free or phosphorylated) in various combinations: (A) PASC-Kin × DcuR, (B) PASC-Kin-P × DcuR, and (C) PASC-Kin × DcuR-P. PASC-Kin and DcuR were mixed in a molar ratio of 1:1.44 (A), 1:2 (B) and 1:1.4 (C) with PASC-Kin at a concentration of 40.4 μM. Phosphorylation of PASC-Kin and DcuR, respectively, was performed as described in Fig. 2 before mixing the samples. SDS-PAGE (parts A and B) and SEC were performed as for Fig. 2. The protein elution profiles were recorded, and the contents of PASC-Kin and DcuR in the peak fractions of part (A) and (B) were analyzed by SDS-PAGE (lower part of the figure). The elution profiles (black lines) are compared to the elution profiles of the proteins chromatographed individually (light gray lines) as in the experiment of Fig. 2. The SDS-PAGEs were used for quantification of the bands by integration of the area and intensity of the stain in the SDS-PAGE by ImageJ. The relative molar contents of the proteins and their molar ratio (see main text) were calculated from the protein staining intensity and the molar masses (18). Experiments were performed at least in triplicate, and the molar contents and ratios are the means from three independent experiments (±SD). The lane labeled ‘R’ in the SDS-PAGE of (B) shows size markers of 42 and 29 kDa.
FIG 5
FIG 5
Complex formation of PASC-Kin-P and DcuR at different molar ratios. PASC-Kin was phosphorylated by incubation with ATP, mixed with DcuR and subjected after 10 min to SEC as described for Fig. 4. The concentrations of PASC-Kin-P were 110 μM, 22 μM and 22 μM, respectively for the 1:0.2, 1:5 and 1:10 mixtures (DcuR was added at 22 μM, 110 μM, and 220 μM concentrations respectively). SEC, SDS-PAGE and quantitative evaluation of SDS-PAGE for the contents of PASC-Kin and DcuR were performed in duplicate, other details as described for Fig. 4.
FIG 6
FIG 6
Quantitative evaluation of PASC-Kin and DcuR interaction by microscale thermophoresis PASC-Kin × DcuR (-○-), PASC-Kin-P × DcuR (-□-) and PASC-Kin × DcuR-P (-●-). eYFP-L-DcuR was applied at 0.1 μM, and His6-PASC-Kin in concentrations from 10−1 to 2 × 104 nM as indicated. PASC-Kin and eYFP-DcuR were phosphorylated by ATP and carbamoyl-phosphate, respectively, as described in Fig. 2. Fluorescence difference (ΔFnorm) per thousand [‰] is shown for eYFP-L-DcuR (open circles, left Y-axis) and eYFP-DcuR~P (closed circles, right Y-axis). The lines correspond to a fit based on a 1:1 binding model. The errors present the uncertainty of the fitted Kd value as given by the fitting routine.
FIG 7
FIG 7
YFP-DcuR single-molecule dynamics. (A) Two-population fit of YFP-DcuR single molecule dynamics, using simultaneous Gaussian-mixture-modeling (GMM) under normal growth conditions in M9 minimal-media (−) and with added 50 mM fumarate (+). (B) Table of calculated diffusion values and population sizes, (C) bubble-plot illustrating the relative fraction sizes and average diffusion constants (D [μm2s−1]) of the populations. (D) Summation of tracked fluorescence signals for YFP-DcuR under normal growth conditions in M9 minimal-media (−) and with added 50 mM fumarate (+) and percentage of cells showing localized fluorescence foci (n = 150 cells per replicate) examples marked with white arrow; scale bar 3 μm. (E) Heat maps showing the distribution of diffusion of YFP-DcuR (dark red: higher diffusion, white: lower diffusion) normalized in an average-sized cell in M9 minimal-media (−) and with added 50 mM fumarate (+).
FIG 8
FIG 8
A model for the presence of DcuS and DcuR in bacteria in the presence (A) and absence (B) of fumarate: DcuS × DcuR complex formation and its role doe DcuR phosphorylation or DcuR-P dephosphorylation. The levels of DcuR, DcuS, and of the DcuS × DcuR complexes are given in Table 1, and the number of the respective proteins in the scheme is not equivalent to their level. Generally, levels of DcuR exceed those of DcuS by factors of 29.4 or higher (Table 1). (A) In the presence of fumarate, DcuS2 is activated; (DcuS-P)2 binds DcuR2 with high affinity (Kd 22 nM) and (DcuR-P)2 is produced. A stable DcuS2 × (DcuR-P)2 complex is formed, without free DcuS2 left (see Table 1). Ongoing activation of DcuS (presence of fumarate) stimulates release of (DcuR-P)2 which finds DNA and promoters by 3D-diffusion. (B) In the absence of fumarate, DcuS is not phosphorylated and binds (DcuR-P)2 with high affinity (Kd 28 nM). The intrinsic phosphatase of DcuS dephosphorylates (DcuR-P)2, resulting in the release of DcuR (Kd 1380 nM). Cytosolic DcuR is assumed to exist as apo-DcuR in the phosphate-free state (presented as monomer) or phosphorylated (DcuR-P)2.

Similar articles

Cited by

References

    1. Krell T, Lacal J, Busch A, Silva-Jiménez H, Guazzaroni M-E, Ramos JL. 2010. Bacterial sensor kinases: diversity in the recognition of environmental signals. Annu Rev Microbiol 64:539–559. doi:10.1146/annurev.micro.112408.134054. - DOI - PubMed
    1. Mascher T, Helmann JD, Unden G. 2006. Stimulus perception in bacterial signal-transducing histidine kinases. Microbiol Mol Biol Rev 70:910–938. doi:10.1128/MMBR.00020-06. - DOI - PMC - PubMed
    1. Grebe TW, Stock JB. 1999. The histine protein kinase superfamily. Adv Microb Physiol 41:139–227. doi:10.1016/S0065-2911(08)60167-8. - DOI - PubMed
    1. Wolanin PM, Thomason PA, Stock JB. 2002. Histidine protein kinases: key signal transducers outside the animal kingdom. Genome Biol 3:Reviews3013. doi:10.1186/gb-2002-3-10-reviews3013. - DOI - PMC - PubMed
    1. Kenney LJ. 2010. How important is the phosphatase activity of sensor kinases. Curr Opin Microbiol 13:168–176. doi:10.1016/j.mib.2010.01.013. - DOI - PMC - PubMed

Publication types

MeSH terms

LinkOut - more resources