. 2022 Aug 17;13(8):644-664.e8.
doi: 10.1016/j.cels.2022.06.005. Epub 2022 Jul 20.

Mapping hormone-regulated cell-cell interaction networks in the human breast at single-cell resolution

Affiliations

Mapping hormone-regulated cell-cell interaction networks in the human breast at single-cell resolution

Lyndsay M Murrow et al. Cell Syst. .

Abstract

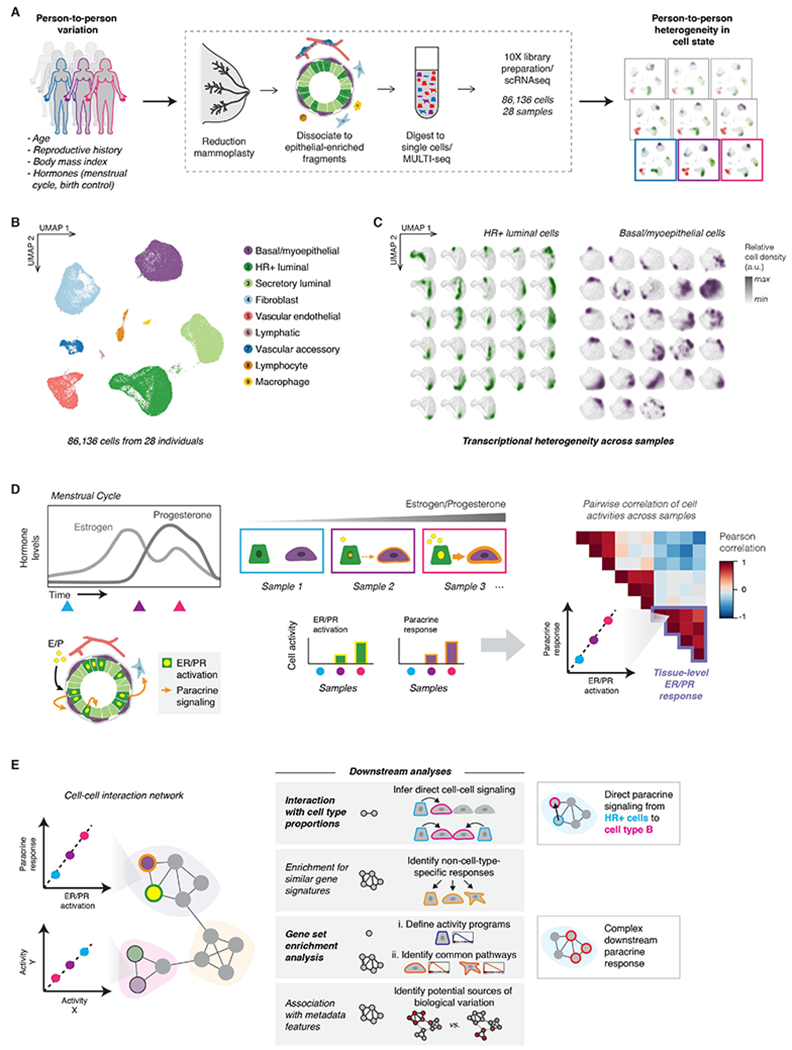
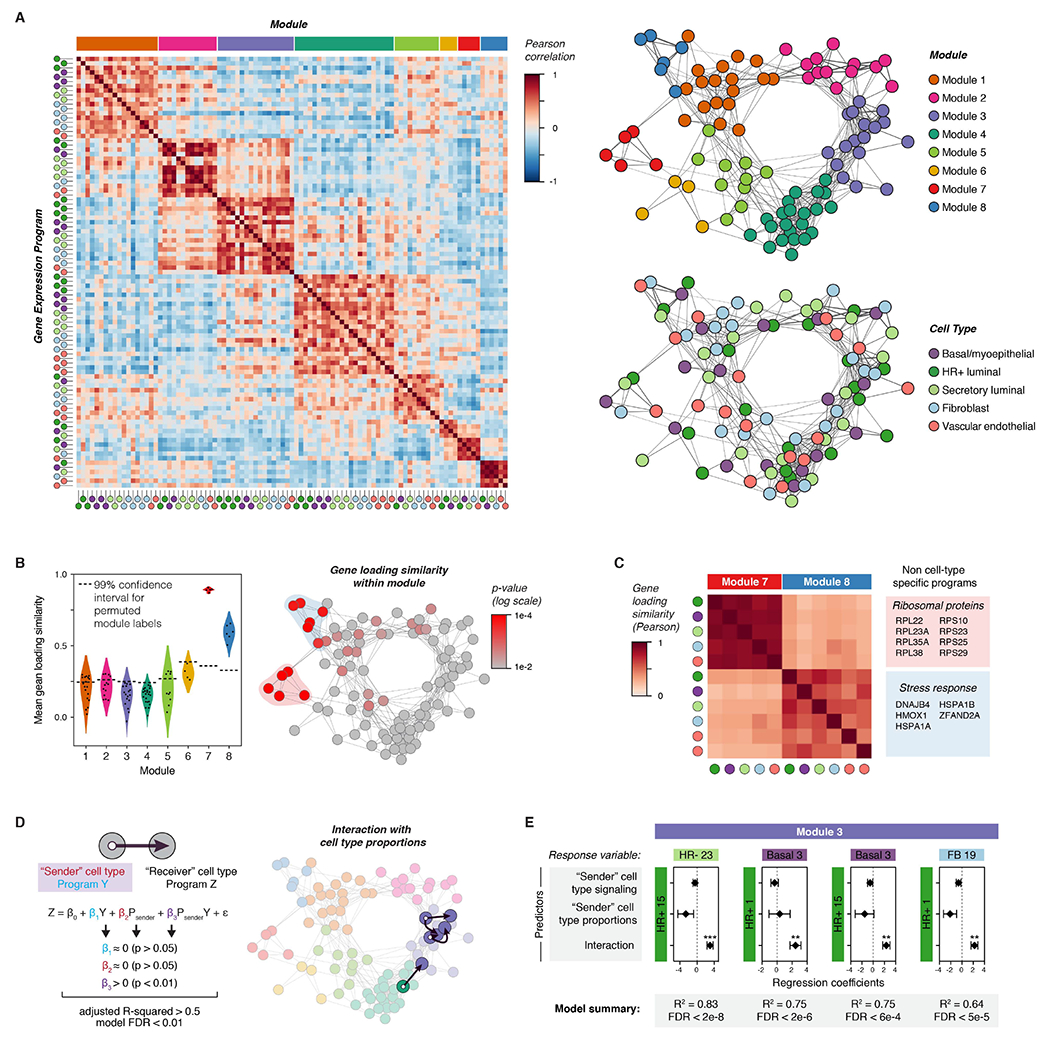
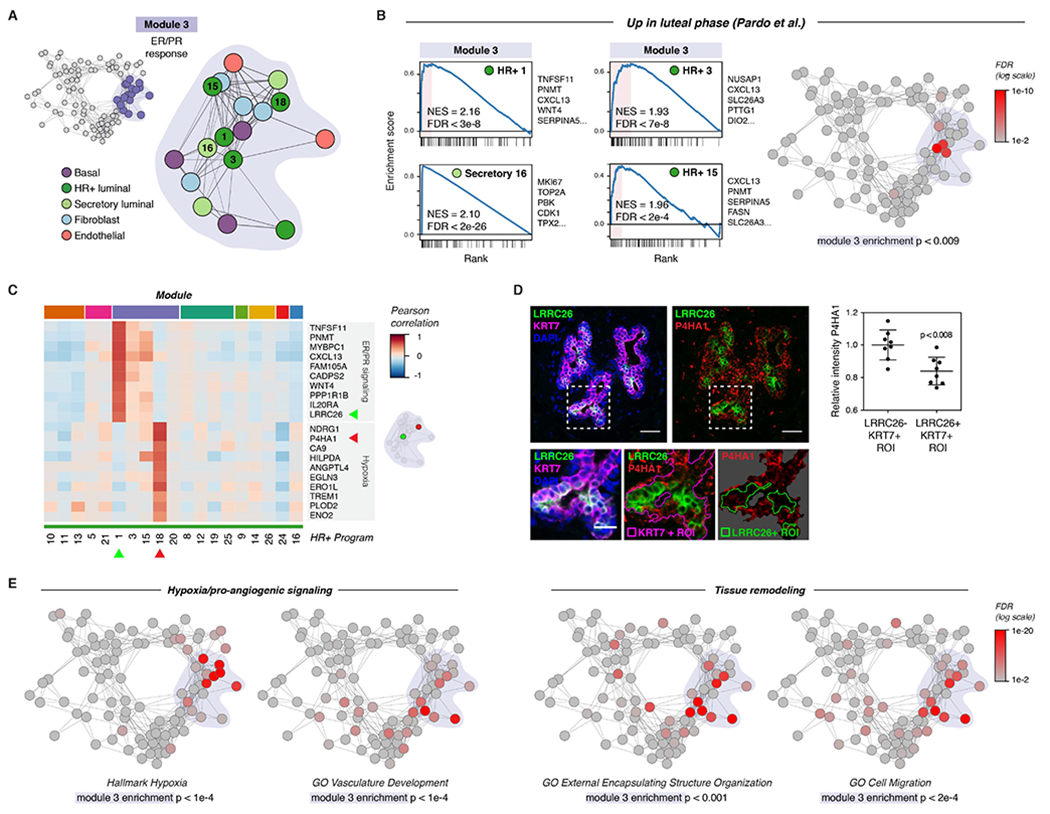
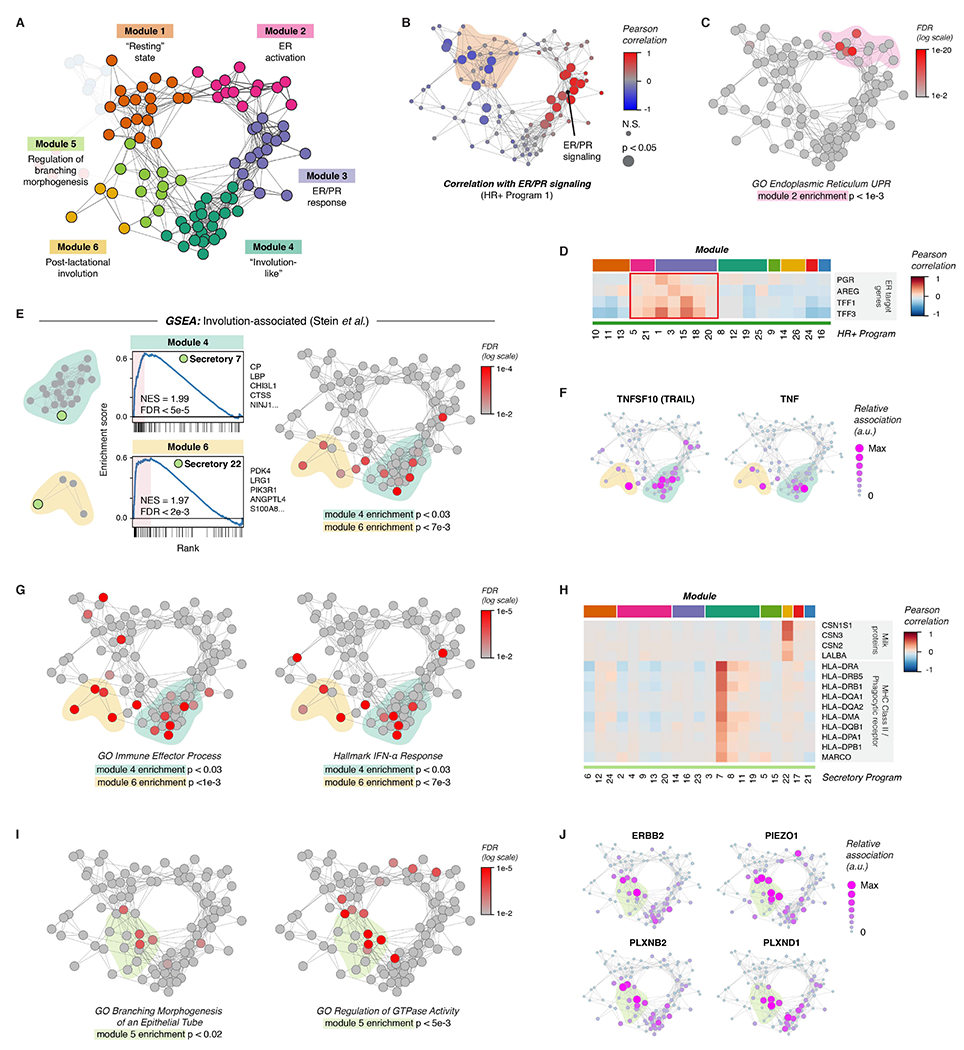
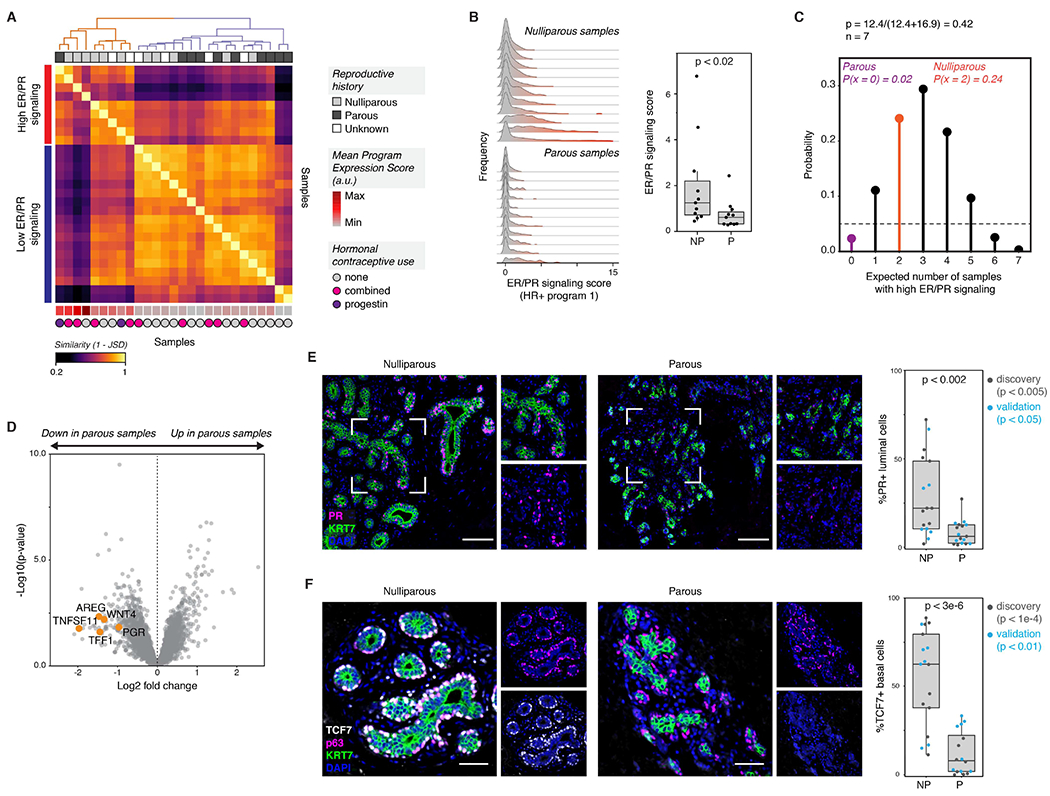
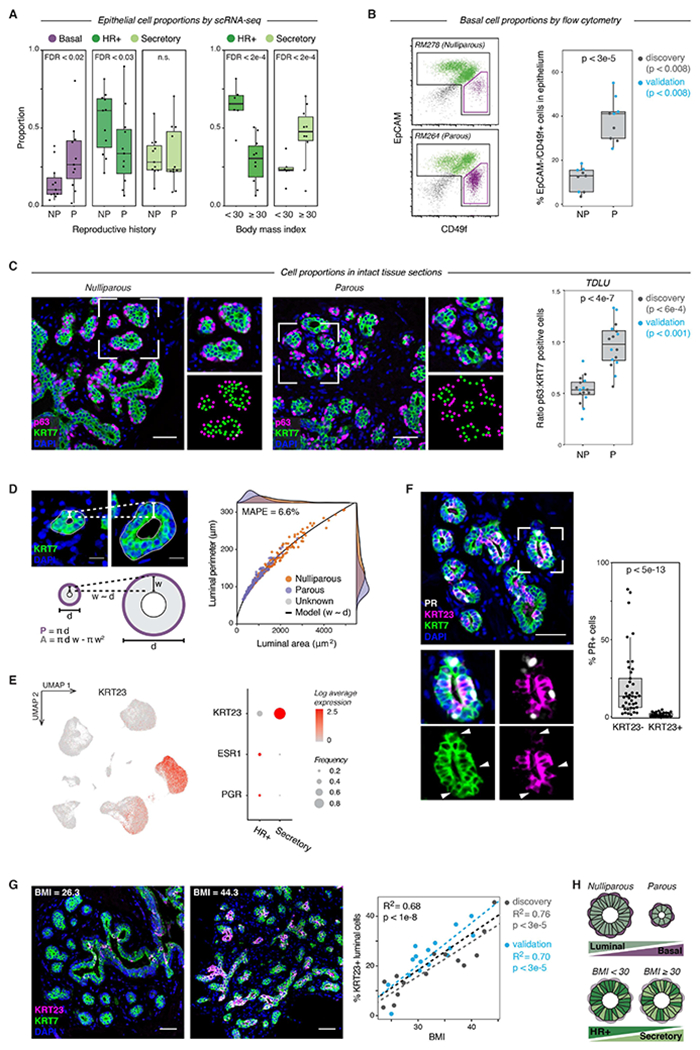
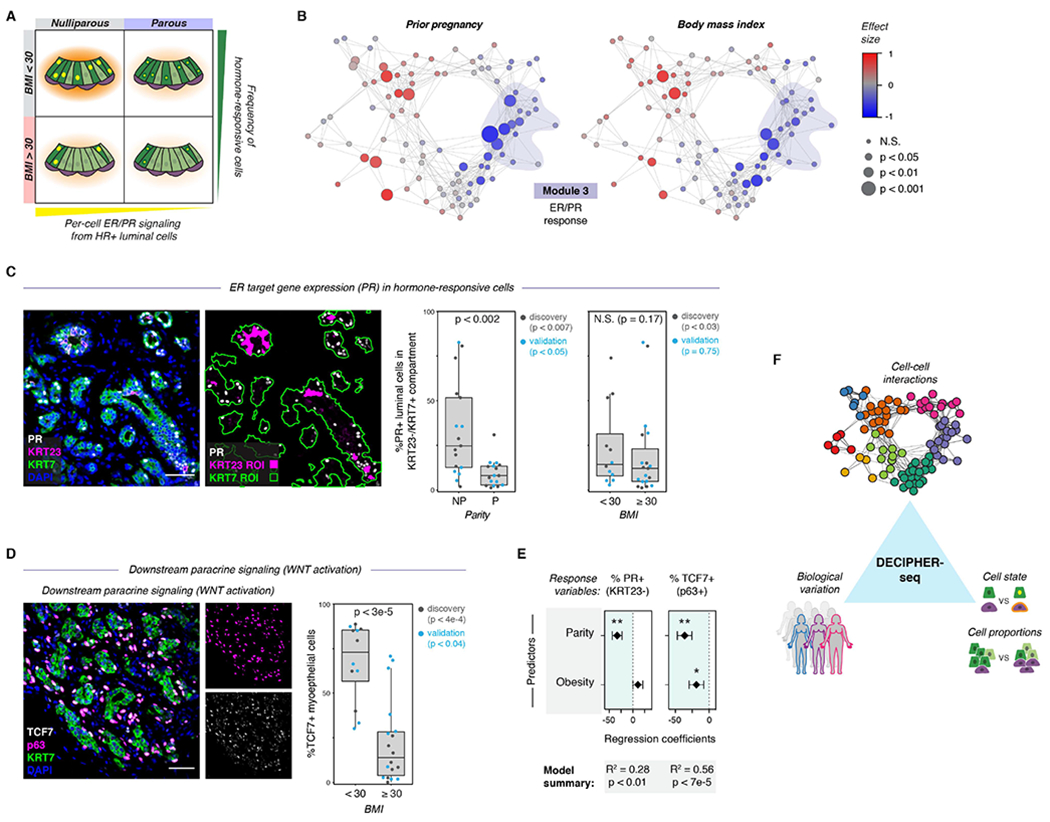
The rise and fall of estrogen and progesterone across menstrual cycles and during pregnancy regulates breast development and modifies cancer risk. How these hormones impact each cell type in the breast remains poorly understood because they act indirectly through paracrine networks. Using single-cell analysis of premenopausal breast tissue, we reveal a network of coordinated transcriptional programs representing the tissue-level response to changing hormone levels. Our computational approach, DECIPHER-seq, leverages person-to-person variability in breast composition and cell state to uncover programs that co-vary across individuals. We use differences in cell-type proportions to infer a subset of programs that arise from direct cell-cell interactions regulated by hormones. Further, we demonstrate that prior pregnancy and obesity modify hormone responsiveness through distinct mechanisms: obesity reduces the proportion of hormone-responsive cells, whereas pregnancy dampens the direct response of these cells to hormones. Together, these results provide a comprehensive map of the cycling human breast.

Keywords: cell-cell interactions; hormone signaling; human breast; sample heterogeneity; scRNA-seq; single-cell genomics.


Conflict of interest statement

Declaration of interests Z.J.G. and C.S.M. hold patents related to the MULTI-seq barcoding method. Z.J.G. is an equity holder in Scribe Biosciences and Provenance bio and a member of the scientific advisory board of Serotiny Bio. C.S.M. is a consultant for ImYoo. Since January 10, 2022, L.M.M. is an employee of Genentech, a member of the Roche group.

Figures

Figure 1.
Figure 1.. Sample-to-sample variability in transcriptional cell state in the premenopausal human breast
(A) Single-cell transcriptional analysis links biological variables with person-to-person heterogeneity in transcriptional cell state. scRNA-seq workflow: Reduction mammoplasty samples were processed to epithelial-enriched tissue fragments, then to single cells, followed by MULTI-seq sample barcoding, library preparation using the 10X Chromium system, and sequencing. (B) The major epithelial and stromal cell types in the breast were identified and visualized by UMAP dimensionality reduction and unsupervised clustering of twenty-eight samples reduction mammoplasty samples (GSE198732, Table S1). (C) Density plots (arbitrary units, linear scale) highlighting the transcriptional cell state of hormone-responsive (HR+) luminal cells and basal/myoepthelial cells from each sample. (D) Overview of conceptual approach: We hypothesized that hormone receptor activation would represent a major source of transcriptional variability in our dataset, and that hormone receptor activation in hormone-responsive (HR+) luminal cells would correlate with transcriptional changes in other cell types—representing the downstream paracrine response. Based on differences in hormone levels due to menstrual cycling (depicted, left) or hormonal contraceptive use, we predicted that gene expression programs representing ER/PR signaling in HR+ luminal cells and the downstream signaling response in other cell types would co-vary across samples (right). (E) Using individual pairwise correlations between cell activities, DECIPHER-seq builds a tissue-level map of the cell-cell interactions present in the healthy human breast and identifies modules of transcriptional states that co-occur across the same sets of samples. In downstream analyses, we exclude modules driven by non-cell-type specific responses to shared signals, and uncover modules enriched for putative direct cell-cell signaling interactions. We define activity programs using gene set enrichment analysis, identify common pathways enriched across activity programs in a module, and uncover potential sources of biological variation by testing association with annotated metadata features.
Figure 2.
Figure 2.. Inferring non-cell-type-specific transcriptional responses and direct cell-to-cell signaling interactions in the human breast
(A) Left: Heatmap depicting Pearson correlation coefficients between activity programs in the eight major modules identified by DECIPHER-seq. Right: Network graph of correlated activity programs in the human breast. Nodes represent distinct activity programs in the indicated cell types, and edges connect significantly correlated programs (Pearson correlation coefficient > 0, p < 0.05). Modules of correlated programs were identified using a Constant Potts Model for community detection. (B) Left: Violin plot of the mean Pearson correlation between gene loadings for each activity program and all other activity programs in the same module (“gene loading similarity”). The horizontal dashed line represents the 99% confidence interval for permuted module labels. Right: Network graph of activity programs in the human breast, colored by the p-value for gene loading similarity for each program (log scale). P-values were calculated by permutation testing. (C) Heatmap depicting Pearson correlation coefficients between gene loadings for the indicated activity programs. The colored boxes list the top-loading genes shared by all programs in the indicated modules. (D) Network graph of activity programs in the human breast, with arrows highlighting inferred direct cell-cell interactions. We modeled each pairwise combination of activity programs as a linear response to the mean expression score of an activity program in a “sender” cell type (β1Y), the proportion of the “sender” cell type in the epithelium (β2 Psender), and an interaction term representing the combined effect of both terms (β3 PsenderY). Arrows highlight pairs where only the interaction term is significant, the model describes over 50% of the variation in the response variable, and the FDR-corrected p-value for the overall model is less than 0.01. (E) Results from multiple linear regression analysis, depicting the four most significant (FDR < 0.01) inferred direct cell-cell interactions. For each pairwise combination, the response variable was modeled in response to three predictors: the expression score in a “sender” cell type (signaling), the proportion of the “sender” cell type, and an interaction term between both predictors. Points represent the regression coefficient for each predictor, error bars depict the standard error.
Figure 3.
Figure 3.. ER/PR signaling and the downstream response
(A) Diagram highlighting activity programs in the “ER/PR response” module. (B) Left: Gene set enrichment analysis of the indicated activity programs in the “ER/PR response” module, showing enrichment of genes upregulated during the luteal phase of the menstrual cycle (Pardo et al., 2014). The top five leading edge genes for each activity program are listed. Right: Network graph of activity programs, colored by the FDR for gene set enrichment of genes upregulated during the luteal phase of the menstrual cycle (log scale; Pardo et al., 2014). Overall enrichment of this gene set in the “ER/PR response” module was determined by permutation analysis. (C) Heatmap of the top 10 marker genes for HR+ 1 and HR+ 8. Results depict the Pearson correlation between the expression score of the indicated activity programs and the normalized expression of the indicated genes across cells. (D) Representative immunostaining for LRRC26, P4HA1, and KRT7 and quantification of the relative mean intensity of P4HA1 signal in LRRC26-/KRT7+ and LRRC26+/KRT7+ regions of interest. Data are represented as individual points, error bars indicate mean ± SEM of 8 regions from 3 samples with high ER/PR signaling. Scale bars 20 μm. Inset scale bar 10 μm. (E) Network graph of activity programs, colored by the FDR for enrichment of the indicated gene sets in each activity program (log scale). Overall enrichment of gene sets within module 1 was determined by permutation analysis.
Figure 4.
Figure 4.. Coordinated changes in signaling states across cell types in the breast
(A) Network diagram highlighting Modules 1-6. (B) Network graph of activity programs in the human breast, colored by the Pearson correlation of each program’s mean expression score across samples with ER/PR signaling (HR+ activity program 1). Significant positive and negative correlations as identified by bootstrap resampling are represented by larger nodes. (C) Network graph of activity programs, colored by the FDR for enrichment of genes in the GO Biological Process set “Endoplasmic Reticulum Unfolded Protein Response” (log scale). Overall enrichment of this gene set within module 2 was determined by permutation analysis. (D) Heatmap of selected estrogen receptor (ER) target genes. Results depict the Pearson correlation between the expression score of the indicated activity programs and the normalized expression of ER target genes across cells. (E) Left: Gene set enrichment analysis of the indicated activity programs in the “Involution-associated” and “Post-lactational involution” modules, showing enrichment of genes previously shown to be upregulated during the post-lactational involution in the mouse (Stein et al., 2004). The top five leading edge genes for each activity program are listed. Right: Network graph of activity programs, colored by the FDR for enrichment of genes upregulated in the Stein gene set (log scale). Overall enrichment of this gene set in each of the indicated modules was determined by permutation analysis. (F) Network graph of activity programs, depicting the relative association of the indicated marker genes with each activity program (arbitrary units, linear scale). (G) Network graph of activity programs, colored by the FDR for enrichment of the indicated gene sets in each activity program (log scale). Overall enrichment of gene sets within the indicated modules was determined by permutation analysis. (H) Heatmap of selected genes including milk proteins, MHC Class II molecules, and the phagocytic receptor MARCO. Results depict the Pearson correlation between the expression score of the indicated activity programs and the normalized expression of the indicated genes across cells. (I) Network graph of activity programs, colored by the FDR for enrichment of the indicated gene sets in each activity program (log scale). Overall enrichment of gene sets within module 5 was determined by permutation analysis. (J) Network graph of activity programs, depicting the relative association of the indicated marker genes with each activity program (arbitrary units, linear scale).
Figure 5.
Figure 5.. The ER/PR signaling response of HR+ luminal cells is reduced in parous women
(A) Heatmap showing the similarity between each sample’s single-cell expression score distribution across HR+ activity program 1 (ER/PR signaling), measured as (1 - Jensen-Shannon distance). Hierarchical clustering (complete linkage) identifies two sets of samples representing high or low expression of the “ER/PR signaling” gene program. The mean expression score for HR+ activity program 1 is annotated at the bottom of the heatmap (arbitrary units, linear scale). (B) Ridge plots depicting the distribution of HR+ program 1 (ER/PR signaling) expression in HR+ luminal cells across nulliparous (NP) versus parous (P) samples, and quantification of the average expression score for HR+ program 1 (n = 22 samples, p < 0.02, Mann-Whitney test). Data are represented as individual points; box indicates the median and interquartile range (IQR) for 11 nulliparous and 11 parous samples; whiskers extend from Q1 - 1.5IQR to Q3 + 1.5IQR. (C) Binomial probability distribution for the expected number of samples with high ER/PR signaling. The binomial probability of high ER/PR signaling is modeled as the average length of the luteal phase of the menstrual cycle, in days, divided by the average total length of the menstrual cycle (p = 0.42) (Bull et al., 2019). (D) Volcano plot highlighting the differential expression of canonical hormone-responsive genes between parous and nulliparous “pseudo-bulk” samples in HR+ luminal cells. Dots represent individual genes. (E) Immunostaining for PR and KRT7, and quantification of the percentage of PR+ cells within the KRT7+ luminal compartment for nulliparous (NP) versus parous (P) samples (n = 34 samples, p < 0.002, Mann-Whitney test). Results are shown for a subset of the original cohort of sequenced samples (“discovery set”, n=19 samples, p < 0.005) and a second independent cohort of samples (“validation” set, n = 15 samples, p < 0.05). Scale bars 100 μm. Data are represented as individual points; box indicates the median and interquartile range (IQR) for the combined dataset (N = 17 nulliparous samples and 17 parous samples); whiskers extend from Q1 - 1.5IQR to Q3 + 1.5IQR. (F) Immunostaining for TCF7, p63, and KRT7, and quantification of the percentage of TCF7+ cells within the p63+ basal/myoepithelial cell compartment for nulliparous (NP) versus parous (P) samples (n = 33 samples, p < 3e-6, Mann-Whitney test). Results are shown for a subset of the original cohort of sequenced samples (“discovery set”, n=18 samples, p < 1e-4) and a second independent cohort of samples (“validation” set, n = 15 samples, p < 0.01). Scale bars 50 μm. Data are represented as individual points; box indicates the median and interquartile range (IQR) for the combined dataset (N = 17 nulliparous samples and 16 parous samples); whiskers extend from Q1 − 1.5IQR to Q3 + 1.5IQR.
Figure 6.
Figure 6.. Reproductive history and body mass index are associated with epithelial cell proportions
(A) Quantification of the proportion of the indicated cell types by scRNA-seq for nulliparous versus parous samples (n = 22 samples, Wald test) and obese versus non-obese samples (n = 16 samples, Wald test). Data are represented as individual points; box indicates the median and interquartile range (IQR) (Left: N = 11 nulliparous and 11 parous samples. Right: N = 6 samples with BMI < 30 and 10 samples with BMI ≥ 30); whiskers extend from Q1 − 1.5IQR to Q3 + 1.5IQR. (B) Representative flow cytometry analysis of the percentage of EpCAM/CD49f+ basal cells within the Lin- epithelial population, and quantification of the percentage of basal cells in nulliparous (NP) versus parous (P) women (n = 18 samples; p < 3e-5, Mann-Whitney test). Results are shown for a subset of the original cohort of sequenced samples (“discovery set”, n=9 samples, p < 0.008) and a second independent cohort of samples (“validation” set, n = 9 samples, p < 0.008). Data are represented as individual points; box indicates the median and interquartile range (IQR) for the combined dataset (N = 9 nulliparous and 9 parous samples); whiskers extend from Q1 − 1.5IQR to Q3 + 1.5IQR. (C) Immunostaining for the basal/myoepithelial marker p63 and pan-luminal marker KRT7 in terminal ductal lobular units (TDLUs), and quantification of the ratio of p63+ basal cells to KRT7+ luminal cells in nulliparous (NP) versus parous (P) women (n = 32 samples; p < 4e-7, Mann-Whitney test). Results are shown for a subset of the original cohort of sequenced samples (“discovery set”, n=17 samples, p < 6e-4) and a second independent cohort of samples (“validation” set, n = 15 samples, p < 0.001). Data are represented as individual points; box indicates the median and interquartile range (IQR) for the combined dataset (N = 16 nulliparous and 16 parous samples); whiskers extend from Q1 − 1.5IQR to Q3 + 1.5IQR. Scale bars 50 μm. (D) Two-dimensional geometric model of the relative space available for basal cells (luminal perimeter, P) and luminal cells (luminal area, A) within individual acini. Acini were modeled as hollow circles with a shell thickness (w) proportional to their diameter (d). Dots represent measurements of individual acini from TDLUs in parous (n=158 acini from 15 samples) or nulliparous (n=164 acini from 16 samples) specimens as indicated. Line represents results from geometric model (mean absolute percentage error = 6.6%). Scale bars 15 μm. (E) Left: UMAP depicting log normalized expression of KRT23 in reduction mammoplasty samples (GSE198732). Right: Dot plot depicting the log normalized mean and frequency of KRT23, ESR1, and PGR expression across luminal cell types. (F) Co-immunostaining of PR, KRT23, and the pan-luminal marker KRT7, and quantification of the percentage of PR+ cells within the KRT23− and KRT23+ luminal cell populations (n = 41 samples; p < 5e-13, Mann-Whitney test). Data are represented as individual points; box indicates the median and interquartile range (IQR) for 41 samples; whiskers extend from Q1 − 1.5IQR to Q3 + 1.5IQR. Scale bar 50 μm. (G) Co-immunostaining of KRT23 and KRT7 and linear regression analysis of the percentage of KRT23+ luminal cells versus BMI (n = 30 samples; R2 =0.68, p < 1e-8, Wald test). Scale bars 50 μm. Results are shown for a subset of the original cohort of sequenced samples (“discovery set”, n=14 samples; R2 =0.76, p < 3e-5) and a second independent cohort of samples (“validation” set, n = 16 samples; R2 =0.70, p < 3e-5). Data are represented as individual points; dotted lines represent the best-fit lines for the discovery cohort (light grey), validation cohort (blue), and combined cohort (dark grey). (H) Summary of changes in epithelial cell proportions with prior pregnancy and obesity (BMI ≥ 30).
Figure 7.
Figure 7.. Biological variables are linked to predicted tissue states
(A) Schematic depicting the model for how parity and obesity impact hormone signaling in the breast through distinct mechanisms. Parity affects per-cell ER/PR signaling in HR+ luminal cells, and obesity (BMI ≥ 30) leads to a reduction in the proportion of hormone-responsive (HR+) luminal cells in the epithelium. (B) Network graph of activity programs in the human breast, colored by the effect size of prior pregnancy (Wilcoxon effect size) or body mass index (Pearson correlation coefficient) on each activity program (linear scale). Significant positive and negative associations are represented by larger nodes (prior pregnancy: Mann-Whitney test; BMI: Wald test). (C) Co-immunostaining of the estrogen receptor target gene PR, KRT23, and the pan-luminal marker KRT7, and quantification of the percentage of PR+ cells in the KRT23−/KRT7+ luminal cell population for nulliparous (NP) versus parous (P) samples (n = 34 samples, p < 0.002, Mann-Whitney test) or non-obese (BMI <30) versus obese (BMI ≥ 30) samples (n = 31 samples, p = 0.17, Mann-Whitney test). Results are shown for a subset of the original cohort of sequenced samples (“discovery” set) and a second independent cohort of samples (“validation” set). Data are represented as individual points; boxes indicate the median and interquartile range (IQR) for the combined datasets (Left: N = 17 nulliparous and 17 parous samples. Right: N = 12 samples with BMI < 30 and 19 samples with BMI ≥ 30); whiskers extend from Q1 − 1.5IQR to Q3 + 1.5IQR. Scale bar 50 μm. (D) Immunostaining forTCF7, p63, and KRT7, and quantification of the percentage of TCF7+ cells within the p63+ basal/myoepithelial cell compartment for non-obese (BMI <30) versus obese (BMI ≥ 30) samples (n = 30 samples, p < 3e-5, Mann-Whitney test). Results are shown for a subset of the original cohort of sequenced samples (“discovery set”, n=14 samples, p < 4e-4) and a second independent cohort of samples (“validation” set, n = 16 samples, p < 0.04). Data are represented as individual points; box indicates the median and interquartile range (IQR) for the combined dataset (N = 12 samples with BMI < 30 and 18 samples with BMI ≥ 30); whiskers extend from Q1 − 1.5IQR to Q3 + 1.5IQR. Scale bar 50 μm. (E) Results from multiple linear regression analysis, with prior pregnancy (parity) and obesity (BMI ≥ 30) as predictors and the percentage of PR+ cells in the KRT23−/KRT7+ luminal cell population or of TCF7+ cells in the p63+ basal cell compartment as response variables. Points represent the regression coefficient for each predictor, error bars depict the standard error. (F) Summary of results. DECIPHER-seq predicts how specific changes in transcriptional cell state and cell type proportions influence cell-cell interactions in the human breast, and links specific sources of biological variation (e.g. Parity, BMI) to the overall signaling state of the tissue.

Similar articles

Cited by

References

    1. Anderson TJ, Ferguson DJ, Raab GM, 1982. Cell turnover in the “resting” human breast: influence of parity, contraceptive pill, age and laterality. Br. J. Cancer 46, 376–382. doi: 10.1038/bjc.1982.213 - DOI - PMC - PubMed
    1. Andruska N, Zheng X, Yang X, Helferich WG, Shapiro DJ, 2015. Anticipatory estrogen activation of the unfolded protein response is linked to cell proliferation and poor survival in estrogen receptor α-positive breast cancer. Oncogene 34, 3760–3769. doi:10.1038/onc.2014.292 - DOI - PMC - PubMed
    1. Aupperlee MD, Leipprandt JR, Bennett JM, Schwartz RC, Haslam SZ, 2013. Amphiregulin mediates progesterone-induced mammary ductal development during puberty. Breast Cancer Res 15, R44–15. doi:10.1186/bcr3431 - DOI - PMC - PubMed
    1. Barkas N, Petukhov V, Nikolaeva D, Lozinsky Y, Demharter S, Khodosevich K, Kharchenko PV, 2019. Joint analysis of heterogeneous single-cell RNA-seq dataset collections. Nat Meth 16, 695–698. doi:10.1038/s41592-019-0466-z - DOI - PMC - PubMed
    1. Barrett ES, Parlett LE, Windham GC, Swan SH, 2014. Differences in ovarian hormones in relation to parity and time since last birth. Fertil. Steril 101, 1773–80.e1. doi:10.1016/j.fertnstert.2014.02.047 - DOI - PMC - PubMed

Publication types