. 2022 Sep 15;82(18):3398-3411.e11.
doi: 10.1016/j.molcel.2022.06.029. Epub 2022 Jul 20.

"Stripe" transcription factors provide accessibility to co-binding partners in mammalian genomes

Affiliations

"Stripe" transcription factors provide accessibility to co-binding partners in mammalian genomes

Yongbing Zhao et al. Mol Cell. .

Abstract

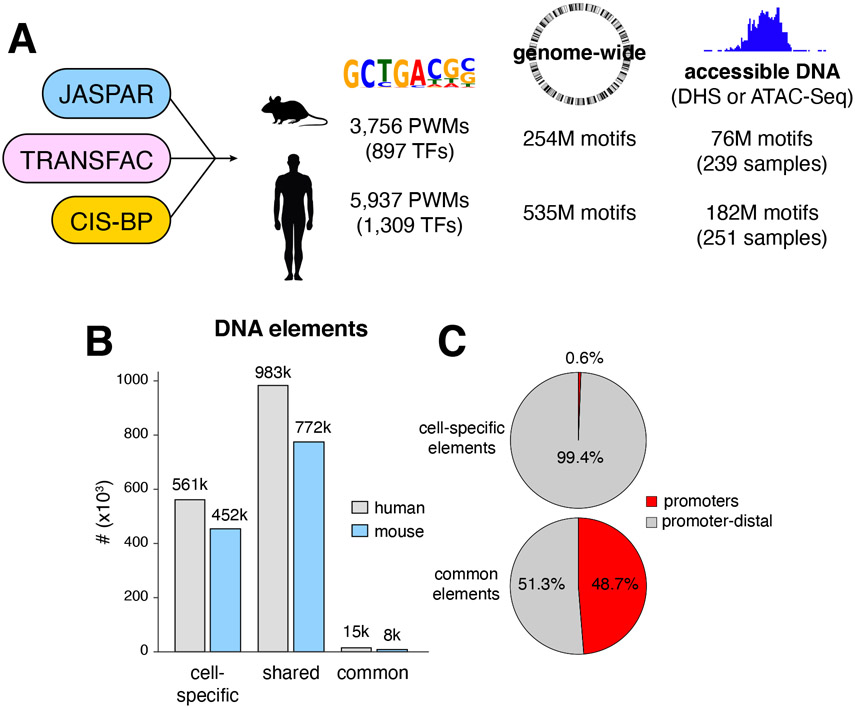
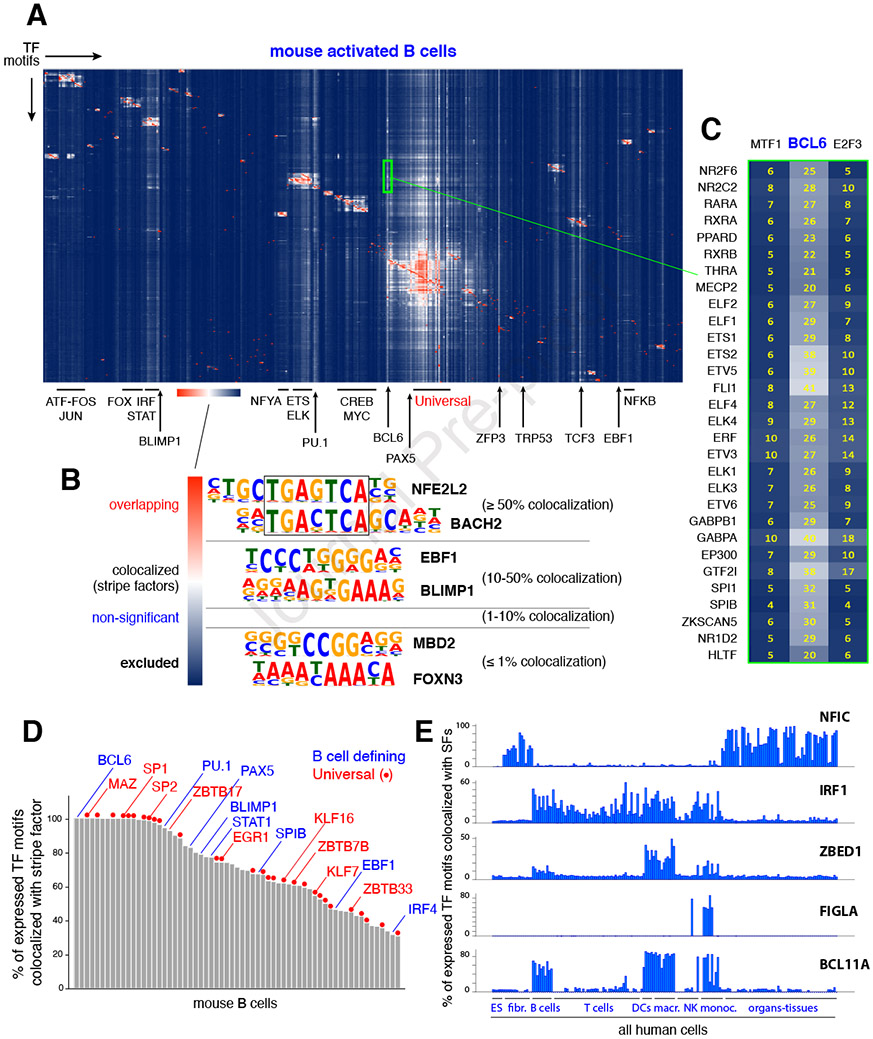
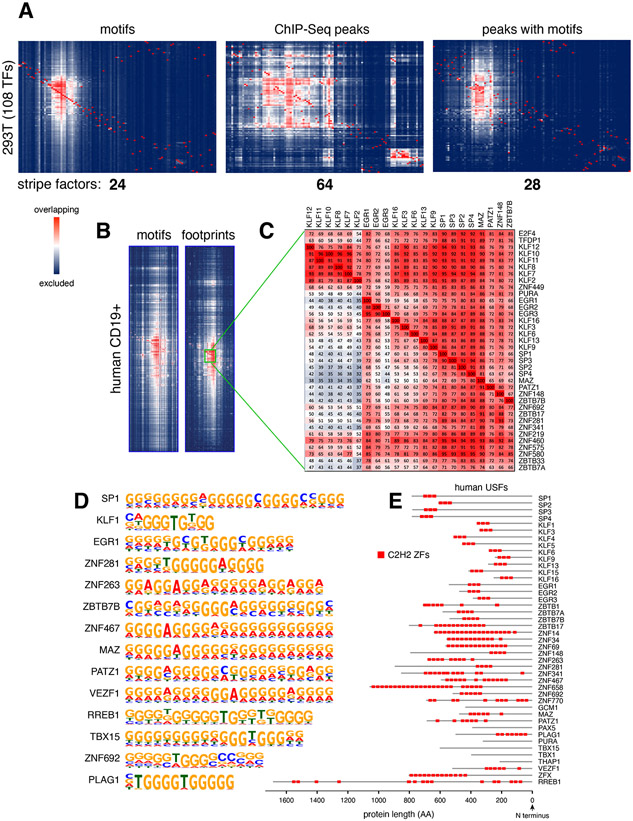
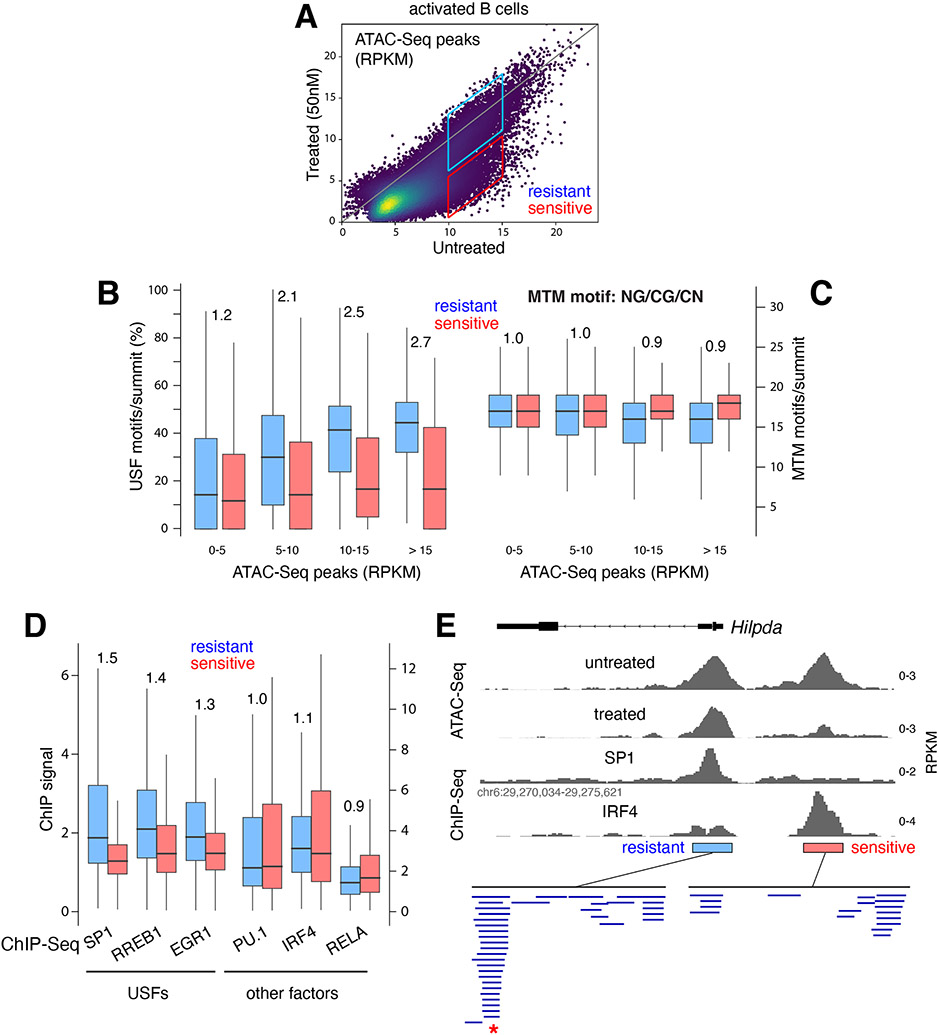
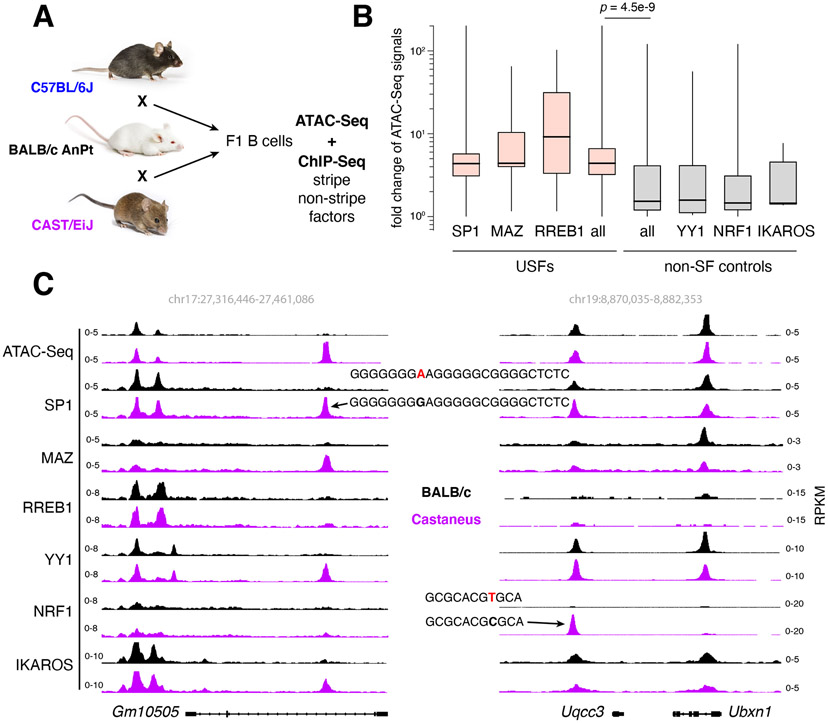
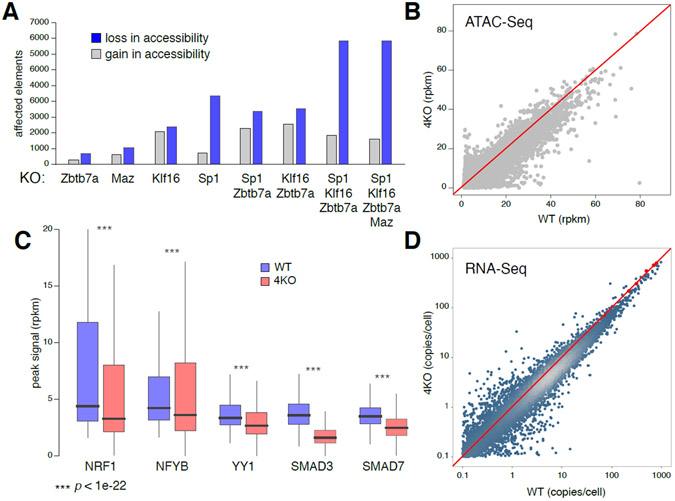
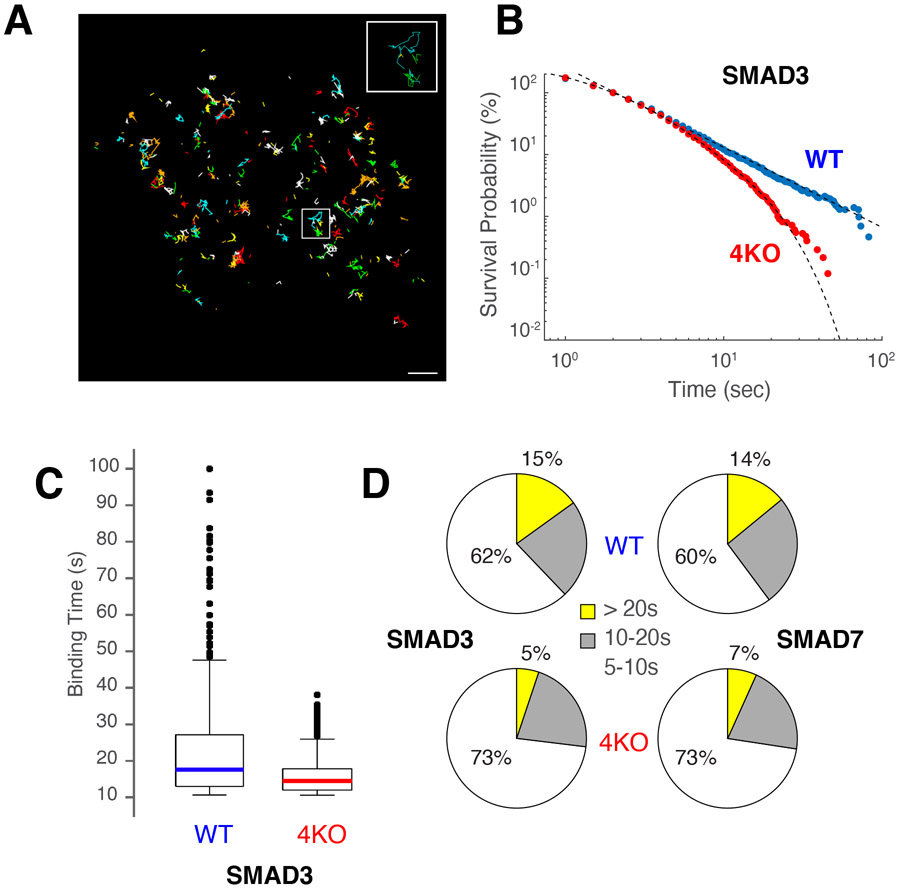
Regulatory elements activate promoters by recruiting transcription factors (TFs) to specific motifs. Notably, TF-DNA interactions often depend on cooperativity with colocalized partners, suggesting an underlying cis-regulatory syntax. To explore TF cooperativity in mammals, we analyze ∼500 mouse and human primary cells by combining an atlas of TF motifs, footprints, ChIP-seq, transcriptomes, and accessibility. We uncover two TF groups that colocalize with most expressed factors, forming stripes in hierarchical clustering maps. The first group includes lineage-determining factors that occupy DNA elements broadly, consistent with their key role in tissue-specific transcription. The second one, dubbed universal stripe factors (USFs), comprises ∼30 SP, KLF, EGR, and ZBTB family members that recognize overlapping GC-rich sequences in all tissues analyzed. Knockouts and single-molecule tracking reveal that USFs impart accessibility to colocalized partners and increase their residence time. Mammalian cells have thus evolved a TF superfamily with overlapping DNA binding that facilitate chromatin accessibility.

Keywords: DNA motifs; chromatin accessibility; enhancer syntax; gene expression; mammalian genomes; regulatory elements; single molecule tracking; transcription factors.


Conflict of interest statement

Declaration of interests S.P. and L.V. are employees of Astra Zeneca and may own stock or stock options.

Figures

Figure 1.
Figure 1.. A comprehensive map of TF motifs in the mouse and human genomes.
(A) JASPAR, TRANSFAC, and CIS-BP databases were merged to define 3,756 and 5,937 PWMs for mouse and human TFs respectively. Analysis of the two genomes resulted in 254 and 535 million TF binding motifs. Based on DHS and ATAC-Seq data, 76 and 182 million motifs were identified in accessible DNA in the two genomes. (B) Bar graph showing the number of accessible DNA elements found in a single cell type (unique), shared between multiple cell types, or present in all cell types (common) in mice and humans. Throughout the text, DNA elements refer to 201bp ATAC-Seq (or DHS-Seq) or summits, detected by MACS2. (C) Pie charts show the percentage of cell-specific or common DNA elements associated with or distal to promoters in the mouse genome.
Figure 2.
Figure 2.. TF combinatorial information.
(A) Agglomerative hierarchical clustering showing the frequency of colocalization for all known TF pairs in mouse B cells. Family clusters are highlighted with bars while stripe factors are denoted with arrows. The color scale shown at the bottom illustrates the relative colocalization between functional motif pairs: red represents ≥ 50%; white represents 10-50%; blue represents non-significant to excluded (≤ 1%). (B) Hierarchical clustering identifies 4 main TF motif pair groups: overlapping (≥ 50% colocalization), colocalized (10-50%, stripe factors being a special case), non-significant, and excluded (≤ 1% colocalization). (C) Close up view of the BCL6 stripe (green rectangle in panel A). As an example, 25% of all elements containing the NR2F6 TF motif (top in the list) also contain the BCL6 motif. (D) Bar graph showing all 63 mouse B cell stripe factors classified based on the percentage of expressed TFs that are colocalized with them. Examples of B cell-defining factors (blue) and universal stripe factors (red) are shown. (E) Examples of TFs that display stripe profiles in defined cell types.
Figure 3.
Figure 3.. Universal Stripe Factors.
(A) Agglomerative hierarchical clustering of 108 TFs expressed in HEK293 cells based on TF motifs (left), ChIP-Seq peaks (middle), or ChIP-Seq peaks carrying cognate motifs (right). The number of stripe factors are included below each graph. (B) Heat map sections showing the USF cluster in human CD19+ B cells based on motifs (left) or footprinting (right) analysis. (C) Closeup view of the clustering. Numbers in each square (e.g. 72%) denote the percentage of elements that are positive for a “row” TF motif (E2F4) that also contain a “column” TF motif (KLF12). (D) The most common PWM motif assigned to human USFs. (E) Location of C2H2 ZFs (red squares) in human USFs.
Figure 4.
Figure 4.. USF recruitment correlates with accessibility and resistance to MTM.
(A) Dot plot showing ATAC-Seq signals at DNA elements from untreated vs. MTM-treated (50nM) activated B cells. Boxes identify resistant and sensitive populations. (B) Box plot showing the fraction of USFs per ATAC-Seq summit that are resistant (blue) or sensitive (red) to MTM treatment. The peaks were classified into 4 populations based on RPKM values as shown in panel A. (C) Number of MTM binding motifs per summit of ATAC-Seq peaks as shown in panel B. (D) ChIP-Seq signal intensity for 3 USF and 3 control TFs at elements that are resistant (blue) or sensitive (red) to MTM treatment. (E) Example of MTM-resistant and sensitive elements (based on ATAC-Seq) at the Hilpda locus in mouse B cells. Binding of SP1 (USF) and IRF4 (based on ChIP-Seq) and predicted TF motifs are included. Red asterisk below denotes overlapping USF motifs.
Figure 5.
Figure 5.. USFs provide accessibility to regulatory DNA.
(A) Experimental strategy to assess accessibility at ATAC-Seq peaks where a single SNPs impacts recruitment of USFs or non-SFs. Mice images were obtained from the Jackson lab with permission. (B) Bar graph shows fold change in ATAC-Seq signals at elements where SNPs reduce occupancy of USFs (pink) or non-SF (grey) controls in F1 B cells. (C) Examples of ATAC-Seq peaks carrying single SNPs targeting SP1 (left) or NRF1 (right) binding motifs. BALB/c and Castaneous alleles are depicted in black and purple respectively.
Figure 6.
Figure 6.. Deletion of USFs affects recruitment of TF partners.
(A) Bar graph depicting the number of elements affected in accessibility (ATAC-Seq) >2 fold upon loss of individual or different combinations of USFs. (B) Scatter plot shows ATAC-Seq signals (rpkm values) in WT and 4KO CH12 B cells, lacking SP1, MAX, KLF16 and ZBTB7A. (C) Box plot shows ChIP-Seq signals of 5 TFs in WT and 4KO cells. Signal reduction (100% - median fold change value on each peak) were 30% for NRF1, 17% for YB1, 22% for YY1, 52% for SMAD3 and 29% for SMAD7. (D) Comparison of transcriptomes in WT and 4KO cells normalized using spike in controls in TFGβ activated cells (red dots and line).
Figure 7.
Figure 7.. Lack of USF recruitment impacts residence time of colocalized factors.
(A) Micrograph showing particle trajectories of HALO-SMAD3 in WT CH12 B cells. Colors represent different tracks. Bar = 1 μm. (B) Survival probability (%) of HALO-SMAD3 molecules in WT (blue) or 4KO (red) CH12 B cells. The data was fitted to power-law or biexponential curves respectively. (C) Box plot showing binding time distribution (in seconds) of HALO-SMAD3 molecules expressed in WT or 4KO cells. (D) Pie charts showing percentage of the different diffusive states of SMAD3 (left) or SMAD7 (right) displaying residence times of 5-10” (white), 10-20” (grey) or > 20” (yellow). Upper pie charts represent data from WT cells, lower from 4KO.

References

    1. Barozzi I, Simonatto M, Bonifacio S, Yang L, Rohs R, Ghisletti S, and Natoli G (2014). Coregulation of transcription factor binding and nucleosome occupancy through DNA features of mammalian enhancers. Mol Cell 54, 844–857. - PMC - PubMed
    1. Bassuk AG, and Leiden JM (1995). A direct physical association between ETS and AP-1 transcription factors in normal human T cells. Immunity 3, 223–237. - PubMed
    1. Biddie SC, John S, Sabo PJ, Thurman RE, Johnson TA, Schiltz RL, Miranda TB, Sung MH, Trump S, Lightman SL, et al. (2011). Transcription factor AP1 potentiates chromatin accessibility and glucocorticoid receptor binding. Mol Cell 43, 145–155. - PMC - PubMed
    1. Bourges C, Groff AF, Burren OS, Gerhardinger C, Mattioli K, Hutchinson A, Hu T, Anand T, Epping MW, Wallace C, et al. (2020). Resolving mechanisms of immune-mediated disease in primary CD4 T cells. EMBO Mol Med 12, e12112. - PMC - PubMed
    1. Buenrostro JD, Giresi PG, Zaba LC, Chang HY, and Greenleaf WJ (2013). Transposition of native chromatin for fast and sensitive epigenomic profiling of open chromatin, DNA-binding proteins and nucleosome position. Nat Methods 10, 1213–1218. - PMC - PubMed

Publication types