. 2022 Sep;24(9):963-976.
doi: 10.1016/j.jmoldx.2022.05.007. Epub 2022 Jul 18.

Clinical Performance Characteristics of the Swift Normalase Amplicon Panel for Sensitive Recovery of Severe Acute Respiratory Syndrome Coronavirus 2 Genomes

Affiliations

Clinical Performance Characteristics of the Swift Normalase Amplicon Panel for Sensitive Recovery of Severe Acute Respiratory Syndrome Coronavirus 2 Genomes

Lasata Shrestha et al. J Mol Diagn. 2022 Sep.

Abstract

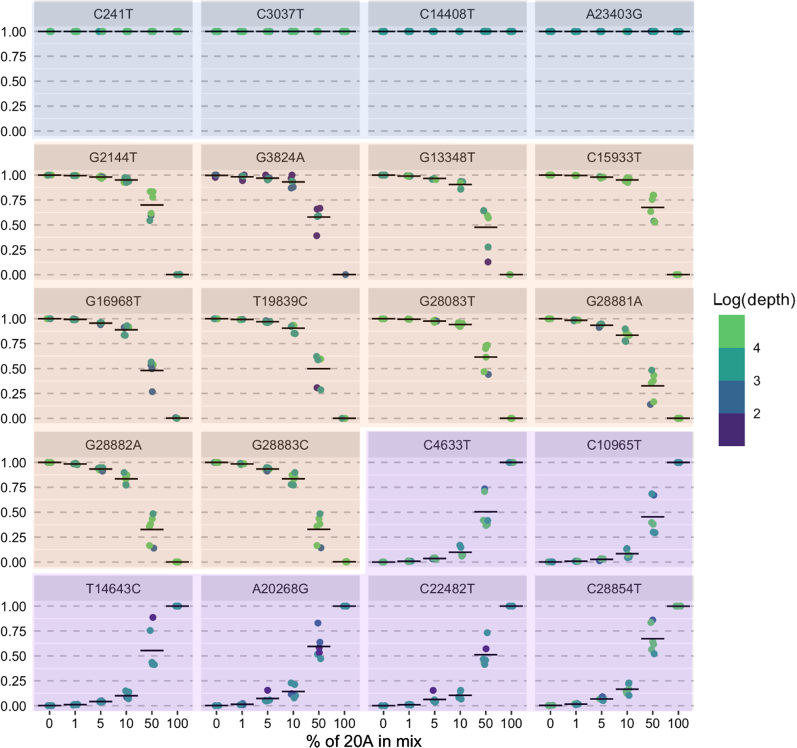
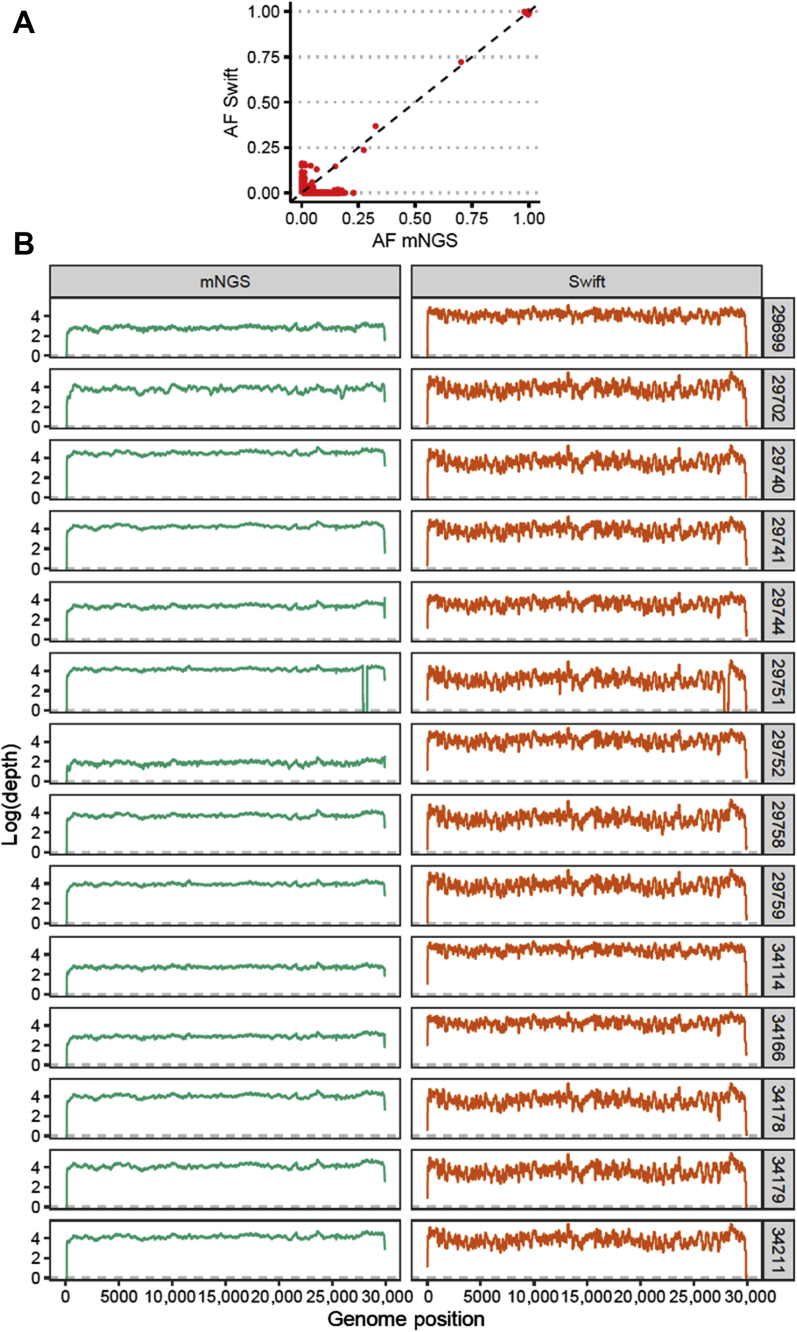
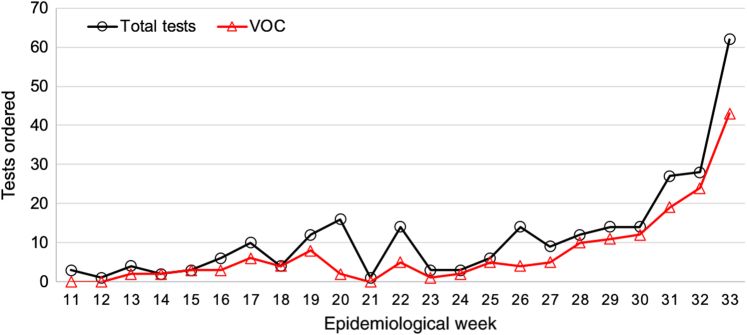
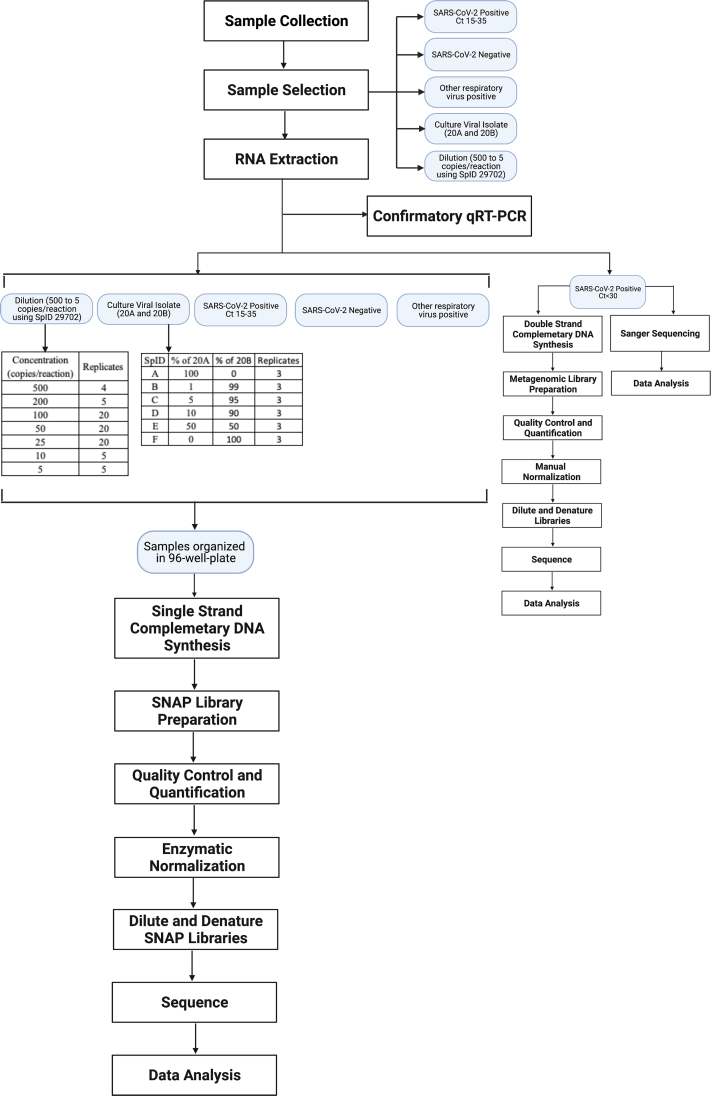
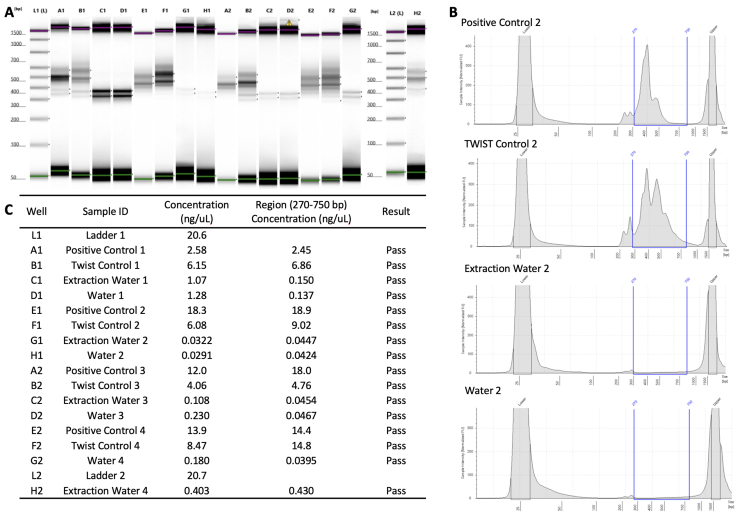
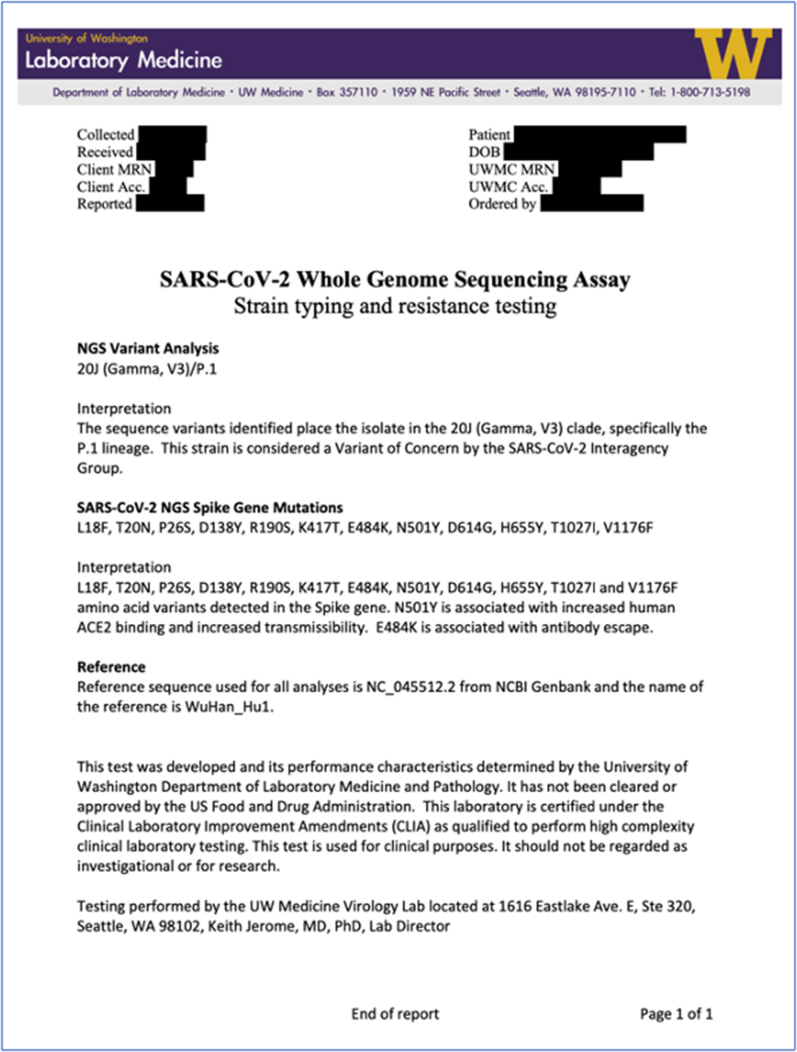
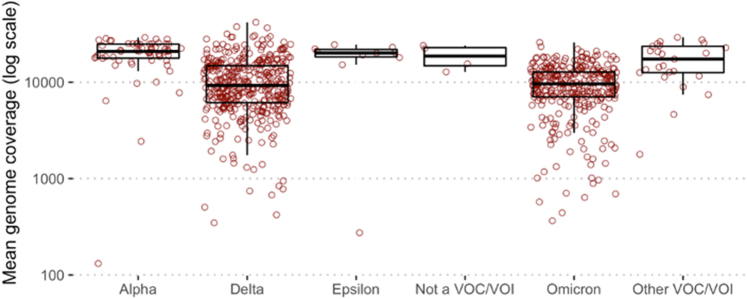
Amplicon-based sequencing methods are central in characterizing the diversity, transmission, and evolution of severe acute respiratory syndrome coronavirus 2 (SARS-CoV-2), but need to be rigorously assessed for clinical utility. Herein, we validated the Swift Biosciences' SARS-CoV-2 Swift Normalase Amplicon Panels using remnant clinical specimens. High-quality genomes meeting our established library and sequence quality criteria were recovered from positive specimens, with 95% limit of detection of 40.08 SARS-CoV-2 copies/PCR. Breadth of genome recovery was evaluated across a range of CT values (11.3 to 36.7; median, 21.6). Of 428 positive samples, 413 (96.5%) generated genomes with <10% unknown bases, with a mean genome coverage of 13,545× ± SD 8382×. No genomes were recovered from PCR-negative specimens (n = 30) or from specimens positive for non-SARS-CoV-2 respiratory viruses (n = 20). Compared with whole-genome shotgun metagenomic sequencing (n = 14) or Sanger sequencing for the spike gene (n = 11), pairwise identity between consensus sequences was 100% in all cases, with highly concordant allele frequencies (R2 = 0.99) between Swift and shotgun libraries. When samples from different clades were mixed at varying ratios, expected variants were detected even in 1:99 mixtures. When deployed as a clinical test, 268 tests were performed in the first 23 weeks, with a median turnaround time of 11 days, ordered primarily for outbreak investigations and infection control.


Figures

Figure 1
Figure 1
Measured allele frequency (y axis) for all expected mutations in sample mixtures described in Table 5. Blue panels indicate mutations common to WA-UW-20236 TM (20A) and WA-UW-19433 TM (20B) samples; orange panels, mutations expected in 20B sample; and purple panels, mutations expected in 20A samples. n = 20 expected mutations.
Figure 2
Figure 2
Swift versus shotgun metagenomic next-generation sequencing (mNGS). A: Allele frequencies (AFs) are highly concordant between Swift and mNGS libraries. B: Comparison of depth of coverage (log10 reads) versus genomic position relative to NC_045512 for specimens sequenced with both Swift (right panels,orange) and mNGS (left panels,green). n = 14 samples (A).
Figure 3
Figure 3
Highly reproducible allele frequencies (AFs) across replicate libraries of 12 SARS-CoV-2–positive specimens sequenced on the same run (A) and on different runs on a different day by a different technician (B). Dashed gray lines show lines of best fit by linear regression, and shaded gray bands represent 95% CIs for the linear fit.
Figure 4
Figure 4
Weekly SARS-CoV-2 clinical whole-genome sequencing test volumes, along with the number of variants of concern (VOCs) detected in each week's batch.
Supplemental Figure S1
Summary of overall validation steps. 20A, WA-UW-20236 TM; 20B, WA-UW-19433 TM; SNAP, Swift Normalase Amplicon Panel.
Supplemental Figure S2
A: TapeStation traces for clinical and Twist positive controls and two negative controls (water). Green and pink horizontal bars show lower and upper markers, respectively. B: Examples of electropherogram view of the controls with region view from 270 to 750 bp indicated with blue lines. The upper (right) and lower (left) markers in the High Sensitivity D1000 assay are labeled in each panel. C: Table with the total concentration and the region (270 to 750 bp) concentration of the library fragments for each sample represented in A. ID, identifier.
Supplemental Figure S3
Sample report for clinical test orders. NCBI, National Center for Biotechnology Information; NGS, next-generation sequencing.
Supplemental Figure S4
Mean genome coverage for samples sequenced for genomic surveillance shows reduced coverage for Delta and Omicron samples. VOC, variant of concern; VOI, variant of interest.
Supplemental Figure S5
Gels showing Sanger amplicons for one representative sample (SpID 26865). Lanes from left to right show: amplicon 1 F1a/R1a, F1a/R1b, F1b/R1a, and F1b/R1b; amplicon 2 F2a/R2a, F2a/R2b, F2b/R2a, and F2b/R2b; blank lane; 3 μL of 100- to 3000-bp ladder; and 5 μL ladder (A); and amplicon 3 F3a/R3a, F3a/R3b, F3b/R3a, and F3b/R3b; two blank lanes; and 3 μL ladder (B). Note that the amplicon 1 and amplicon 2 samples from gel 1 are visible at the bottom of gel 2 because samples were run consecutively on the same gel. Most sequencing was performed on amplicons generated using primers F1a/R1b, F2a/R2a, and F3b/R3b.
Supplemental Figure S6
Instrument validation: identical libraries were sequenced in parallel on the Illumina NextSeq 500 and an Illumina NextSeq 2000 (VH00441). Blue lines show lines of best fit by linear regression, and dashed lines show y = x (perfect concordance). n = 181 identical libraries. Af, allele frequency; Ns, unknown bases.
Supplemental Figure S7
Instrument validation: identical libraries were sequenced in parallel on two different Illumina NextSeq 2000 instruments (VH00441/NS2K441 versus VH00474/NS2K474). Blue lines show lines of best fit by linear regression, and dashed lines show y = x (perfect concordance). n = 185 identical libraries. Af, allele frequency; Ns, unknown bases.
Supplemental Figure S8
Instrument validation: identical libraries were sequenced in parallel on an Illumina NextSeq 2000 and an Illumina MiSeq. Blue lines show lines of best fit by linear regression, and dashed lines show y = x (perfect concordance). n = 12 identical libraries. Af, allele frequency; Ns, unknown bases.

References

    1. Elbe S., Buckland-Merrett G. Data, disease and diplomacy: GISAID’s innovative contribution to global health. Glob Chall. 2017;1:33–46. - PMC - PubMed
    1. Moustafa A.M., Planet P.J. Jumping a moving train: SARS-CoV-2 evolution in real time. J Pediatr Infect Dis Soc. 2021;10:S96–S105. - PMC - PubMed
    1. Paden C.R., Tao Y., Queen K., Zhang J., Li Y., Uehara A., Tong S. Rapid, sensitive, full-genome sequencing of severe acute respiratory syndrome coronavirus 2. Emerg Infect Dis. 2020;26:2401–2405. - PMC - PubMed
    1. Fauver J.R., Petrone M.E., Hodcroft E.B., Shioda K., Ehrlich H.Y., Watts A.G., et al. Coast-to-coast spread of SARS-CoV-2 during the early epidemic in the United States. Cell. 2020;181:990–996.e5. - PMC - PubMed
    1. Deng X., Gu W., Federman S., du Plessis L., Pybus O.G., Faria N.R., et al. Genomic surveillance reveals multiple introductions of SARS-CoV-2 into Northern California. Science. 2020;369:582–587. - PMC - PubMed

Publication types