

Optical imaging detects metabolic signatures associated with oocyte quality†
- PMID: 35863764
- PMCID: PMC9562116
- DOI: 10.1093/biolre/ioac145
Optical imaging detects metabolic signatures associated with oocyte quality†
Abstract
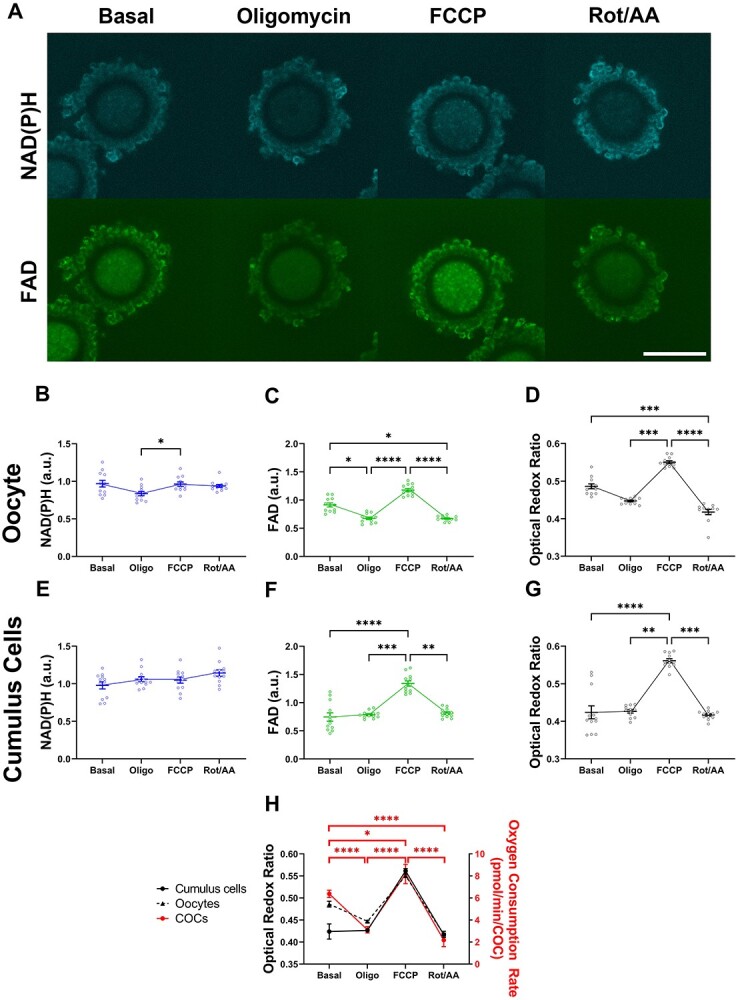
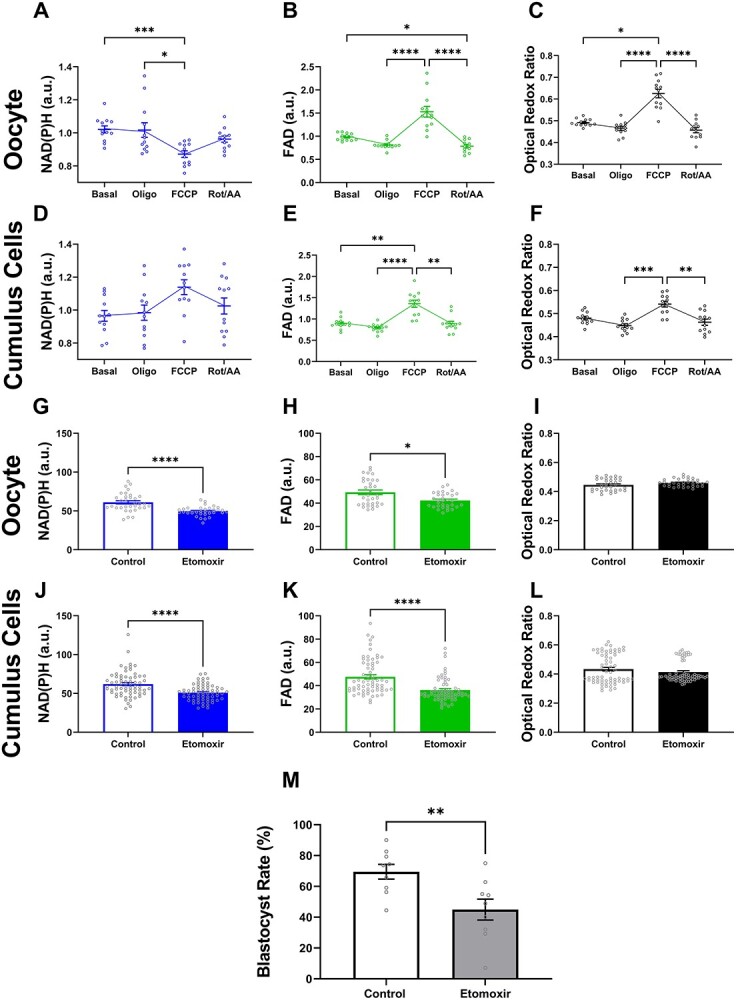
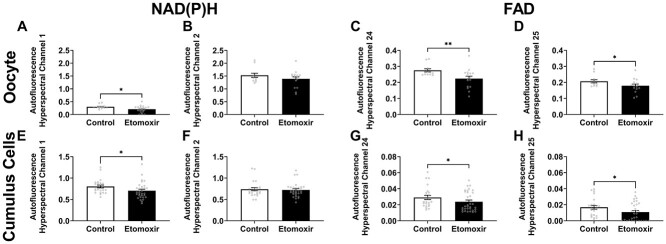
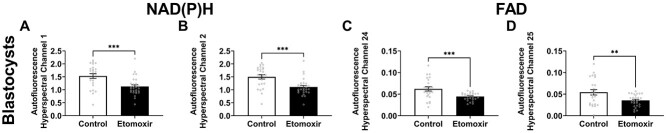
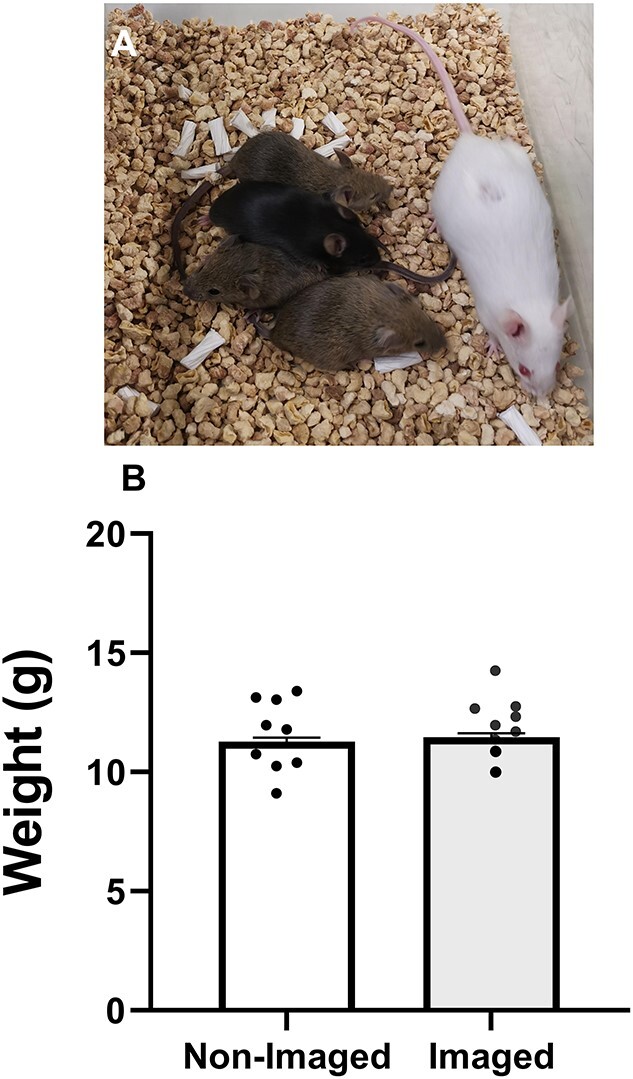
Oocyte developmental potential is intimately linked to metabolism. Existing approaches to measure metabolism in the cumulus oocyte complex (COC) do not provide information on the separate cumulus and oocyte compartments. Development of an assay that achieves this may lead to an accurate diagnostic for oocyte quality. Optical imaging of the autofluorescent cofactors reduced nicotinamide adenine dinucleotide (phosphate) [NAD(P)H] and flavin adenine dinucleotide (FAD) provides a spatially resolved indicator of metabolism via the optical redox ratio (FAD/[NAD(P)H + FAD]). This may provide an assessment of oocyte quality. Here, we determined whether the optical redox ratio is a robust methodology for measuring metabolism in the cumulus and oocyte compartments compared with oxygen consumption in the whole COC. We also determined whether optical imaging could detect metabolic differences associated with poor oocyte quality (etomoxir-treated). We used confocal microscopy to measure NAD(P)H and FAD, and extracellular flux to measure oxygen consumption. The optical redox ratio accurately reflected metabolism in the oocyte compartment when compared with oxygen consumption (whole COC). Etomoxir-treated COCs showed significantly lower levels of NAD(P)H and FAD compared to control. We further validated this approach using hyperspectral imaging, which is clinically compatible due to its low energy dose. This confirmed lower NAD(P)H and FAD in etomoxir-treated COCs. When comparing hyperspectral imaged vs non-imaged COCs, subsequent preimplantation development and post-transfer viability were comparable. Collectively, these results demonstrate that label-free optical imaging of metabolic cofactors is a safe and sensitive assay for measuring metabolism and has potential to assess oocyte developmental competence.
Keywords: FAD; NAD(P)H; autofluorescence; cellular metabolism; non-invasive; oocyte assessment; optical imaging; optical redox ratio; oxygen consumption rate.
© The Author(s) 2022. Published by Oxford University Press behalf of Society for the Study of Reproduction.
Figures
Similar articles
-
Noninvasive metabolic profiling of cumulus cells, oocytes, and embryos via fluorescence lifetime imaging microscopy: a mini-review.Hum Reprod. 2023 May 2;38(5):799-810. doi: 10.1093/humrep/dead063. Hum Reprod. 2023. PMID: 37015098 Free PMC article. Review.
-
Non-invasive assessment of oocyte developmental competence.Reprod Fertil Dev. 2022 Dec;35(2):39-50. doi: 10.1071/RD22217. Reprod Fertil Dev. 2022. PMID: 36592982 Review.
-
Effect of epidermal growth factor-like peptides on the metabolism of in vitro- matured mouse oocytes and cumulus cells.Biol Reprod. 2014 Mar 6;90(3):49. doi: 10.1095/biolreprod.113.115311. Print 2014 Mar. Biol Reprod. 2014. PMID: 24451986
-
Metabolic differences in bovine cumulus-oocyte complexes matured in vitro in the presence or absence of follicle-stimulating hormone and bone morphogenetic protein 15.Biol Reprod. 2012 Oct 11;87(4):87. doi: 10.1095/biolreprod.112.102061. Print 2012 Oct. Biol Reprod. 2012. PMID: 22895854
-
Fluorescence lifetime imaging microscopy (FLIM) detects differences in metabolic signatures between euploid and aneuploid human blastocysts.Hum Reprod. 2022 Mar 1;37(3):400-410. doi: 10.1093/humrep/deac016. Hum Reprod. 2022. PMID: 35106567
Cited by
-
Quantifying DNA damage following light sheet and confocal imaging of the mammalian embryo.Sci Rep. 2024 Sep 5;14(1):20760. doi: 10.1038/s41598-024-71443-x. Sci Rep. 2024. PMID: 39237572 Free PMC article.
-
Reorganization, specialization, and degradation of oocyte maternal components for early development.Reprod Med Biol. 2023 Jan 28;22(1):e12505. doi: 10.1002/rmb2.12505. eCollection 2023 Jan-Dec. Reprod Med Biol. 2023. PMID: 36726596 Free PMC article. Review.
-
Noninvasive metabolic profiling of cumulus cells, oocytes, and embryos via fluorescence lifetime imaging microscopy: a mini-review.Hum Reprod. 2023 May 2;38(5):799-810. doi: 10.1093/humrep/dead063. Hum Reprod. 2023. PMID: 37015098 Free PMC article. Review.
-
Key glycometabolism during oocyte maturation and early embryonic development.Reproduction. 2025 Feb 4;169(3):e240275. doi: 10.1530/REP-24-0275. Print 2025 Mar 1. Reproduction. 2025. PMID: 39846956 Free PMC article. Review.
-
Viewing early life without labels: optical approaches for imaging the early embryo†.Biol Reprod. 2024 Jun 12;110(6):1157-1174. doi: 10.1093/biolre/ioae062. Biol Reprod. 2024. PMID: 38647415 Free PMC article. Review.
References
-
- Richani D, Dunning KR, Thompson JG, Gilchrist RB. Metabolic co-dependence of the oocyte and cumulus cells: essential role in determining oocyte developmental competence. Hum Reprod Update 2021; 27:27–47. - PubMed
-
- Coticchio G, Sereni E, Serrao L, Mazzone S, Iadarola I, Borini A. What criteria for the definition of oocyte quality? Ann N Y Acad Sci 2004; 1034:132–144. - PubMed
-
- Wang Q, Sun QY. Evaluation of oocyte quality: morphological, cellular and molecular predictors. Reprod Fertil Dev 2007; 19:1–12. - PubMed
-
- Wong KM, Repping S, Mastenbroek S. Limitations of embryo selection methods. Semin Reprod Med 2014; 32:127–133. - PubMed
