. 2022 Jul;10(7):e004579.
doi: 10.1136/jitc-2022-004579.

Intrahepatic CD69+Vδ1 T cells re-circulate in the blood of patients with metastatic colorectal cancer and limit tumor progression

Affiliations

Intrahepatic CD69+Vδ1 T cells re-circulate in the blood of patients with metastatic colorectal cancer and limit tumor progression

Elena Bruni et al. J Immunother Cancer. 2022 Jul.

Abstract

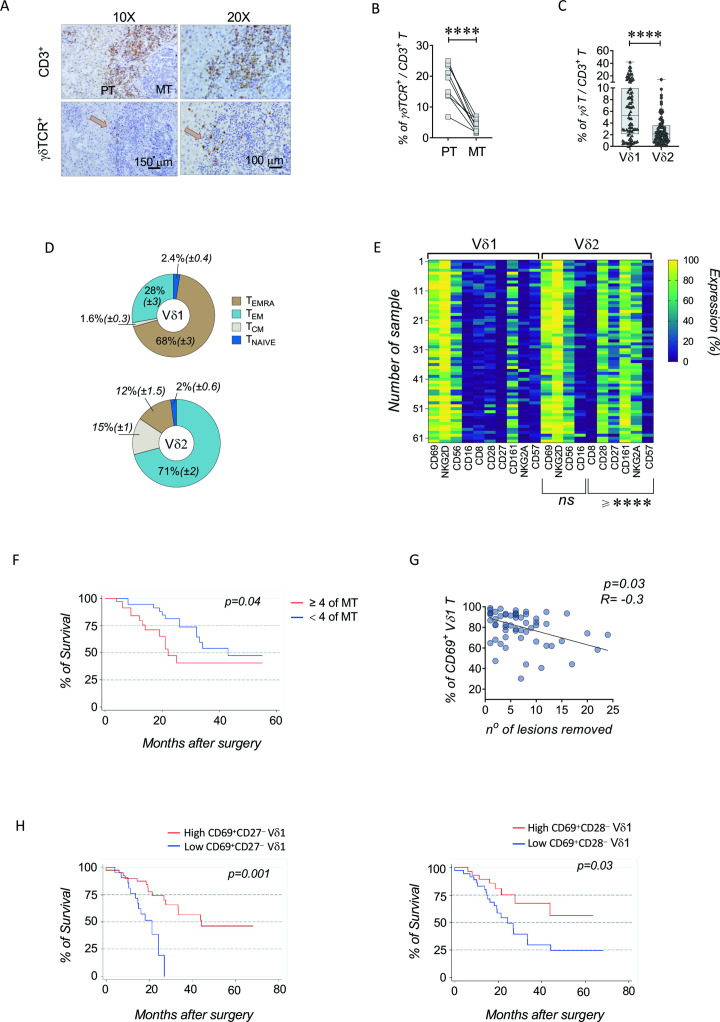
Background: More than 50% of all patients with colorectal cancer (CRC) develop liver metastases (CLM), a clinical condition characterized by poor prognosis and lack of reliable prognostic markers. Vδ1 cells are a subset of tissue-resident gamma delta (γδ) T lymphocytes endowed with a broad array of antitumor functions and showing a natural high tropism for the liver. However, little is known about their impact in the clinical outcomes of CLM.

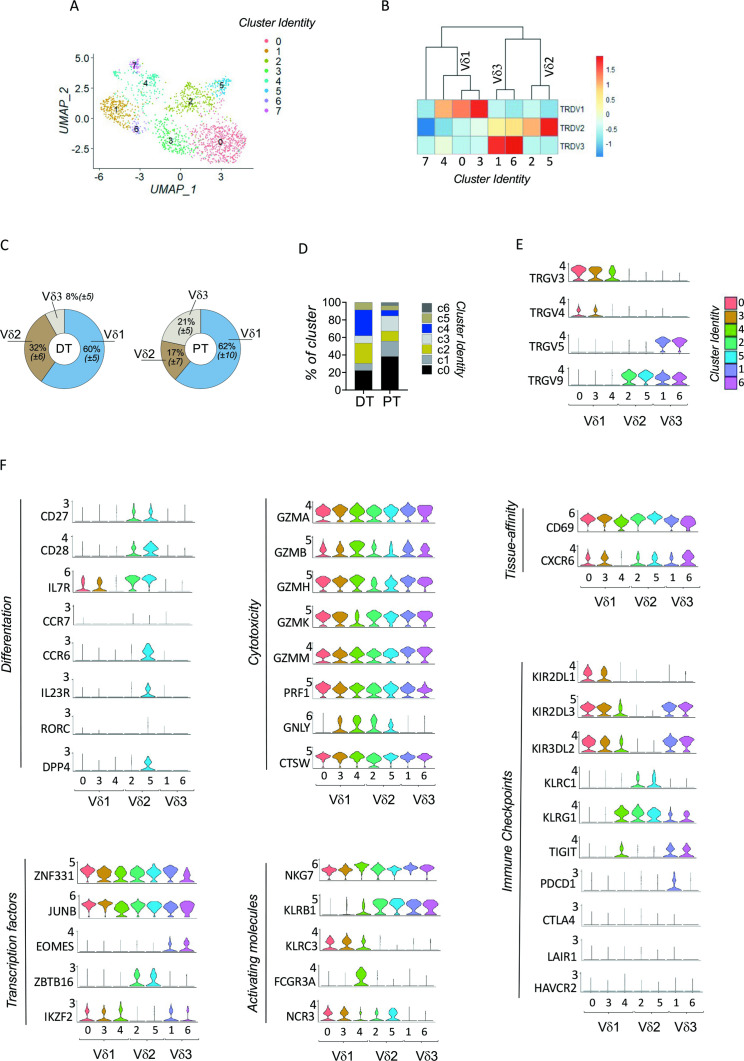
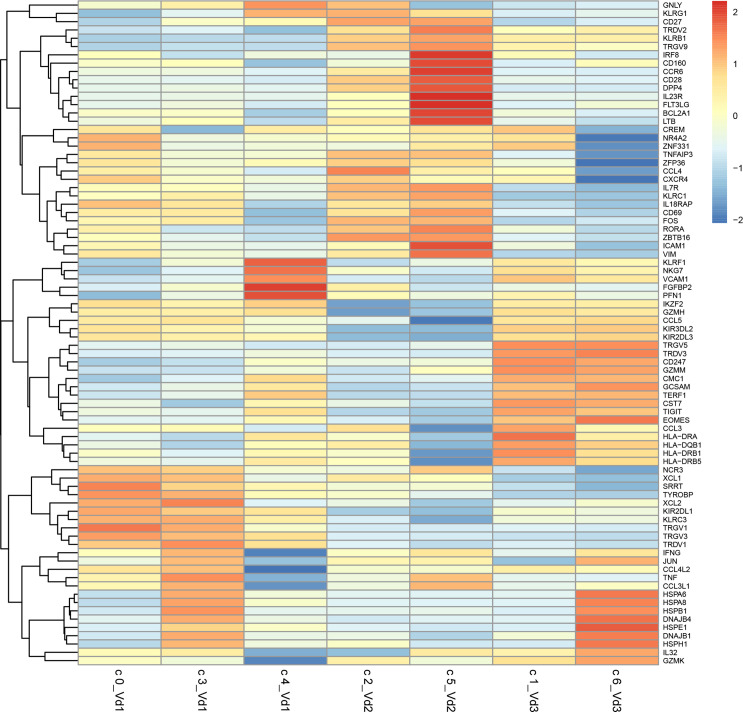
Methods: We isolated human γδ T cells from peripheral blood (PB) and peritumoral (PT) tissue of 93 patients undergone surgical procedures to remove CLM. The phenotype of freshly purified γδ T cells was assessed by multiparametric flow cytometry, the transcriptional profiles by single cell RNA-sequencing, the functional annotations by Gene Ontology enrichment analyses and the clonotype by γδ T cell receptor (TCR)-sequencing.

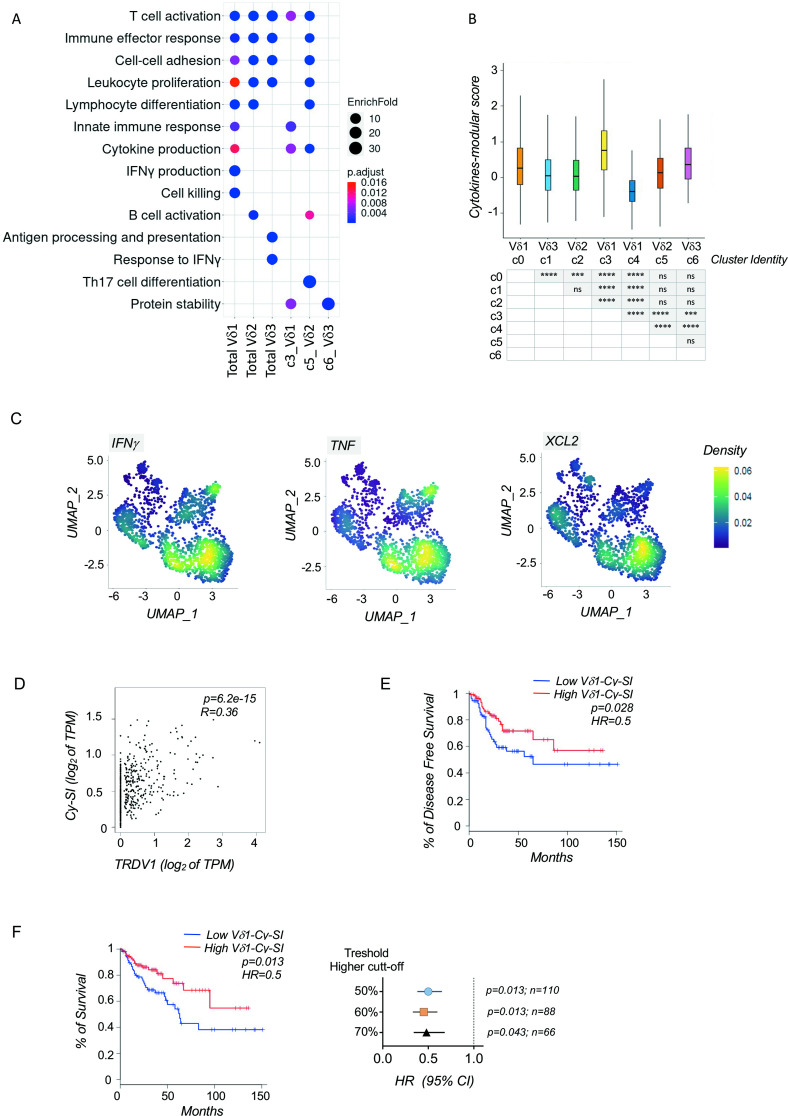
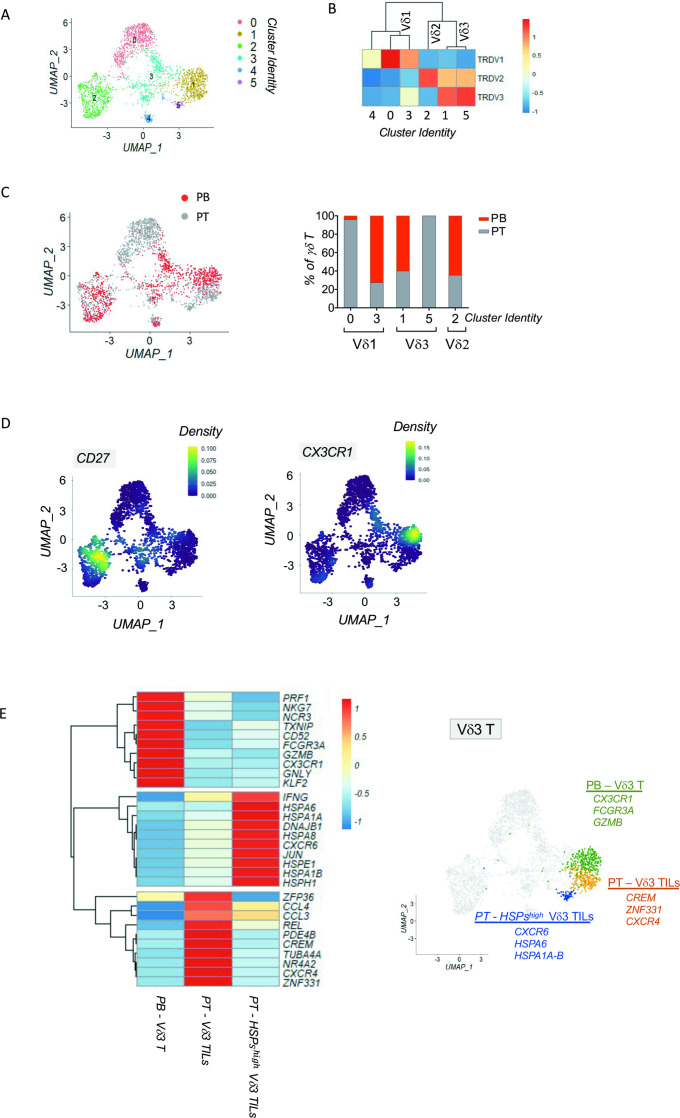
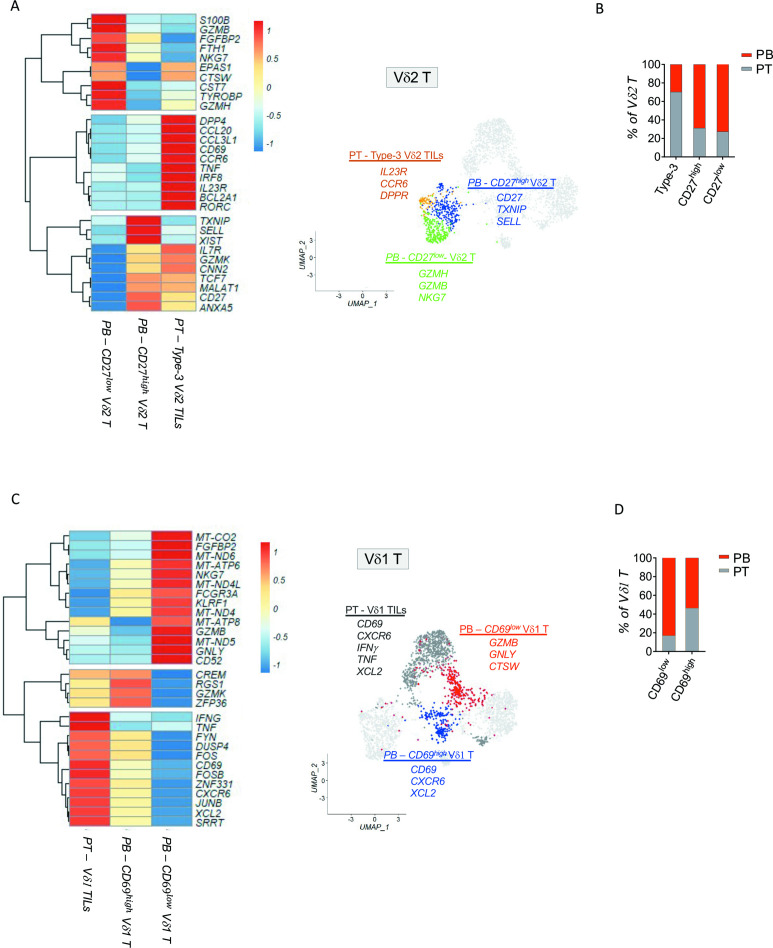
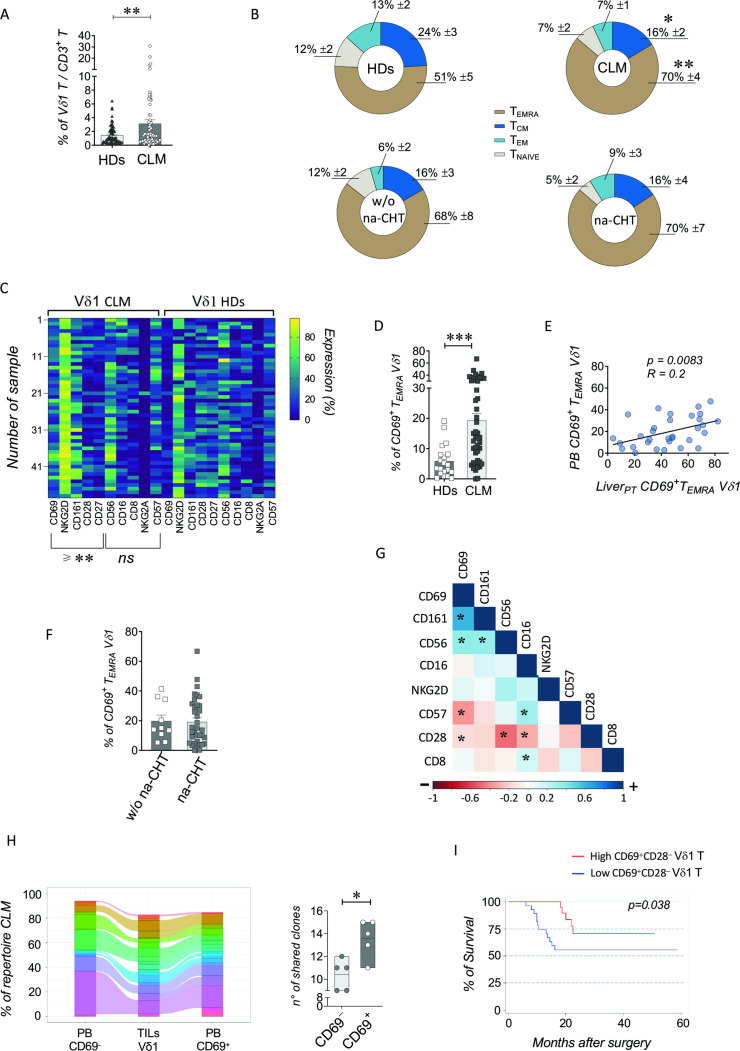
Results: The microenvironment of CLM is characterized by a heterogeneous immune infiltrate comprising different subsets of γδ tumor-infiltrating lymphocytes (TILs) able to egress the liver and re-circulate in PB. Vδ1 T cells represent the largest population of γδ TILs within the PT compartment of CLM that is greatly enriched in Vδ1 T effector (TEF) cells expressing constitutive high levels of CD69. These Vδ1 CD69+ TILs express a distinct phenotype and transcriptional signature, show high antitumor potential and correlate with better patient clinical outcomes in terms of lower numbers of liver metastatic lesions and longer overall survival (OS). Moreover, intrahepatic CD69+ Vδ1 TILs can egress CLM tissue to re-circulate in PB, where they retain a phenotype, transcriptional signature and TCR clonal repertoires resembling their liver origin. Importantly, even the increased frequencies of the CD69+ terminally differentiated (TEMRA) Vδ1 cells in PB of patients with CLM significantly correlate with longer OS. The positive prognostic score of high frequencies of CD69+ TEMRA Vδ1 cells in PB is independent from the neoadjuvant chemotherapy and immunotherapy regimens administered to patients with CLM prior surgery.

Conclusions: The enrichment of tissue-resident CD69+ Vδ1 TEMRA cells re-circulating at high frequencies in PB of patients with CLM limits tumor progression and represents a new important clinical tool to either predict the natural history of CLM or develop alternative therapeutic protocols of cellular therapies.

Keywords: T-lymphocytes; immunity, cellular; immunologic surveillance; liver neoplasms; lymphocytes, tumor-infiltrating.


Conflict of interest statement

Competing interests: None declared.

Figures

Figure 1
Figure 1
Cellular characterization and clinical impact of intrahepatic gamma delta (γδ) tumor-infiltrating lymphocytes (TILs) in colon liver metastatic cancer (CLM). (A) Representative immunohistochemistry (IHC) images showing CD3+ (upper panels) and γδ T cell receptor (TCR)+ (lower panels) T cells within peritumoral tissue (PT) and metastatic tumor (MT) from one CLM liver section (out of 10) at 10× (left panel) and 20× (right panel) magnified views. Arrows indicate γδ TCR+ cells in lower panels. (B) Statistical graph from IHC data showing the mean frequency (%) of γδ TCR+ TILs among CD3+ T cells in PT and MT areas (n=10). (C) Statistical graph from multiparametric flow cytometry data showing the mean (±SEM) frequency (%) of matched Vδ1 and Vδ2 T cells among CD3+ T cells in PT (n=82). (D) Pie charts of multiparametric flow cytometry data showing the mean distribution (%) of naïve T (TNAIVE), T central memory (TCM), T effector memory (TEM) and terminally differentiated (TEMRA) Vδ1 (upper chart) and Vδ2 (lower chart) T cells within PT (n=62). (E) Heatmaps of multiparametric flow cytometry data showing the expression of several surface markers between matched Vδ1 (left panel) and Vδ2 (right panel) TILs from PT (n=62). Group of markers which statistically differ between Vδ1 and Vδ2 TILs are annotated under the heatmap as ‘≥****’ and indicates the range of significant p values; ‘ns’ indicates a group of markers not statistically significant. (F) Kaplan-Meier curve of postsurgical overall survival (OS; %) of patients with CLM based on the number of liver metastases (MT, cut-off ≥4; n=60). (G) Spearman’s rank correlation between the frequency (%) of liver PT CD69+ Vδ1 T cells and the number of surgically removed liver metastasis (n=60). (H) Kaplan-Meier curves showing postsurgical OS (%) of patients with CLM based on the median frequencies (%) of CD69+CD27 (cut-off ≤2%; left panel) and CD69+CD28 liver Vδ1 T cells in PT (cut-off ≤5%; right panel) (n=63) Statistically significant p values are represented with the following number of asterisks (*): *p ≤ 0.05; ***p ≤ 0.001; ****p ≤ 0.0001.
Figure 2
Figure 2
Single cell RNA-sequencing of gamma delta (γδ) tumor-infiltrating lymphocytes (TILs) in colon liver metastatic cancer (CLM). (A) Uniform manifold approximation and projection (UMAP) projection of γδ T cells from peritumor (PT) (n=1333) and distal tumor-free (DT) (n=424) compartments of CLM from three patients underwent surgical liver resection. UMAP graph identifies eight specific clusters (left panel) and their distribution among DT (orange cells) and PT (light blue cells) compartments of CLM (right panel). (B) Heatmap showing the average of T cell receptor (TCR) δ chain expression within the eight γδ T cell clusters identified by UMAP analysis. The expression values are zero-centered and scaled for each gene. (C) Pie charts showing the relative enrichment of Vδ1, Vδ2 and Vδ3 T cells (%) among DT (left panel) and PT (right panel) compartments of CLMs. (D) Bar plot graph showing the distribution (%) of γδ T cell clusters among DT and PT compartments of CLM within the eight clusters identified from UMAP analysis. The proportion of γδ T cells for each cluster across the DT and PT compartments were calculated as ratio between number of cells in each cluster and total number of cells in DT and PT, respectively. (E) Violin plot graph showing the expression of TRGV genes among the seven γδ T cell clusters grouped according to their Vδ1, Vδ2 and Vδ3 T cell origin. (F) Violin plot graphs of selected genes among all γδ T cell clusters grouped according to their Vδ1, Vδ2 and Vδ3 T cell origin. Each graph shows genes associated with cell differentiation status, transcription factors, tissue-affinity, cytotoxicity, inhibitory and activating molecules.
Figure 3
Figure 3
Differentially expressed genes among gamma delta (γδ) tumor-infiltrating lymphocyte (TIL) clusters in colon liver metastatic cancer (CLM). Heatmap showing the values of 238 differentially expressed genes (DEGs) (adjusted p<0.05) coming from pairwise comparison between cluster 0 (c0) against each identified γδ T cluster. Expression values are zero-centered and scaled for each gene.
Figure 4
Figure 4
Functional annotations of gamma delta (γδ) tumor-infiltrating lymphocytes (TILs) in colon liver metastatic cancer (CLM). (A) Statistical dot plot graph showing the biological processes (BO) obtained by Gene Ontology (GO) enrichment analysis calculated for total Vδ1, Vδ2, Vδ3 TILs and for the clusters c3 of Vδ1, c5 of Vδ2 and c6 of Vδ3 TIL subsets. GO enrichment analyses are performed by using differentially expressed genes (DEGs) with adjusted p≤0.05 and log-foldchange >0. Only enriched GO terms with adjusted p≤0.05 and more than five genes are reported. (B) Statistical bar plot graph showing interferon-gamma (IFN-γ), tumor necrosis factor (TNF) and X-C motif chemokine ligand 2 (XCL2) cytokine modular score calculated for each γδ T cell clusters. (C) Uniform manifold approximation and projection (UMAP) density plot graphs showing IFN-γ, TNF and XCL2 gene density distribution among γδ TIL cell clusters. (D) Scatter dot plot distribution with Pearson’s correlation between TRDV1 and Vδ1-Cy-SI expression in The Cancer Genome Atlas (TCGA) and The Genotype-Tissue Expression (GTEx) cohorts of patients with CRC calculated by Gene Expression Profiling Interactive Analysis 2 (GEPIA2). (E) Kaplan-Meier curve showing postoperative disease-free survival (%) ranking in TCGA cohorts of low-frequency microsatellite instability (MSI-L) and microsatellite stability (MSS) patients with CLM stratified by the low (blue curve) or high (red curve) Vδ1-Cy-SI expression (HR 0.5; median high cut-off 50%–50%; n=110). (F) Kaplan-Meier curve (left panel) showing the OS (%) in TCGA cohorts of MSI-L and MSS patients with CLM stratified by the low (blue curve) or high (red curve) Vδ1-Cy-SI ranking (HR 0.5; median 50%–50% high cut-off; n=110). Forest plots (right panel) showing HR with 95% CI, p value (p) and number (n) of patients obtained for different high Vδ1-Cy-SI cut-off values in TCGA cohorts of MSI-L and MSS patients with CRC (n=110). Dashed line at HR=1 indicates the numerical distance from no survival benefit. The cox proportional HR of the Vδ1-Cy-SI high and low-expression cohort was calculated by GEPIA2, while 95% CI was calculated as ‘exp [ln(HR)±z×SE], with SE’. Statistically significant p values are represented with the following number of asterisks (*): *p ≤ 0.05; ***p ≤ 0.001; ****p ≤ 0.0001; ns, not statistically significant.
Figure 5
Figure 5
Single cell RNA-sequencing (scRNA-seq) integrated analysis comparing the distribution of circulating and tumor-infiltrating gamma delta (γδ) T cells and transcriptional profiles of Vδ3 T cells from patients with colon liver metastatic cancer (CLM). (A) Uniform manifold approximation and projection (UMAP) graph showing the γδ T clusters from cells purified from matched peritumoral (PT) and peripheral blood (PB) samples of three patients with CLM undergoing surgical resection of tumors. (B) Heatmap showing the average of T cell receptor (TCR) δ chain expression along the six identified γδ T cell clusters showed in panel A. (C) UMAP graph (left panel) and bar plot graph (right panel) showing the distribution (%) of the γδ T cell clusters within PT (gray) and PB (red) anatomic compartments. (D) UMAP density plot graphs showing CD27 and CX3CR1 gene density distribution among γδ T cell clusters. (E) Heatmap showing the top 30 differently expressed genes (DEGs) (adjusted p<0.05) between PB and PT Vδ3 T cells in patients with CLM (left panel). Representative UMAP graph showing the distinct molecular signatures of PB and PT Vδ3 T cells (right panel).
Figure 6
Figure 6
Single cell RNA-sequencing (scRNA-seq) integrated analysis comparing the transcriptional profiles of circulating and tumor infiltrating Vδ1 and Vδ2 T cells from patients with colon liver metastatic cancer (CLM). (A) Heatmap showing the top 30 differently expressed genes (DEGs) (adjusted p<0.05) between peripheral blood (PB) and peritumoral (PT) Vδ2 T cells from patients with CLM (left panel). Representative uniform manifold approximation and projection (UMAP) graph showing the distinct molecular signatures of PT-enriched type 3, PB CD27high and CD27low Vδ2 T cells (right panel). (B) Bar plot graph showing the distribution (%) of type 3, CD27high and CD27low Vδ2 T cells in PB (red) and PT (gray) anatomic compartments from patients with CLM. (C) Heatmap showing the top 30 DEGs (adjusted p<0.05) between PT and PB Vδ1 T cells from patients with CLM (left panel). Representative UMAP graph showing the distinct molecular signatures of the PT and PB CD69high and CD69low Vδ1 T cells subsets in patients with CLM (right panel). (D) Bar plot graph showing the distribution (%) of the CD69high and CD69low Vδ1 T cells in PB (red) and PT (gray) anatomic compartments from patients with CLM.
Figure 7
Figure 7
Identification of intrahepatic Vδ1 tumor-infiltrating lymphocytes (TILs) egressing tumor and re-circulating in peripheral blood (PB) of patients with colon liver metastatic cancer (CLM). (A) Statistical bar graph showing the mean (±SEM) frequency (%) of PB Vδ1 T cells among CD3+ T lymphocytes in health donors (HDs) (n=66) and patients with CLM (n=75). (B) Pie charts showing the mean frequency distribution (%) of PB naïve T (TNAIVE), T central memory (TCM), T effector memory (TEM) and terminally differentiated (TEMRA) Vδ1 T cells in HDs (n=33) and in patients with CLM (n=50) (upper panel) either in the absence (n=13) (lower left) or in the presence (n=38) (lower right) of neoadjuvant conventional/biological chemotherapies (na-CHT) (lower panel). (C) Heatmaps of multiparametric flow cytometry data showing the expression of several surface markers between PB Vδ1 T cells isolated from patients with CLM (left) and HDs (n=49) (right). Group of markers which statistically differ between two groups are annotated under the heatmap as ‘‘≥** and indicates the range of significant p values; ‘ns’ indicates a group of markers not statistically significant. (D) Statistical bar graph showing the mean (±SEM) frequency (%) of PB CD69+ TEMRA Vδ1 cell subset in HDs (n=22) and patients with CLM (n=45). (E) Pearson’s correlation of flow cytometry percentages (%) between matched PB CD69+ TEMRA and PT CD69+ TEMRA Vδ1 TILs (n=45). (F) Statistical bar graph showing the mean (±SEM) frequency (%) of PB CD69+ TEMRA Vδ1 cells from patients with CLM either in the absence (n=11) or in the presence (n=45) of na-CHT. (G) Heatmap of flow cytometry data showing Spearman’s rank between the mean of different cell markers expression (%) in PB Vδ1 T cells from patients with CLM (n=49). (H) Overlap analysis of T cell receptor (TCR) repertoires from FACS-sorted PB CD69+ and CD69 and liver PT Vδ1 T cells in patients with CLM (n=5). Shared top 20 TRG clones of one representative patient with CLM are represented as colored bands between columns (left panel) and included in the summary statistic (right plot). (I) Kaplan-Meier curve showing postoperative OS (%) of patients with CLM stratified on the basis of the median frequency (%) of the PB CD69+CD28 Vδ1 T cells in patients with CLM (cut-off ≤10%; n=53). Statistically significant p values are represented with the following number of asterisks (*): *p ≤ 0.05; **p ≤ 0.01; ***p ≤ 0.001; ns, not statistically significant.

Similar articles

Cited by

References

    1. Chow FC-L, Chok KS-H. Colorectal liver metastases: an update on multidisciplinary approach. World J Hepatol 2019;11:150–72. 10.4254/wjh.v11.i2.150 - DOI - PMC - PubMed
    1. Fehlings M, Jhunjhunwala S, Kowanetz M, et al. . Late-differentiated effector neoantigen-specific CD8+ T cells are enriched in peripheral blood of non-small cell lung carcinoma patients responding to atezolizumab treatment. J Immunother Cancer 2019;7:249. 10.1186/s40425-019-0695-9 - DOI - PMC - PubMed
    1. Wang L, Simons DL, Lu X, et al. . Connecting blood and intratumoral Treg cell activity in predicting future relapse in breast cancer. Nat Immunol 2019;20:1220–30. 10.1038/s41590-019-0429-7 - DOI - PMC - PubMed
    1. De Biasi S, Gibellini L, Lo Tartaro D, et al. . Circulating mucosal-associated invariant T cells identify patients responding to anti-PD-1 therapy. Nat Commun 2021;12:1669. 10.1038/s41467-021-21928-4 - DOI - PMC - PubMed
    1. Fairfax BP, Taylor CA, Watson RA, et al. . Peripheral CD8+ T cell characteristics associated with durable responses to immune checkpoint blockade in patients with metastatic melanoma. Nat Med 2020;26:193–9. 10.1038/s41591-019-0734-6 - DOI - PMC - PubMed

Publication types

MeSH terms

Substances