. 2022 Jul;10(7):e004695.
doi: 10.1136/jitc-2022-004695.

Therapeutic targeting of PD-1/PD-L1 blockade by novel small-molecule inhibitors recruits cytotoxic T cells into solid tumor microenvironment

Affiliations

Therapeutic targeting of PD-1/PD-L1 blockade by novel small-molecule inhibitors recruits cytotoxic T cells into solid tumor microenvironment

Rita C Acúrcio et al. J Immunother Cancer. 2022 Jul.

Abstract

Background: Inhibiting programmed cell death protein 1 (PD-1) or PD-ligand 1 (PD-L1) has shown exciting clinical outcomes in diverse human cancers. So far, only monoclonal antibodies are approved as PD-1/PD-L1 inhibitors. While significant clinical outcomes are observed on patients who respond to these therapeutics, a large proportion of the patients do not benefit from the currently available immune checkpoint inhibitors, which strongly emphasize the importance of developing new immunotherapeutic agents.

Methods: In this study, we followed a transdisciplinary approach to discover novel small molecules that can modulate PD-1/PD-L1 interaction. To that end, we employed in silico analyses combined with in vitro, ex vivo, and in vivo experimental studies to assess the ability of novel compounds to modulate PD-1/PD-L1 interaction and enhance T-cell function.

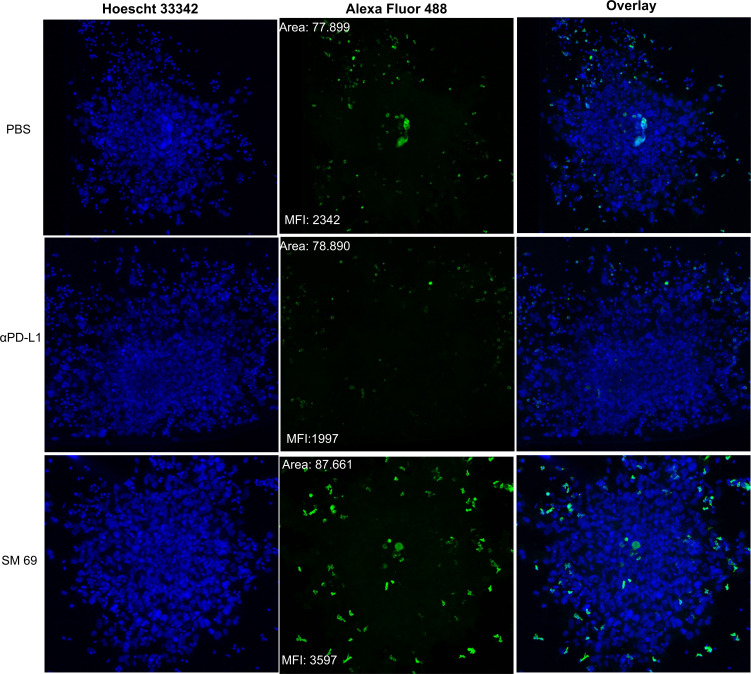
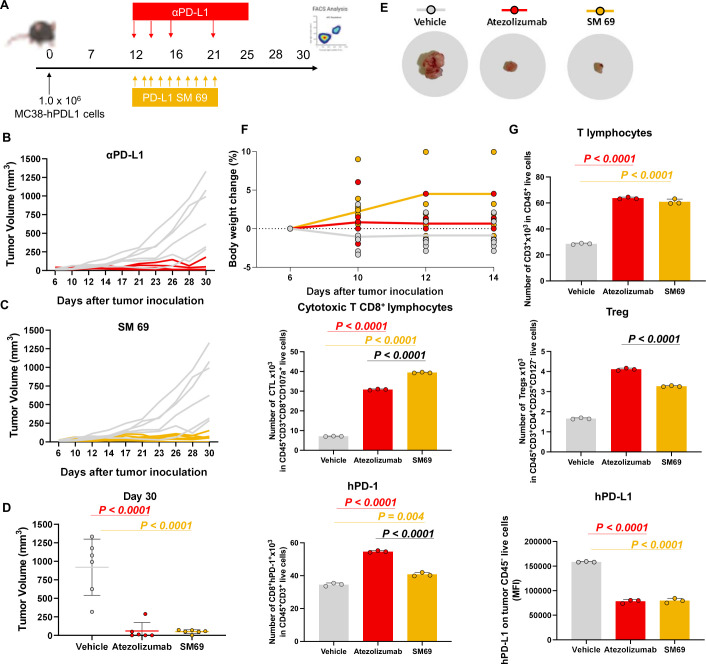
Results: Accordingly, in this study we report the identification of novel small molecules, which like anti-PD-L1/PD-1 antibodies, can stimulate human adaptive immune responses. Unlike these biological compounds, our newly-identified small molecules enabled an extensive infiltration of T lymphocytes into three-dimensional solid tumor models, and the recruitment of cytotoxic T lymphocytes to the tumor microenvironment in vivo, unveiling a unique potential to transform cancer immunotherapy.

Conclusions: We identified a new promising family of small-molecule candidates that regulate the PD-L1/PD-1 signaling pathway, promoting an extensive infiltration of effector CD8 T cells to the tumor microenvironment.

Keywords: IMMUNOLOGY; Lymphocyte Activation; Lymphocytes, Tumor-Infiltrating; Programmed Cell Death 1 Receptor; Tumor Escape.


Conflict of interest statement

Competing interests: RS-F is a Board Director at Teva Pharmaceutical Industries. All other authors declare that they have no competing interests.

Figures

Figure 1
Figure 1
In silico virtual screening for putative PD-1/PD-L1 inhibitors. (A) Ribbon representation of PD-L1 monomers (gray) bridged by small-molecule inhibitor BMS202 (yellow) (PDB 5J89). Close-up view of the binding pocket. Receptor-ligand interactions are displayed in dashes. Hydrophobic contacts (yellow), π-staking (green) and H-bond and salt bridges (red). (B) Structure-based virtual screening for the identification of PD-1/PD-L1 small-molecule inhibitors, beginning with pre-filtering the compounds based on molecular weight (MW), followed by the screening in silico using the scoring function GoldScore of the GOLD software, followed by the visual inspection of the top-ranked compounds within the binding pocket. Finally, the compounds were uploaded into the FAF-Drugs predictor to address the administration, distribution, metabolism, excretion, and toxicity (ADMET) properties. (C) In total, 95 chemically diverse virtual hits were selected to move forward. GOLD, Genetic Optimization for Ligand Docking; PD-1, programmed cell death protein 1; PD-L1, PD-ligand 1; vs, virtual screening
Figure 2
Figure 2
Hit compounds inhibit PD-1/PD-L1 interaction. (A) Among the 95 compounds tested for PD-1/PD-L1 inhibition using homogeneous time-resolved fluorescence (HTRF) at 100 µM, 16 compounds were confirmed hits (blue—1 and 73; black—5, 29, 18, 75 and 84; green—45, 41 and 71; yellow—69 and 47, and white—30, 32, 35 and 38). BMS202 (dark gray) was used as positive control for inhibiting the PD-1/PD-L1 interaction. Results were normalized (0%–100%) considering PD-1/PD-L1 interaction (light gray) the 100%. Data are presented as mean±SD, N=3, n=9, from three independent experiments performed in triplicate. (B) Dose-response curves determined by HTRF. Serial dilution of compounds (eight doses 1:2 and 1:10) starting from 100 µM. BMS202 (dark gray) was used as positive control for PD-1/PD-L1 inhibition. Among the 16 compounds, 4 (white—30, 32, 35 and 38) were considered false positives, since no dose-response effect was achieved. IC50 values were determined for each compound: 1 (IC50 186 nM), 5 (IC50 2.44 µM), 18 (IC50 190 nM), 29 (IC50 4 nM), 42 (IC50 57 nM), 45 (IC50 596 nM), 47 (IC50 149 nM), 69(IC50 96 nM), 71(IC50 380 nM), 73(IC50 149 nM), 75(IC50 1.55 µM), 84 (IC50 1.09 µM), and BMS202 (IC50 57 nM). Data are presented as mean±SD, N=3, n=9, from three independent experiments performed in triplicate. PD-1, programmed cell death protein 1; PD-L1, PD-ligand 1.
Figure 3
Figure 3
Small-molecule inhibitors bind to PD-L1 with no impact on cell viability. (A) Thermal shifts indicate the stabilization of PD-L1 by compounds 5 (black), 42 (green), 47 (yellow), 69 (yellow), 75 (black) and 84 (black). Curves represent the fraction of unfolded recombinant human PD-L1 protein, where 0 represents the folded PD-L1 and 1 the unfolded, in the presence of 1% DMSO (light gray), indicated compounds (green, yellow and black) and BMS202 (dark gray) at 100 µM. (B) Different cell lines were incubated with increased concentrations of compounds for 48 hours. Cell viability was normalized to untreated cells. All cell lines, MDA-MB-231 (ATCC# HTB-26), A375 (ATCC# CRL. 1619), and HMEC (ATCC# CRL-3243) showed tolerance to the compounds. Three different concentrations 100 µM (blue), 10 µM (green) and 1 µM (gray) were tested. Data are presented as mean±SD, N=3 and N=1, n=9 or n=3 from three or one independent experiment(s) performed in triplicate. (C–D) Compounds inhibit PD-1/PD-L1 interaction on melanoma and breast cancer cell lines. (C) MDA-MB-231 breast cancer cells (gray) or (D) A375 melanoma cells (gray) were treated with 10 µM of compounds (green, yellow and black), BMS202 (dark gray) and anti-PD-L1 (αPD-L1) (red) for 72 hours. A375 cells were stimulated with 200 ng.mL−1 interferon-ɣ (gray) for 18 hours before treatments to enhance PD-L1 levels. The remaining % of accessible PD-L1 was determined in live cells by flow cytometry. Data are presented as mean±SD, N=3, n=9, or N=1, n=3, from three or one independent experiments performed in triplicate. Statistical analysis: one-way analysis of variance and Tukey’s post test. PD-L1, programmed cell death ligand 1. ATCC, American Type Culture Collection.
Figure 4
Figure 4
Induction of T-cell activation by PD-1/PD-L1 inhibition using co-culture experiments. (A) Experimental workflow. Tumor cells were obtained from surgical resections of melanoma (Mel), bone metastases of breast (BBM) and lung cancer (LBM). The tumor cells were stimulated with IFN-γ for 18 hours prior to co-culture to enhance the PD-L1 expression. The PBMC and tumor cells were co-cultured and treated with anti-CD28 (blue) or treated with anti-CD28 plus PD-L1 inhibitors (small-molecule inhibitor 69 (yellow) and anti-PD-L1 (red)) for 72 hours. The PD-1/PD-L1 inhibition and T-cell activation were assessed using flow cytometry. (B) Cell-surface PD-L1 levels were determined by flow cytometry. Data indicate mean fluorescence intensity (MFI) of anti-PD-L1-BV711 minus MFI of isotype control. (C) Cell-surface PD-1 levels were determined by flow cytometry. (D) Representative flow cytometry plots for T cell reactivity after 72 hours of co-culture with autologous tumor cells. The plots indicate the percentage of IFN-γ and CD107a on CD8+ T cells. Quantification of tumor cells-induced IFN-γ (E) production and CD107a (F) cell-surface expression of CD45+CD3+CD8+ T cells was obtained after 72 hours of co-culture. Data are presented as mean±SD, N=1, n=3 or 2, from one independent experiment performed in triplicate or duplicate (limited amounts of tumor or blood available). Statistical analysis: one-way analysis of variance and Tukey’s post test. FACS, fluorescence-activated cell sorting; IFN, interferon; IL, interleukin; PBMC, peripheral blood mononuclear cells; PD-1, programmed cell death protein 1; PD-L1, PD-ligand 1.
Figure 5
Figure 5
CD8+ T-cell infiltration into 3D melanoma spheroids. Co-culture of 3D tumor spheroids of cells obtained from surgical resection of melanoma and peripheral blood mononuclear cell (PBMC). Cells grew together in reduced growth factor Matrigel. The spheres and PBMC were either not treated or treated with anti-PD-L1 (αPD-L1) or small-molecule inhibitor 69. The CD8+ T-cell infiltration (green) was evaluated 72 hours after co-culture by confocal microscopy. Scale bar=100 µm. MFI, mean fluorescence intensity; PBS, phosphate buffered saline; PD-L1, programmed cell death ligand 1; 3D, three-dimensional.
Figure 6
Figure 6
PD-1/PD-L1 small-molecule inhibitor recruits cytotoxic CD8 T cells into the tumor microenvironment. (A) Timeline (days) of tumor inoculation and treatments. (B–C) Tumor growth curve of PD-1 humanized mice implanted with MC38 cell line expressing humanized PD-L1. Animals were treated with small-molecule inhibitor 69 and atezolizumab (10 mg/kg intraperitoneal for 10 daily doses days 12–21 or three times per week days 12–21. N=6 mice. (D) Mice individual tumor volumes (mm3) at endpoint day (Day 30). P values correspond to tumor volume at day 30 after the tumor inoculation. (E) Representative tumor images of each treatment group (vehicle, atezolizumab, SM 69). (F) Mice individual body weight change, expressed as per cent change from the day 1 of treatment. N=6 mice per group. (G) Tumor-infiltrating lymphocytes, regulatory T cells (Treg), and PD-1/PD-L1 quantification. Tumors cells were isolated on day 30 after the tumor inoculation. The quantification was performed by flow cytometry. Data are presented as mean±SD, N=3 mice. Statistical analysis: one-way analysis of variance and Tukey’s post test. FACS, fluorescence-activated cell sorting; PD-1, programmed cell death protein 1; PD-L1, PD ligand 1; SM 69, small-molecule inhibitor 69.

Similar articles

Cited by

References

    1. Pardoll DM. The blockade of immune checkpoints in cancer immunotherapy. Nat Rev Cancer 2012;12:252–64. 10.1038/nrc3239 - DOI - PMC - PubMed
    1. Topalian SL, Drake CG, Pardoll DM. Immune checkpoint blockade: a common denominator approach to cancer therapy. Cancer Cell 2015;27:450–61. 10.1016/j.ccell.2015.03.001 - DOI - PMC - PubMed
    1. Kamphorst AO, Ahmed R. Manipulating the PD-1 pathway to improve immunity. Curr Opin Immunol 2013;25:381–8. 10.1016/j.coi.2013.03.003 - DOI - PMC - PubMed
    1. Pauken KE, Wherry EJ. Overcoming T cell exhaustion in infection and cancer. Trends Immunol 2015;36:265–76. 10.1016/j.it.2015.02.008 - DOI - PMC - PubMed
    1. Wei SC, Levine JH, Cogdill AP, et al. . Distinct cellular mechanisms underlie anti-CTLA-4 and anti-PD-1 checkpoint blockade. Cell 2017;170:1120–33. 10.1016/j.cell.2017.07.024 - DOI - PMC - PubMed

Publication types