. 2022 Jul;10(7):e004892.
doi: 10.1136/jitc-2022-004892.

Multimodule characterization of immune subgroups in intrahepatic cholangiocarcinoma reveals distinct therapeutic vulnerabilities

Affiliations

Multimodule characterization of immune subgroups in intrahepatic cholangiocarcinoma reveals distinct therapeutic vulnerabilities

Jian Lin et al. J Immunother Cancer. 2022 Jul.

Abstract

Background: Immune microenvironment is well recognized as a critical regulator across cancer types, despite its complex roles in different disease conditions. Intrahepatic cholangiocarcinoma (iCCA) is characterized by a tumor-reactive milieu, emphasizing a deep insight into its immunogenomic profile to provide prognostic and therapeutic implications.

Methods: We performed genomic, transcriptomic, and proteomic characterization of 255 paired iCCA and adjacent liver tissues. We validated our findings through H&E staining (n=177), multiplex immunostaining (n=188), single-cell RNA sequencing (scRNA-seq) (n=10), in vitro functional studies, and in vivo transposon-based mouse models.

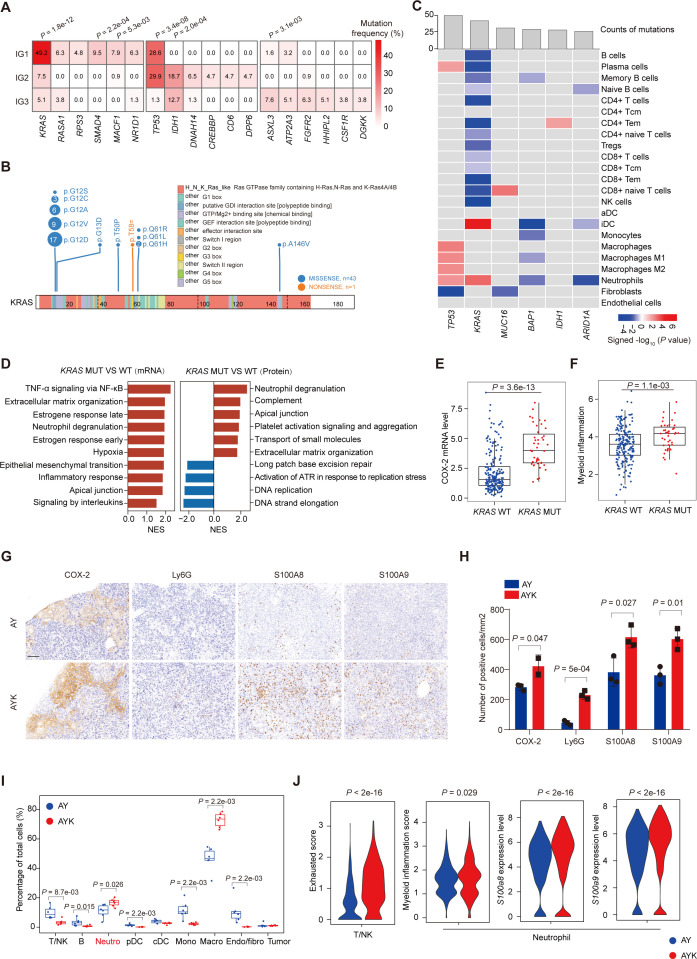
Results: Integrated multimodule data identified three immune subgroups with distinct clinical, genetic, and molecular features, designated as IG1 (immune-suppressive, 25.1%), IG2 (immune-exclusion, 42.7%), and IG3 (immune-activated, 32.2%). IG1 was characterized by excessive infiltration of neutrophils and immature dendritic cells (DCs). The hallmark of IG2 was the relatively higher tumor-proliferative activity and tumor purity. IG3 exhibited an enrichment of adaptive immune cells, natural killer cells, and activated DCs. These immune subgroups were significantly associated with prognosis and validated in two independent cohorts. Tumors with KRAS mutations were enriched in IG1 and associated with myeloid inflammation-dominated immunosuppression. Although tumor mutation burden was relatively higher in IG2, loss of heterozygosity in human leucocyte antigen and defects in antigen presentation undermined the recognition of neoantigens, contributing to immune-exclusion behavior. Pathological analysis confirmed that tumor-infiltrating lymphocytes and tertiary lymphoid structures were both predominant in IG3. Hepatitis B virus (HBV)-related samples tended to be under-represented in IG1, and scRNA-seq analyses implied that HBV infection indeed alleviated myeloid inflammation and reinvigorated antitumor immunity.

Conclusions: Our study elucidates that the immunogenomic traits of iCCA are intrinsically heterogeneous among patients, posing great challenge and opportunity for the application of personalized immunotherapy.

Keywords: cytotoxicity, immunologic; drug therapy, combination; tumor microenvironment.


Conflict of interest statement

Competing interests: None declared.

Figures

Figure 1
Figure 1
Immune-centered classification of intrahepatic cholangiocarcinoma (iCCA). (A) Unsupervised hierarchical clustering of the Fudan University (FU)-iCCA (n=255) cohort based on the 170 genes. The enriched pathways in IG1 and IG3 were shown on the right (χ2 test and adjusted analysis of variance (ANOVA)). (B) Kaplan-Meier curves for overall survival (upper panel) and recurrence-free survival (bottom panel) among the three immune subgroups (log-rank test). (C) HR and p values of immune subgroups and covariates in multivariate analysis for overall survival. (D) The relative abundance of tumor microenvironment (TME) subsets identified from xCell (Fisher’s exact test or ANOVA). (E) Univariate analysis for overall survival of each cell subset. (F) Pathological tumor-infiltrating lymphocyte (TIL) estimates (n=177) plotted for each tumor sample against indicated signatures. (G) Representative immunostaining images showing the indicated immune subsets. (H) Quantification of staining intensities for the indicated immune markers (n=188, ANOVA).
Figure 2
Figure 2
Distinct molecular features among the three immune subgroups. (A) Altered pathways at transcriptome and proteome levels among the three immune subgroups. (B) Heatmaps depicting mRNA and protein levels of various markers involved in cancer-promoting or cancer-inhibitory inflammation (adjusted analysis of variance (ANOVA)). (C) Heatmaps depicting mRNA and protein levels of S100A family members (adjusted ANOVA). (D) Signature scores among the three immune subgroups (adjusted ANOVA). (E) Comparisons of COX-2 mRNA levels among the three immune subgroups (Wilcoxon rank-sum test). (F) Kaplan-Meier curves for overall survival based on mRNA abundance of COX-2 (log-rank test). (G and H) Pearson correlation coefficient of COX-2 mRNA level with COX-2-associated inflammatory signature (COX-IS) genes (G) and the xCell enrichment scores of indicated cell subtypes (H).
Figure 3
Figure 3
The association between KRAS mutation and myeloid inflammation. (A) Genes with significant differences in mutational frequency among the three immune subgroups (Fisher’s exact test). (B) Somatic variants along KRAS protein in the Fudan University-intrahepatic cholangiocarcinoma (FU-iCCA) cohort. (C) Association between mutation profiles and immune/stromal signatures from xCell. Only significantly associations were shown (Wilcoxon rank-sum test). (D) Pathway enrichment analysis based on differentially expressed genes (left panel) and proteins (right panel) that associated with KRAS mutations. (E, F) COX-2 mRNA level (E) and myeloid inflammation score (F) in tumor samples with and without KRAS mutation (Wilcoxon rank-sum test). (G, H) Immunohistochemistry of COX-2, Ly6G, S100A8, and S100A9 (G) and quantification of their staining intensities (H). Representative data of triplicate experiments (mean±SEM). Scale bar, 100 µm. (I) Boxplot showing the fractions of indicated tumor microenvironment (TME) composition in AY (n=6) and AYK (n=6) tumors (analysis of variance (ANOVA)). (J) Violin plot showing the exhausted score in T/natural killer (NK) cells (left panel) and myeloid inflammation and s100a8/s100a9 expression in neutrophils (right panel) in AY and AYK samples (ANOVA).
Figure 4
Figure 4
Antigen presentation defects occur frequently in IG2. (A) Antigen presentation machinery (APM) defects in each immune subgroup (Pearson’s χ2 test or Fisher’s exact test). (B, C) Comparison of tumor mutation burden (TMB) (B) and immunoediting score (C) among the three immune subgroups (Wilcoxon rank-sum test). (D) Immunoediting score were plotted by HLA LOH status and immune classification (Wilcoxon rank-sum test). (E, F) Kaplan-Meier curves for overall survival (E) and recurrence-free survival (F) based on loss of heterozygosity in human leukocyte antigen (HLA LOH) status (log-rank test). (G) Model illustrating how HLA LOH may lead to immune escape in IG2.
Figure 5
Figure 5
Tertiary lymphoid structures (TLSs) are enriched in IG3. (A) TLS-associated features in each immune subgroup (adjusted analysis of variance (ANOVA)). (B) Comparison of TLS scores among the three immune subgroups (Wilcoxon rank-sum test). (C) Histological appearance of intratumoral TLSs. (D) Comparison of H&E based intratumoral TLS maturation degrees among the three immune subgroups (Fisher’s exact test). (E) Comparison of TLS scores among H&E-based intratumoral TLS maturation degrees (Wilcoxon rank-sum test). (F–H) Kaplan-Meier curves for overall survival based on TLS score (F), H&E-based intratumoral TLSs (G), and H&E based intratumoral TLS maturation degrees (H) (log-rank test). (I) Diagram showing the multi-omics profiles of regulators of TLS formation and function.
Figure 6
Figure 6
Influences of hepatitis B virus (HBV) infection on the immune microenvironment of intrahepatic cholangiocarcinoma (iCCA). (A) Associations of HBV infection with indicated features (analysis of variance (ANOVA), Pearson’s χ2 test, or Fisher’s exact test). (B) Comparisons of representative signatures in patients with and without HBV infection (Wilcoxon rank-sum test). (C) Subclass mapping with other solid tumors treated with anti-PD-1 mAb (anti-programmed cell death protein 1 monoclonal antibody). (D) The proportion of indicated immune cells in tumor samples. (E) Uniform Manifold Approximation and Projection (UMAP) plot showing the subtypes of T/natural killer (NK) cells. (F) Boxplot showing the fractions of T/NK cells (ANOVA). (G) UMAP plot showing the subtypes of myeloid derived cells. (H) Boxplot showing the fractions of myeloid-derived cells (ANOVA). (I) Violin plot indicating the mRNA levels of COX-2 (upper panel) and proinflammatory scores (bottom panel) in myeloid subgroups. (J, K) Pathway enrichment analysis based on differentially expressed genes that associated with HBV infections in myeloid cells (J), CD4+ T cells, NK cells, and macrophages (K). (L) Kaplan-Meier curves of overall survival based on HBV infection status (log-rank test).
Figure 7
Figure 7
Summary of immunogenomic features of intrahepatic cholangiocarcinoma. Radar charts represented mean Z scores for the molecular features and clinical characteristics describing immune-suppressive, immune-exclusion, and immune-activated subgroups. Therapeutic targets of each subgroup were proposed.

References

    1. Sung H, Ferlay J, Siegel RL, et al. . Global cancer statistics 2020: GLOBOCAN estimates of incidence and mortality worldwide for 36 cancers in 185 countries. CA Cancer J Clin 2021;71:209–49. 10.3322/caac.21660 - DOI - PubMed
    1. Lamarca A, Barriuso J, McNamara MG, et al. . Molecular targeted therapies: Ready for "prime time" in biliary tract cancer. J Hepatol 2020;73:170–85. 10.1016/j.jhep.2020.03.007 - DOI - PubMed
    1. Zhou Z, Wang P, Sun R, et al. . Tumor-Associated neutrophils and macrophages interaction contributes to intrahepatic cholangiocarcinoma progression by activating STAT3. J Immunother Cancer 2021;9:e001946. 10.1136/jitc-2020-001946 - DOI - PMC - PubMed
    1. Shi G-M, Jian Z, Fan J, et al. . Phase II study of lenvatinib in combination with GEMOX chemotherapy for advanced intrahepatic cholangiocarcinoma. Journal of Clinical Oncology 2021;39:e16163. 10.1200/JCO.2021.39.15_suppl.e16163 - DOI
    1. Imfinzi plus chemotherapy significantly improved overall survival in 1st-line advanced biliary tract cancer in TOPAZ-1 phase III trial at interim analysis, 2021. Available: https://www.astrazeneca.com/content/astraz/media-centre/pressreleases/20...

Publication types