. 2022 Aug 31;42(35):6782-6799.
doi: 10.1523/JNEUROSCI.1372-21.2022.

Task-Dependent Warping of Semantic Representations during Search for Visual Action Categories

Affiliations

Task-Dependent Warping of Semantic Representations during Search for Visual Action Categories

Mo Shahdloo et al. J Neurosci. .

Abstract

Object and action perception in cluttered dynamic natural scenes relies on efficient allocation of limited brain resources to prioritize the attended targets over distractors. It has been suggested that during visual search for objects, distributed semantic representation of hundreds of object categories is warped to expand the representation of targets. Yet, little is known about whether and where in the brain visual search for action categories modulates semantic representations. To address this fundamental question, we studied brain activity recorded from five subjects (one female) via functional magnetic resonance imaging while they viewed natural movies and searched for either communication or locomotion actions. We find that attention directed to action categories elicits tuning shifts that warp semantic representations broadly across neocortex and that these shifts interact with intrinsic selectivity of cortical voxels for target actions. These results suggest that attention serves to facilitate task performance during social interactions by dynamically shifting semantic selectivity toward target actions and that tuning shifts are a general feature of conceptual representations in the brain.SIGNIFICANCE STATEMENT The ability to swiftly perceive the actions and intentions of others is a crucial skill for humans that relies on efficient allocation of limited brain resources to prioritize the attended targets over distractors. However, little is known about the nature of high-level semantic representations during natural visual search for action categories. Here, we provide the first evidence showing that attention significantly warps semantic representations by inducing tuning shifts in single cortical voxels, broadly spread across occipitotemporal, parietal, prefrontal, and cingulate cortices. This dynamic attentional mechanism can facilitate action perception by efficiently allocating neural resources to accentuate the representation of task-relevant action categories.

Keywords: attention; fMRI; natural movies; visual actions; voxelwise modeling.


Figures

Figure 1.
Figure 1.
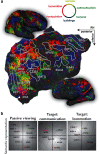
Hypothesized changes in semantic representation of action categories. Recent evidence suggests that the human brain organizes hundreds of object and action categories in a semantic space that is distributed systematically across the cerebral cortex (Huth et al., 2012). a, Semantic representation for a single subject from Çukur et al. (2013) is shown on flattened cortical surface and on inflated hemispheres. Colors indicate tuning for different object or action categories (top right, color legend). Regions of interest identified using conventional functional localizers are denoted by white borders. For abbreviations for regions of interest, see below, Materials and Methods. b, In the semantic space, action categories that are semantically similar to each other are mapped to nearby points, and semantically dissimilar actions are mapped to distant points. There is evidence that visual search for object categories warps semantic representation in favor of the targets by shifting single-voxel tuning for object categories toward target objects (Çukur et al., 2013). Thus, we hypothesized that visual search for a given action category should similarly expand the semantic representation of the target and semantically similar categories.
Figure 2.
Figure 2.
Model fitting and validation procedure. Undergoing fMRI, human subjects viewed 60 min of natural movies and covertly searched for communication or locomotion action categories while fixating on a central dot. a, An indicator matrix was constructed that identified the presence of each of the 922 object and action categories in each 1 s clip of the movies (Extended Data Fig. 2-1). Nuisance regressors were included to account for head motion, physiological noise, and eye movement confounds. An additional nuisance regressor was included to account for target detection confounds. In a CV procedure, regularized linear regression was used to estimate separate category model weights (i.e., category responses) for each search task that mapped each category feature to the recorded BOLD responses in single voxels. b, Accuracy of the fit models was cross-validated by measuring prediction performance on the held-out data in each CV fold after discarding the nuisance regressors and the target regressor. The prediction score of the fit models was taken as the product-moment correlation coefficient between estimated and measured BOLD responses, averaged across the two search tasks.
Figure 3.
Figure 3.
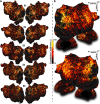
Prediction performance of the category model. To test the performance of fit category models, the prediction score was calculated on held-out data as the product-moment correlation coefficient between the predicted category responses and measured BOLD responses, and it was averaged across the two search tasks. a, Prediction scores of the category model are plotted on flattened cortical surfaces of individual subjects. A variance partitioning analysis was used to quantify the response variance that was uniquely predicted by the category model after accounting for low- and intermediate-level stimulus features (see above, Materials and Methods; Fig. 4). Voxels where the category model did not explain unique response variance after accounting for these features were masked [bootstrap test, q(FDR) < 0.05; Fig. 11]. b, To visualize single-subject results in a common space, prediction score values are shown following projection onto the standard brain template from FreeSurfer and averaging across subjects, after getting thresholded in single subjects. Only voxels that were identified as semantic in all individual subjects were averaged and displayed in the template. Regions of interest are illustrated by white borders. Several important sulci are illustrated by dashed gray lines. (For abbreviations for regions of interest and sulci, see above, Materials and Methods.) The category model predicts responses across ventral-temporal, parietal, and frontal cortices well, suggesting that visual categories are broadly represented across visual and nonvisual cortex. Results can be explored via an interactive brain viewer at http://www.icon.bilkent.edu.tr/brainviewer/shahdloo_etal/.
Figure 4.
Figure 4.
Comparison of category and control models. The prediction scores (raw product-moment correlation coefficient) of the category and control (the collection of motion energy and STIP regressors) models were measured for all cortical voxels. Voxels across all subjects are displayed. Each voxel is represented with a dot. Red versus blue dots indicate whether the category model or the control model yields higher prediction scores. Black dots indicate voxels where none of the models has high prediction scores. The category model outperforms the control model in 53.75 ± 3.29% of cortical voxels (mean ± SEM; average over 5 subjects).
Figure 5.
Figure 5.
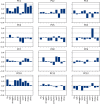
Fraction of uniquely predicted voxels in ROIs. We identified voxels in which the category model explained unique response variance after accounting for low-level motion energy and intermediate-level STIP stimulus features by performing a variance partitioning analysis (see above, Materials and Methods). Fraction of these semantic voxels is shown across ROIs in individual subjects. Asterisk indicates across-subject significance [bootstrap test, q(FDR) < 0.05].
Figure 6.
Figure 6.
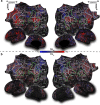
Attention warps semantic representation of action categories. To assess attentional changes, we projected voxelwise tuning profiles onto a continuous semantic space. a, The semantic space was derived from PCA of tuning vectors measured during a separate passive-viewing task and was tested to be consistent across subjects (Fig. 7). To illustrate the semantic information embedded within this space, action categories were projected onto PC1 and PC3 that best delineate the target actions (Fig. 8; words in regular font show projections of individual categories; Fig. 9). To illustrate the semantic content of the PCs, characteristic actions of the movie stimulus were clustered in the semantic space, and cluster centers were projected onto the PCs after getting labeled (bold italic words; see above, Materials and Methods; Fig. 10). Average location of the communication and locomotion actions are indicated with red and green dots. b, Action category responses during passive viewing and during the two search tasks were projected onto the semantic space, and a two-dimensional color map was used to color each voxel based on the projection values along PC1 and PC3 (left, legend). Projections in individual subjects were mapped onto the standard brain template from FreeSurfer, and average projections across subjects are displayed (Extended Data Figs. 6-1–6-5 for data in individual subjects). Figure formatting is identical to that in Figure 3. Many voxels across occipitotemporal, parietal, and prefrontal cortices shift their tuning toward targets, suggesting that attention warps semantic representations of actions. Specifically, voxels in inferior posterior parietal cortex, cingulate cortex, and anterior inferior prefrontal cortex shift their tuning toward communication during search for communication actions. Meanwhile, voxels in superior posterior and medial parietal cortex shift their tuning toward locomotion during search for locomotion actions. Results can be explored via an interactive brain viewer at http://www.icon.bilkent.edu.tr/brainviewer/shahdloo_etal/.
Figure 7.
Figure 7.
Consistency of the semantic space across subjects. To test whether the estimated semantic space is consistent across subjects, leave-one-out cross-validation was performed. In each cross-validation fold, best-predicted voxels from four subjects were used to derive 12 PCs to construct a semantic space. In the left-out subject, semantic tuning profile for each voxel was obtained by projecting action category responses during passive viewing onto the derived PCs. Next, the product-moment correlation coefficient was calculated between the tuning profiles in the derived space and the tuning profiles in the original semantic space. Results were averaged across semantic voxels in the left-out subject. Correlation coefficients are shown for each PC and each subject. The cross-validated semantic spaces consistently correlate with the original semantic space.
Figure 8.
Figure 8.
The distance between target actions in subspaces spanned by different pairs of PCs. To visualize attentional modulation of semantic representation in Figure 6, we compared projections of action category responses onto a pair of PCs across the search tasks. To maximize our sensitivity in visualizing the attentional modulations, we chose the pair of dimensions that maximally separates the actions belonging to the two target categories (i.e., communication and locomotion categories). The Mahalanobis distance between communication actions and locomotion actions (mean ± SEM across communication and locomotion actions) in the subspace spanned by each pair of PCs is shown. Target actions are maximally separated across the subspace spanned by the first and third PCs.
Figure 9.
Figure 9.
Distribution of action categories across PCs. To illustrate the distribution of action categories embedded within the semantic space, action categories were projected onto the PCs. Projections onto the first three PCs are shown (words in regular font show projections of individual categories). To facilitate illustration, categories were collapsed into 10 clusters, and cluster centers were also projected onto the PCs (bold italic words; see above, Materials and Methods). Average location of the communication and locomotion actions are indicated with red and green dots. The estimated semantic space captures reasonable semantic variance across action categories in natural movies.
Figure 10.
Figure 10.
Projections of action category clusters onto PCs. Each of the 109 action categories were projected onto the 12 semantic PCs. The projections were then clustered into 10 groups using k means and labeled for interpretation (see above, Materials and Methods). The projections of the cluster centers onto 12 PCs are shown. The first three dimensions were used to visualize the semantic space. The first dimension distinguishes between self-movements (e.g., swirl, consume) and actions that are targeted toward other humans or objects (e.g., reach, talk). The second dimension distinguishes between dynamic (e.g., drive, chase) versus static actions (e.g., consume, struggle). The third dimension distinguishes between actions that involve humans (e.g., talk, reach) and dynamic actions (e.g., fly, swirl).
Figure 11.
Figure 11.
Cortical distribution of tuning shifts. a, To quantify the tuning shifts for the attended versus unattended categories, a tuning shift index (TSIall ∈ [−1,1]) was calculated for each voxel. Tuning shifts toward the attended category would yield positive TSI (red color), whereas negative TSI would indicate shifts away from the attended category (blue color). TSIall values from individual subjects were projected onto the standard brain template and averaged across subjects (Extended Data Figs. 11-1a, 11-2a, 11-3a, 11-4a, 11-5a for data in individual subjects). Figure formatting is identical to that in Figure 3. AON is outlined by green dashed lines. Voxels across many cortical regions shifted their tuning toward the attended category. These include regions across AON (occipitotemporal cortex, posterior parietal cortex, and premotor cortex), lateral prefrontal cortex, and anterior cingulate cortex. b, To examine how representation of nontarget action categories changes during visual search, we measured a separate tuning shift index specifically for these categories (TSInt). TSInt values from individual subjects were projected onto the standard brain template and averaged across subjects (Extended Data Figs. 11-1b, 11-2b, 11-3b, 11-4b, 11-5b for data in individual subjects). TSInt shows a similar distribution to TSIall shown in a, albeit with lower magnitude (Fig. 12). Tuning shift for nontarget categories is positive across many voxels within posterior parietal cortex and anterior prefrontal cortex, suggesting a more flexible semantic representation of actions in these cortices, compared with occipitotemporal AON nodes. Results can be explored via an interactive brain viewer at http://www.icon.bilkent.edu.tr/brainviewer/shahdloo_etal/.
Figure 12.
Figure 12.
Difference in tuning shift for target, versus nontarget categories. The difference between absolute values of TSIall and TSInt were calculated in individual ROIs. TSIall is significantly larger than TSInt in all areas with significant tuning shift.
Figure 13.
Figure 13.
Fraction of the overall tuning shifts. Fraction of the overall tuning shifts explained by shifts in tuning for target categories (mean ± SEM across subjects) and nontarget categories (i.e., excluding the union of communication and locomotion categories) is shown. Target categories explain a greater portion of the overall tuning shifts broadly across ROIs, except for early retinotopic areas. At the same time, nontarget categories significantly contribute to the overall tuning shifts.
Figure 14.
Figure 14.
Interaction of tuning shifts with intrinsic selectivity for individual targets. To examine the interaction between tuning shifts and the intrinsic selectivity for individual targets, separate target PIs were calculated during search for communication (PIcom), and locomotion (PIloc) categories. PI during search for a specific target action was taken as the difference in selectivity for the target versus distractor during the search for that target. PIcom and PIloc values are shown following projection onto the standard brain template (Extended Data Figs. 11-1c, 11-2c, 11-3c, 11-4c, 11-5c for data in individual subjects). A two-dimensional color map was used to annotate each voxel based on PIcom and PIloc values (middle, legend). Figure format is identical to that of Figure 3. AON is outlined by green dashed lines. Semantic tuning in voxels across posterior parietal and anterior prefrontal cortices shift toward the attended category regardless of the search target. However, tuning in many voxels in anterior parietal, occipital, and cingulate cortices shift toward the attended category only during the search for communication or only during the search for locomotion actions.
Figure 15.
Figure 15.
Attentional tuning changes in regions of interest. a–d, Average (a) TSIall, (b) TSInt, (c) PIcom, and (d) PIloc values were examined in cortical areas (mean ± SEM across 5 subjects). Significant values are denoted by green bars, and gray bars denote nonsignificant values [bootstrap test, q(FDR) > 0.05]. Values for individual subjects are indicated by dots. Gray dots show values in areas with nonsignificant mean, green dots show nonsignificant values in areas with significant mean, and green crosses show significant values in areas with significant mean. Tuning shift is significantly greater than zero in many regions across all levels of the AON including occipitotemporal cortex (pSTS, pMTG), posterior parietal cortex (IPS, AG, SMG), and premotor cortex (BA44, BA45), and in regions across prefrontal and cingulate cortices (SFG, ACC). Compared with occipitotemporal areas, attention more diversely modulates semantic representations in parietal and premotor AON nodes, manifested as significantly positive tuning shift for nontarget categories in posterior parietal cortex (AG, SMG) and anterior inferior frontal cortex (BA45). PIcom is significantly greater than zero in BA44/45, SFG, and ACC. In contrast, PIloc is significantly greater than zero in IPS and AG and is significantly less than zero in dPMC. Both PIcom and PIloc are significantly greater than zero in pSTS, pMTG, SMG, and MFG. Tuning shifts interact with the attention task and with intrinsic selectivity of cortical areas for target action categories.

References

    1. Abdollahi RO, Jastorff J, Orban GA (2013) Common and segregated processing of observed actions in human SPL. Cereb Cortex 23:2734–2753. 10.1093/cercor/bhs264 - DOI - PubMed
    1. Anticevic A, Repovs G, Barch DM (2010) Resisting emotional interference: brain regions facilitating working memory performance during negative distraction. Cogn Affect Behav Neurosci 10:159–173. 10.3758/CABN.10.2.159 - DOI - PMC - PubMed
    1. Bach P, Schenke KC (2017) Predictive social perception: towards a unifying framework from action observation to person knowledge. Soc Personal Psychol Compass 11:e12312. 10.1111/spc3.12312 - DOI
    1. Battelli L, Cavanagh P, Thornton IM (2003) Perception of biological motion in parietal patients. Neuropsychologia 41:1808–1816. 10.1016/S0028-3932(03)00182-9 - DOI - PubMed
    1. Bedny M, Caramazza A (2011) Perception, action, and word meanings in the human brain: the case from action verbs. Ann N Y Acad Sci 1224:81–95. 10.1111/j.1749-6632.2011.06013.x - DOI - PubMed