. 2022 Oct;11(19):e2201265.
doi: 10.1002/adhm.202201265. Epub 2022 Jul 31.

A Fibrinogen-Mimicking, Activated-Platelet-Sensitive Nanocoacervate Enhances Thrombus Targeting and Penetration of Tissue Plasminogen Activator for Effective Thrombolytic Therapy

Affiliations

A Fibrinogen-Mimicking, Activated-Platelet-Sensitive Nanocoacervate Enhances Thrombus Targeting and Penetration of Tissue Plasminogen Activator for Effective Thrombolytic Therapy

Yu Huang et al. Adv Healthc Mater. 2022 Oct.

Abstract

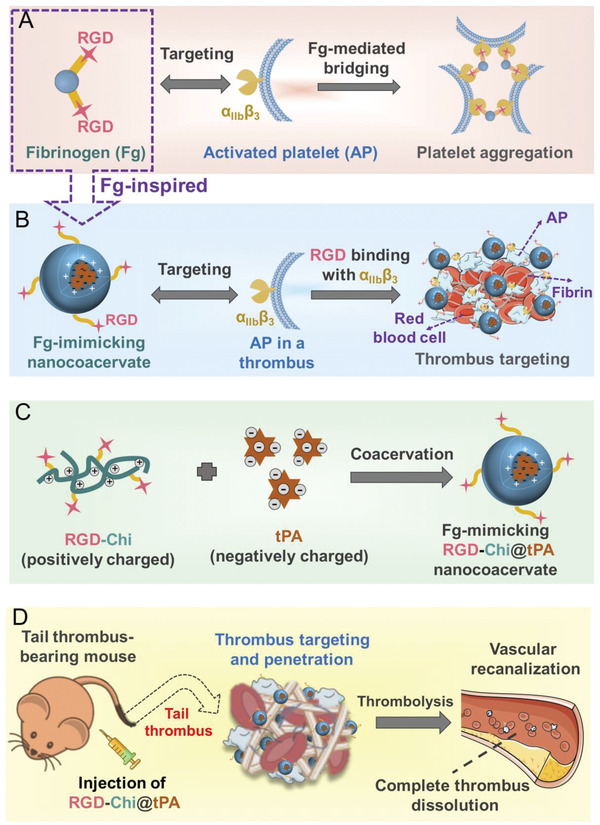
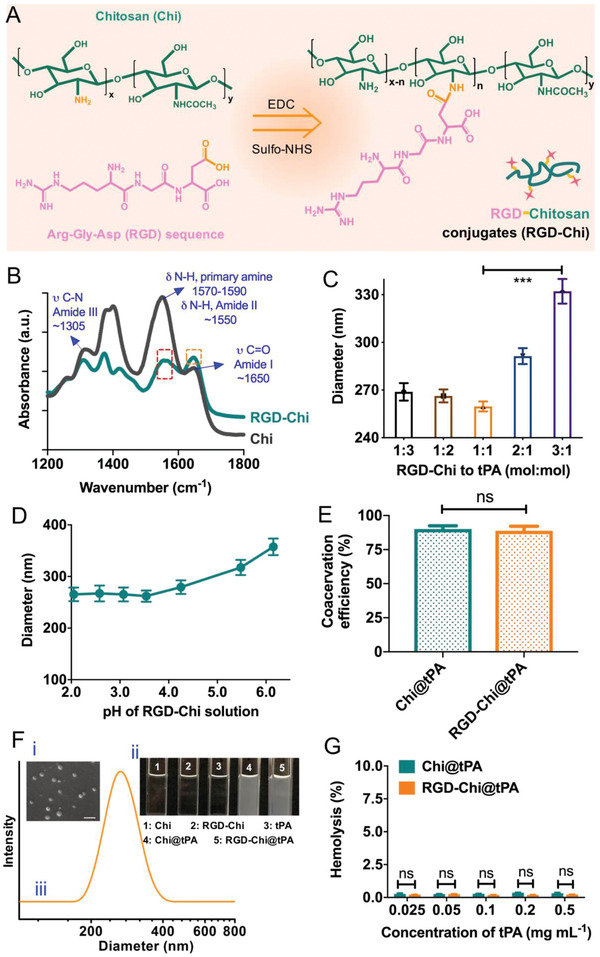
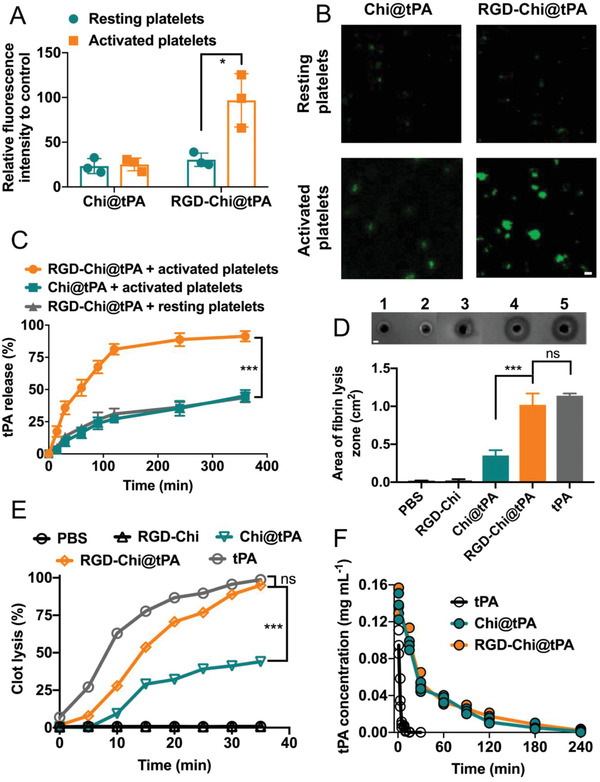
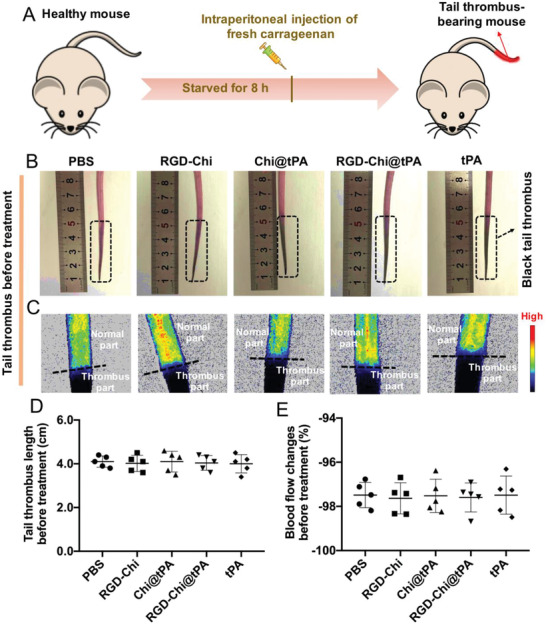
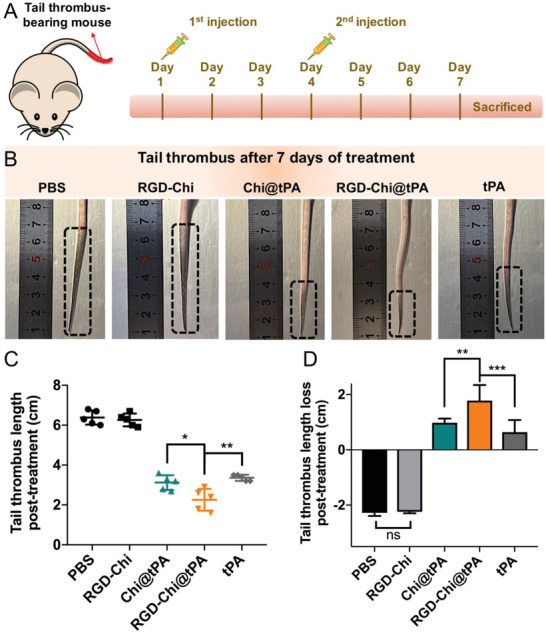
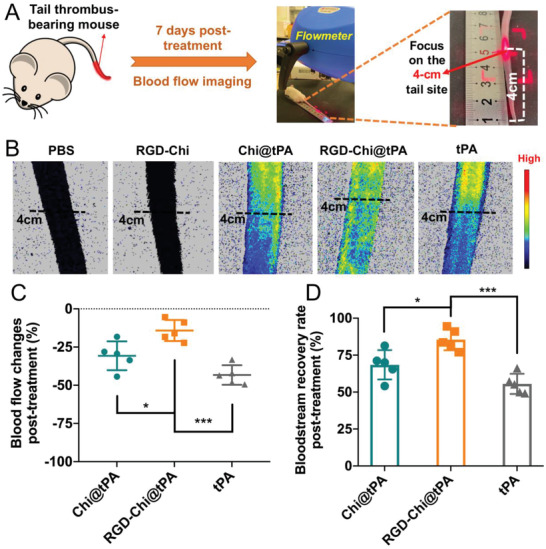
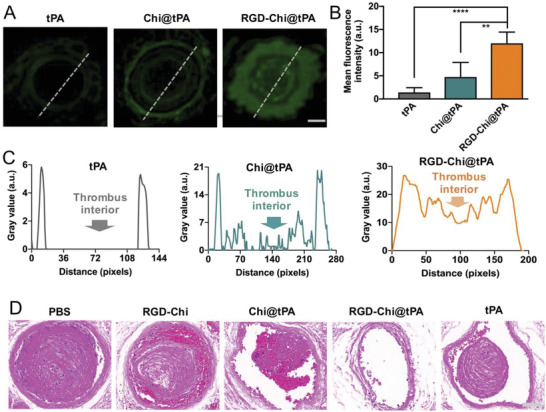
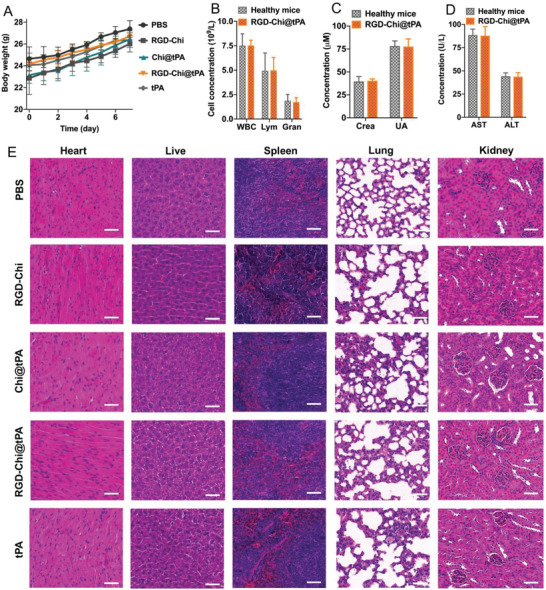
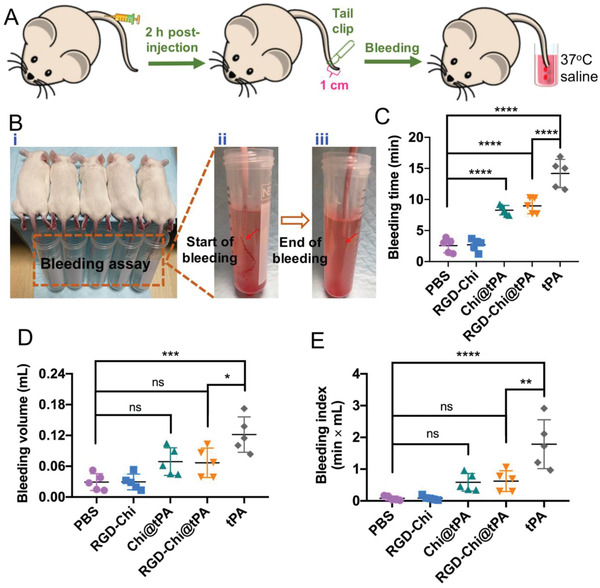
The development of a fibrinolytic system with long circulation time, high thrombus targeting, efficient thrombus penetration, effective thrombolysis, and minimal hemorrhagic risk remains a major challenge. Herein, inspired by fibrinogen binding to activated platelets in thrombosis, this article reports a fibrinogen-mimicking, activated-platelet-sensitive nanocoacervate to enhance thrombus penetration of tissue plasminogen activator (tPA) for targeted thrombolytic therapy. This biomimetic nanothrombolytic system, denoted as RGD-Chi@tPA, is constructed by "one-pot" coacervation through electrostatic interactions between positively charged arginine-glycine-aspartic acid (RGD)-grafted chitosan (RGD-Chi) and negatively charged tPA. Flow cytometry and confocal laser scanning microscopy measurements show targeting of RGD-Chi@tPA to activated platelets. Controlled tPA release triggered by activated platelets at a thrombus site is demonstrated. Its targeted fibrinolytic and thrombolytic activities are measured in in vitro models. The pharmacokinetic profiles show that RGD-Chi@tPA can significantly prolong circulation time compared to free tPA. In a mouse tail thrombus model, RGD-Chi@tPA displays efficient thrombus targeting and penetration, enabling a complete vascular recanalization as confirmed by the fluorescence imaging, histochemical assay, and laser speckle contrast imager. Consequently, RGD-Chi@tPA induces a substantial enhancement in thrombolysis with minimal hemorrhagic risk compared to free tPA. This simple, effective, and safe platform holds great promise for the development of thrombolytic nanomedicines.

Keywords: chitosan; fibrinogen-mimicking nanocoacervate; targeted thrombolysis; thrombus penetration; tissue plasminogen activators.


Conflict of interest statement

The authors declare no conflict of interest.

Figures

Scheme 1
Scheme 1
A) Schematic illustration of targeting of RGD ligands to fibrinogen (Fg) and α IIb β 3 integrin on activated platelets (APs). B) Schematic illustration of thrombus targeting of a fibrinogen‐mimicking nanocoacervate through selective binding of RGD ligands to α IIb β 3 integrin on activated platelets at a thrombus site. C) Schematic illustration of the preparation of fibrinogen‐mimicking nanocoacervates, RGD‐Chi@tPA, by coacervation through electrostatic interactions between positively charged RGD‐grafted chitosan (RGD‐Chi) and negatively charged tPA. D) Schematic illustration of targeted thrombolysis after intravenous injection of RGD‐Chi@tPA in a mouse tail thrombus model.
Figure 1
Figure 1
A) Synthesis of the RGD‐Chi conjugate from chitosan (Chi) and the RGD peptide. B) FTIR spectra of Chi and RGD‐Chi. C) Mean hydrodynamic sizes of RGD‐Chi@tPA as a function of the molar ratio of RGD‐Chi to tPA (RGD‐Chi solution at pH 3.5 and 25 °C). D) Mean hydrodynamic sizes of RGD‐Chi@tPA as a function of pH of the RGD‐Chi solution (1:1 molar ratio of RGD‐Chi to tPA and 25 °C). E) Coacervation efficiencies of Chi@tPA and RGD‐Chi@tPA. F) i) SEM micrograph of RGD‐Chi@tPA (scale bar: 500 nm); ii) Photographs of Chi, RGD‐Chi, tPA, Chi@tPA, and RGD‐Chi@tPA solutions; iii) Typical intensity‐weighted DLS plot of RGD‐Chi@tPA in aqueous solution (pH 7.4 and 25 °C). G) Hemolysis of Chi@tPA and RGD‐Chi@tPA, respectively, as a function of tPA concentration. Data are presented as the average ± standard deviation (n = 3). Statistical analysis was performed by the Student's t‐test (***p < 0.001 and ns, not significant).
Figure 2
Figure 2
A) Relative mean fluorescence intensities of resting and activated platelets treated with the FITC‐labeled Chi@tPA and RGD‐Chi@tPA, respectively, as measured by flow cytometry. B) CLSM images of resting and activated platelets incubated with the FITC‐labeled Chi@tPA and RGD‐Chi@tPA, respectively (scale bar: 5 µm). C) tPA release profiles of Chi@tPA and RGD‐Chi@tPA after incubation with resting or activated platelets. D) Calculated areas of fibrin clot lysis zone after treatment with PBS buffer, RGD‐Chi, Chi@tPA, RGD‐Chi@tPA, and free tPA, respectively, after treatment with activated platelets for 2 h. Inset: representative photograph of fibrin lysis zone after treatment with the No. ≈1–5 formulations: PBS buffer, RGD‐Chi, Chi@tPA, RGD‐Chi@tPA, and free tPA, respectively (scale bar: 4 mm). E) Time‐dependent blood clot lysis in the halo model after treatment with PBS buffer, RGD‐Chi, Chi@tPA, RGD‐Chi@tPA, and free tPA, respectively. F) Pharmacokinetic profiles of Chi@tPA, RGD‐Chi@tPA, and free tPA in healthy SD rats. Data are presented as the average ± standard deviation (n = 3). Statistical analysis was performed by the Student's t‐test and ANOVA test (*p < 0.05, ***p < 0.001, and ns, not significant).
Figure 3
Figure 3
A) Illustration of a KM mouse tail thrombus model established via intraperitoneal injection with fresh carrageenan (20 mg kg−1). B) Photographs of the black tail thrombi, C) bloodstream images, and D) lengths of tail thrombus in five mouse groups before treatment with PBS buffer, RGD‐Chi, Chi@tPA, RGD‐Chi@tPA, and free tPA, respectively. E) Blood flow changes of the tail thrombus part relative to the normal part in five mouse groups before treatment with PBS buffer, RGD‐Chi, Chi@tPA, RGD‐Chi@tPA, and free tPA, respectively. Data are presented as the average ± standard deviation (n = 5).
Figure 4
Figure 4
A) The tail thrombus‐bearing KM mice were randomly divided into five groups for intravenous injection with PBS buffer, RGD‐Chi, Chi@tPA, RGD‐Chi@tPA, and free tPA, respectively, on days 1 and 4. For each injection, the tPA dose was 10 mg kg−1. B) Photographs of KM mouse tail thrombi, C) tail thrombus lengths, and D) tail thrombus length losses after 7 days of treatment with PBS buffer, RGD‐Chi, Chi@tPA, RGD‐Chi@tPA, and free tPA, respectively. Data are presented as the average ± standard deviation (n = 5). Statistical analysis was performed by the ANOVA test (*p < 0.05, **p < 0.01, and ***p < 0.001).
Figure 5
Figure 5
A) The same site at the KM mouse tail length of 4 cm was focused by a laser blood flowmeter to evaluate the bloodstream recovery after 7 days of treatment. B) Bloodstream images, C) blood flow changes in the tail part below the 4‐cm site relative to that above the 4‐cm site, and D) bloodstream recovery rates of the tail thrombus after treatment with PBS buffer, RGD‐Chi, Chi@tPA, RGD‐Chi@tPA, and free tPA (equivalent tPA dose of 10 mg kg−1), respectively. Data are presented as the average ± standard deviation (n = 5). Statistical analysis was performed by the ANOVA test (*p < 0.05 and ***p < 0.001).
Figure 6
Figure 6
Fluorescence images showing the KM mouse tail thrombus slices which were collected and stained with the FITC‐labeled tPA, Chi@tPA, and RGD‐Chi@tPA (equivalent tPA dose of 2.5 µg mL−1), respectively, at 37 °C for 35 min (scale bar: 100 µm). B) Mean fluorescence intensity of FITC in the fluorescence images of tail thrombi post staining as analyzed by Fiji. Data are presented as the average ± standard deviation (n = 5). Statistical analysis was performed by the ANOVA test (*p < 0.05 and ****p < 0.0001). Dotted line indicates the cross‐section used to produce the intensity profiles shown in (C) with the use of Fiji. D) Representative H&E staining photomicrographs of the slices of tail thrombi of KM mice after 7 days of treatment with PBS buffer, RGD‐Chi, Chi@tPA, RGD‐Chi@tPA, and free tPA (equivalent tPA dose of 10 mg kg−1), respectively (scale bar: 100 µm).
Figure 7
Figure 7
A) Body weights of KM mice after 7 days of treatment with PBS buffer, RGD‐Chi, Chi@tPA, RGD‐Chi@tPA, and free tPA (equivalent tPA dose of 10 mg kg−1), respectively. Data are presented as the average ± standard deviation (n = 5). B) Hematology studies of inflammatory cells (WBC, white blood cells; Lym, lymphocytes; Gran, granulocytes) in blood, C) biochemical indexes of creatinine (Crea) and uric acid (UA) in serum, and D) biochemical indexes of aspartate aminotransferase (AST) and alanine aminotransferase (ALT) in serum of KM mice containing thrombi in their tails after 7 days of treatment with RGD‐Chi@tPA (healthy KM mice as control). Data are presented as the average ± standard deviation (n = 3). E) Representative H&E staining photomicrographs of major organs (heart, liver, spleen, lung, and kidney) after 7 days of treatment with PBS buffer, RGD‐Chi, Chi@tPA, RGD‐Chi@tPA, and free tPA, respectively (scale bar: 100 µm).
Figure 8
Figure 8
A) Schematic illustration of a tail bleeding assay using KM mice. B) i) Bleeding assay was performed by amputation of the tail tip, immediately followed by submergence into a 37 °C saline solution; ii) Photograph showing the start of bleeding in the assay; iii) Photograph showing the end of bleeding in the assay. C) Bleeding time, D) bleeding volume, and E) bleeding index in the tail‐cut mice after injection with PBS buffer, RGD‐Chi, Chi@tPA, RGD‐Chi@tPA, and free tPA, respectively. The bleeding index was defined by the product of bleeding time (min) and bleeding volume (mL). Data are presented as the average ± standard deviation (n = 5). Statistical analysis was performed by the ANOVA test. (*p < 0.05, **p < 0.01, ***p < 0.001, ****p < 0.0001, and ns, not significant).

Similar articles

Cited by

References

    1. Collen D., Lijnen H. R., Blood 1991, 78, 3114. - PubMed
    1. Mackman N., Nature 2008, 451, 914. - PMC - PubMed
    1. Raskob G. E., Angcahisuksiri P., Blanco A. N., Buller H., Gallus A., Hunt B. J., Hylek E. M., Kakkar A., Kostantinides S. V., McCumber M., Ozaki Y., Wendelboe A., Weitz J. I., Thromb. Res. 2014, 134, 931. - PubMed
    1. Marder V., Blood Rev. 2001, 15, 143. - PubMed
    1. Bode C., Runge M. S., Haber E., Clin. Cardiol. 1990, 13, 375. - PubMed

Publication types

LinkOut - more resources