. 2022 Jul 21;13(1):4209.
doi: 10.1038/s41467-022-31752-z.

Heterogeneous nuclear ribonucleoprotein U (HNRNPU) safeguards the developing mouse cortex

Affiliations

Heterogeneous nuclear ribonucleoprotein U (HNRNPU) safeguards the developing mouse cortex

Tamar Sapir et al. Nat Commun. .

Abstract

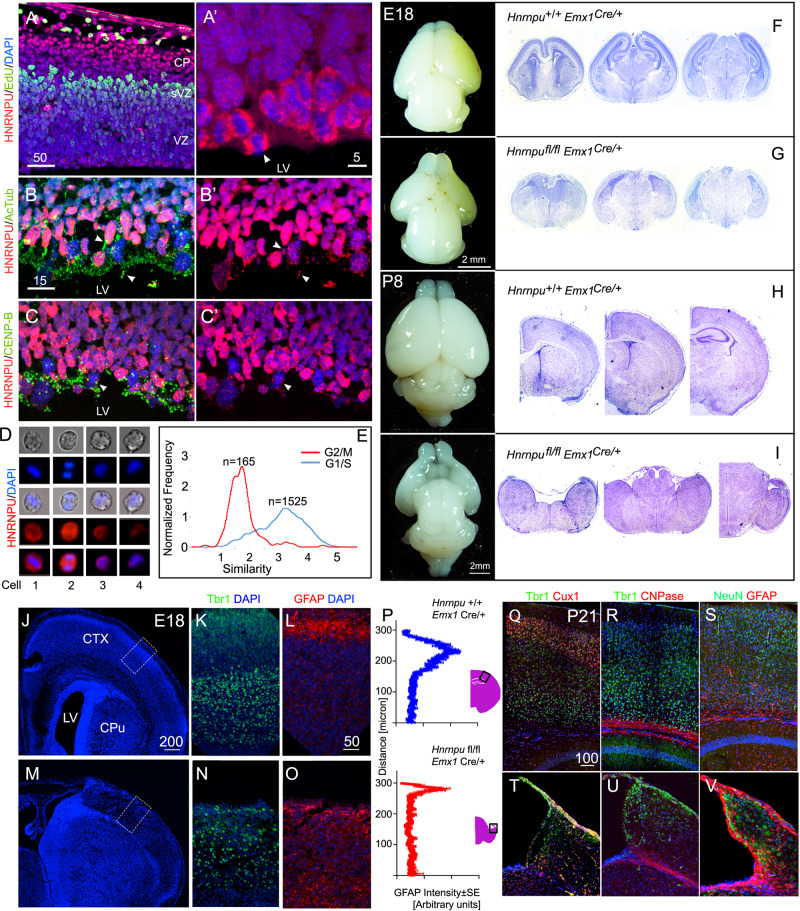
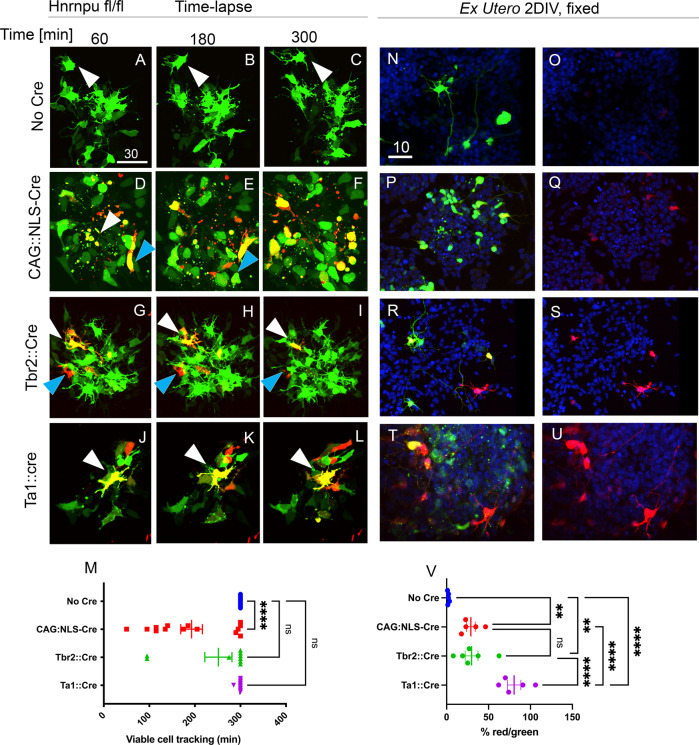
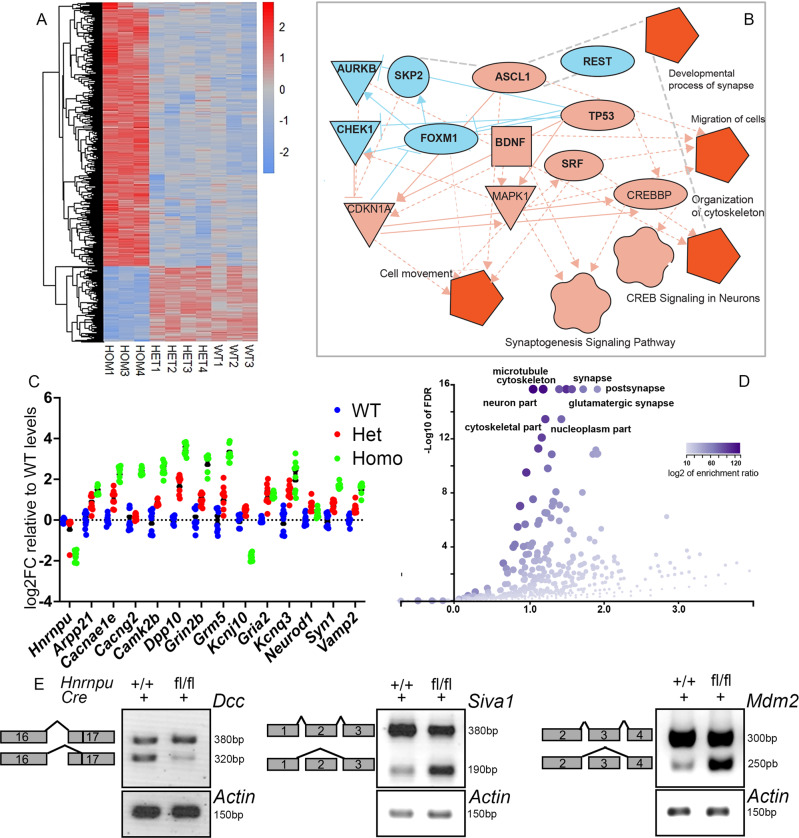
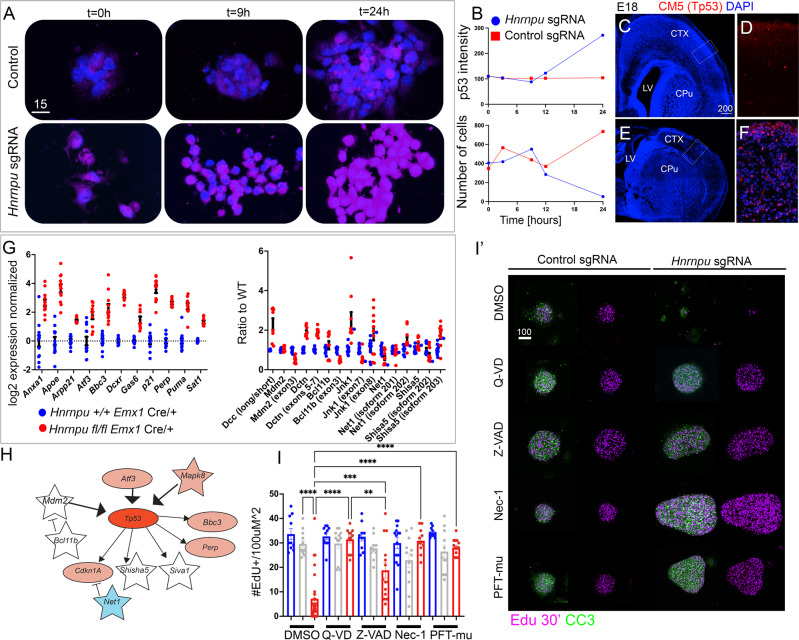
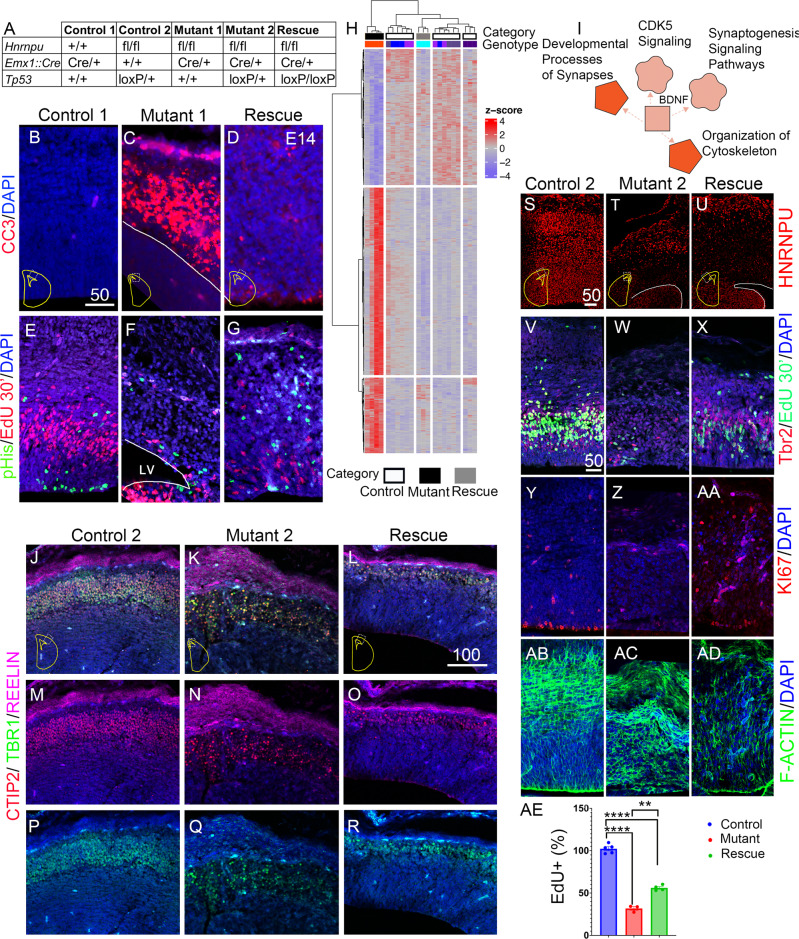
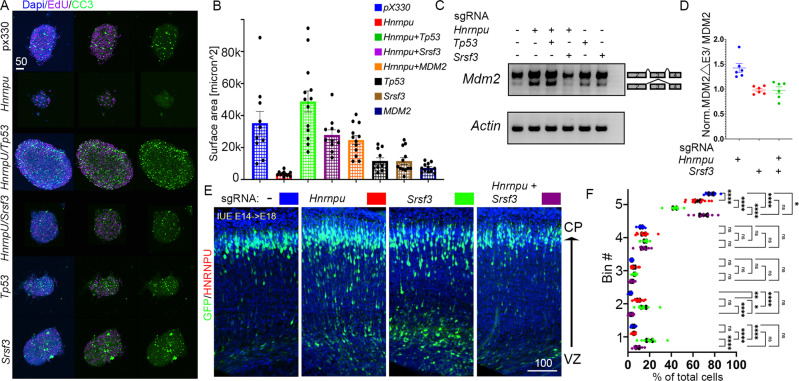
HNRNPU encodes the heterogeneous nuclear ribonucleoprotein U, which participates in RNA splicing and chromatin organization. Microdeletions in the 1q44 locus encompassing HNRNPU and other genes and point mutations in HNRNPU cause brain disorders, including early-onset seizures and severe intellectual disability. We aimed to understand HNRNPU's roles in the developing brain. Our work revealed that HNRNPU loss of function leads to rapid cell death of both postmitotic neurons and neural progenitors, with an apparent higher sensitivity of the latter. Further, expression and alternative splicing of multiple genes involved in cell survival, cell motility, and synapse formation are affected following Hnrnpu's conditional truncation. Finally, we identified pharmaceutical and genetic agents that can partially reverse the loss of cortical structures in Hnrnpu mutated embryonic brains, ameliorate radial neuronal migration defects and rescue cultured neural progenitors' cell death.


Conflict of interest statement

D.B.G. is the founder of Praxis Precision Medicines and Action Biosciences. O.D. receives grant support from NINDS, NIMH, MURI, CDC, and NSF. He has equity and/or compensation from the following companies: Tilray, Receptor Life Sciences, Qstate Biosciences, Hitch Biosciences, Tevard Biosciences, Regel Biosciences, Script Biosciences, Actio Biosciences, Empatica, SilverSpike, and California Cannabis Enterprises (CCE). He has received consulting fees from Zogenix, Ultragenyx, BridgeBio, and Marinus. He holds patents for cannabidiol in treating neurological disorders, but these are owned by GW Pharmaceuticals, and he has waived any financial interests. He holds other patents in molecular biology. He is the managing partner of the PhiFund Ventures. Ingrid Scheffer has served on scientific advisory boards for BioMarin, Chiesi, Eisai, Encoded Therapeutics, GlaxoSmithKline, Knopp Biosciences, Nutricia, Rogcon, Takeda Pharmaceuticals, UCB, Xenon Pharmaceuticals; has received speaker honoraria from GlaxoSmithKline, UCB, BioMarin, Biocodex, Chiesi, Liva Nova and Eisai; has received funding for travel from UCB, Biocodex, GlaxoSmithKline, Biomarin and Eisai; has served as an investigator for Anavex Life Sciences, Cerecin Inc, Cereval Therapeutics, Eisai, Encoded Therapeutics, EpiMinder Inc, Epygenyx, ES-Therapeutics, GW Pharma, Marinus, Neurocrine BioSciences, Ovid Therapeutics, Takeda Pharmaceuticals, UCB, Ultragenyx, Xenon Pharmaceutical, Zogenix and Zynerba; and has consulted for Atheneum Partners, Care Beyond Diagnosis, Epilepsy Consortium, Ovid Therapeutics, UCB and Zynerba Pharmaceuticals; and is a Non-Executive Director of Bellberry Ltd and a Director of the Australian Academy of Health and Medical Sciences and the Australian Council of Learned Academies Limited. The other authors declare no competing interests.

Figures

Fig. 1
Fig. 1. HNRNPU is strongly expressed in mitotic mouse neural progenitors and is essential for brain development.
A-C’ Expression pattern of HNRNPU (Red) in coronal sections of E13 embryos cortices. A EdU, (Green), 1 h post-injection highlights cells in the S-phase at the basal border of the ventricular zone. B Acetylated tubulin (green) marks stabilized tubulin at the radial progenitor primary cilia. C CENP-B (green) marks centrosomes tethered to the apical surface. D, E Flow Cytometry of dissociated neurospheres (E13, 2 days in vitro) at four stages of the cell cycle, classified by EdU incorporation and DAPI stain. Red- HNRNPU, blue-DAPI. E Distribution of the levels of HNRNPU and co-localization with DAPI (Similarity) in a population of dissociated neurospheres classified as G2/M n = 165 or G1/S n = 1525. Images of whole brains and corresponding 5 μM thick coronal sections (Nissl staining) of embryonic day 18 (E18, F, G) and postnatal day 8 (P8), of Emx1Cre littermates carrying WT (F, H) or floxed Hnrnpu alleles (G, I). JO Expression of GFAP (Red) and Tbr1 (Green) in section of E18 obtained from control (Hnrnpu +/+ Emx1Cre/+) and mutant (Hnrnpu fl/fl Emx1 Cre/+) littermates. Insert indicate region magnified in L, O. Tbr1 images (K, N) were captured from equivalent locations. P Averaged GFAP intensity histograms in arbitrary units after background subtraction along the upper 300 μM of coronal sections of E18 cortices (n = 3, each measured in triplicates). QV P21 brain sections of mutant and control (Hnrnpu +/+ Emx1 Cre/+) littermates stained with cortical plate layers markers (Tbr1, Cux1 in Q, T) and glia markers, 2′,3′-cyclic nucleotide-3′-phosphodiesterase (CNPase R, U) and GFAP (S, V). Schematic representation of the slice morphology (pink) showing images location (black rectangle). LV-lateral ventricle, CPu- caudate putamen, CTX- Cortex. Size bars are in μM.
Fig. 2
Fig. 2. Neural progenitors are highly sensitive to HNRNPU loss.
Dual Color Cre reporter (CAG::SL) was electroporated to E13 Hnrnpu fl/fl embryos, injected with either no Cre (AC, N-0, Supp_Movie 1) or with Cre expressing plasmids under one of three promoters (CAG::NLS-Cre-GFP (DF, P, Q, Supp_Movie 2), Tbr2::Cre and (GI, R, S, Supp_Movie 3) Ta1::Cre (JL, TU, Supp_Movie 4) AL Images of time-lapse recording (5 h long) of primary cultures prepared from electroporated cortices. Arrowhead highlight specific cells in the field of view. M Tracking of cell viability in each field of view, a dot indicates the last time point a tracked cell is visible before disintegration, vertical lines indicate average values, bars indicate ±SEM range. Statistical analysis was performed using one-way ANOVA with Dunnett’s multiple comparison tests, p < 0.0001. Control, n = 17, CAG::NLS-Cre-GFP n = 14, Tbr2::Cre, n = 9 and Ta1::Cre n = 10. NU Images of fixed primary cultures, after 2 days in vitro (2DIV), Showing transfected cells (expressing floxed ZsGreen, Green) and cells with an excised reporter (mCherry, Red). V Percentage of cells expressing mCherry out of ZsGreen expressing cells in Control (N, O, n = 581) CAG::NLS-Cre (P, Q, n = 787), Tbr2::Cre (R, S n = 182) and Ta1::Cre (T, U, n = 137). Blue, DAPI. Statistical analysis was done using ordinary one-way ANOVA with uncorrected Fisher’s LSD, p values: no Cre vs. CAG::NLS-Cre 0.0092, No cre vs. Tbr2::Cre p = 0.0056. No Cre vs. Ta1::Cre p < 0.0001. CAG::NLS-Cre vs. Tbr2::Cre, NS. CAG::NLS-Cre vs. Ta1::Cre p < 0.0001. Tbr2::Cre vs. Ta1::Cre p < 0.0001. **P < 0.01, ***P < 0.001, ****P < 0.0001, ns-non significant. Variability is indicated by ±SEM bars. Size bars units are μM. Source data are provided as a Source Data file.
Fig. 3
Fig. 3. Hnrnpu mutant cortices display changes in mRNA expression and alternative splicing of genes critical for brain development and function.
A Hierarchical clustering of the expression of 1556 cortical DE genes in E13 control (Hnrnpu+/+Emx1Cre), Mutant (Hnrnpufl/fl Emx1Cre/+) and Heterozygous (Het, Hnrnpufl/+ Emx1Cre/+) E13 mouse cortices. The expression values are represented by the log-normalized read count after the Zscore transformation. Each row is a gene. B Ingenuity analysis of RNA-seq highlighting multiple affected pathways and upstream regulators (Shape code: pentagon- function, flower- canonical pathway, ellipsoid- upstream regulator, triangle- kinase, square- growth factor, circle- other. Color code: light blue- downregulation, Red- strong activation, Pink- activation. lines represent interconnections between components in the network. color code: light blue- downregulation, Red- strong activation, Pink- activation). C Verification of differential expression of selected genes by qPCR in E13 cortices of control, Mutant, and Het embryos (n = 3 biological repeats (each measured in triplicates). Error bars ± SEM. D Dysregulation of alternative splicing landscape in Hnrnpu mutant mice identified by MAJIQ. The volcano plot depicts the comparison between the mutant (Hnrnpufl/flEmx1Cre) and the wildtype (Hnrnpu+/+Emx1Cre). Enriched cellular components are indicated. E Splice variant-specific PCR primers detect alternative isoforms of DCC, Siva1, and MDM2, in cDNA prepared from E13 embryo cortices of mutant (Hnrnpufl/flEmx1Cre) and control (Hnrnpu+/+Emx1Cre) littermates. Source data are provided as a Source Data file.
Fig. 4
Fig. 4. Activation of TP53-mediated apoptotic pathway following Hnrnpu KO.
A Time-dependent accumulation of TP53 (CM5 antibody) in neurospheres treated with control CRISPR/CAS9 plasmid (px330) or Hnrnpu sgRNA’s and plated at indicated time. Acquisition of the intensity of the CM5 signal was done in identical imaging parameters for all images. B Measurements of the dynamic accumulation of TP53. Cells were identified DAPI, and the average intensity in each spot was normalized to a non-specific background (upper panel). The accumulative number of cells in all fields of view is plotted against time (lower panel). CF Low magnification images (Dapi, blue) of coronal sections (E18) of control (Hnrnpu +/+Emx1Cre/+) and mutant (Hnrnpufl/flEmx1Cre/+) brains. Inserts indicate the location of high magnification images (D, F). Anti-TP53 (CM5, Red) fails to react with sections from control cortices. D Reveals stabilization of TP53 in cells throughout mutant cortices (F). G Normalized expression levels (left panel) and alternative splicing (right panel) in the mutant (Hnrnpufl/flEmx1Cre) and control (Hnrnpu+/+Emx1Cre) E13 cortices, showing elevated expression of Tp53 targets and misrepresentation of alternative splice variants of genes in the TP53 pathway n = 3 biological repeats (each measured in triplicates). Error bars ±SEM. H Schematic representation of functional connections between differentially expressed (ellipsoid) and abnormal spliced (star) gene products presented in C. color code: Red-Strong activation, Pink- overexpression, Blue- downregulation, White- no change in expression levels. n = 4 biological repeats I-I’) Effective protection from apoptotic cell death of CRISPR/CAS9 sgRNA (Hnrnpu sgRNA, Red) Non-electroporated neurospheres (gray) and control (px330, blue) Electroporated neurospheres were treated with solvent only (DMSO), Q-VD-OPh (50 μM), Z-VAD-fmk (50 μM), Necrostatin-1 (Nec1, 1 μM) and Pifithrin-μ (pFT-mu, 5 μM). Bars indicate the number of EdU+ cells per 100 μM2 of the neurospheres surface area, following 30 min exposure to EdU. Ordinary one-way ANOVA with Tukey’s multiple comparison test was used for data analysis. P values: **p < 0.01, ***p < 0.001, ****p < 0.0001. Error bars (±SEM) are indicated F Images of neurospheres treated with either DMSO or indicated small molecules. EdU incorporation (Click chemistry, magenta) and Cleaved Caspase, Asp175 (CC3, Green), are presented. Size bars units are μM. Source data are provided as a Source Data file.
Fig. 5
Fig. 5. Genetic ablation of Tp53 reverses cortical loss in Hnrnpu mutant embryos.
A The classification of the three alleles. Accumulation of CC3, Red in control 1 (B) and Mutant 1 (C). Reduced levels of p53 (CM5, Red) in Hnrnpufl/fl Emx1Cre/+, with Tp53-/- (D). E pHis, Green, combined with EdU (30 min post-injection, magenta). F Mutant brains with reduced signals. EdU and pHis staining in mutant brains with deleted Tp53 (G). H Hierarchical clustering of 581 genes which show differential gene expression. Heatmap of 581 annotated genes showing differential expression between three categories (Control-white, Mutant-Black, and Rescue-Gray. The Mutant samples (Red) are all homozygous for the floxed Hnrnpu allele. The rescue category (gray) includes a single genotype, Hnrnpufl/fl Tp53loxP/loxP (light blue). The “Control” category (white) includes four different genotypes Hnrnpufl/+ Tp53loxP/loxP (Blue) Hnrnpufl/+ Tp53loxP/+ (Purple), Hnrnpu+/+ Tp53loxP/loxP(Gray), and Hnrnpu+/+Tp53loxP/+ (Magenta). I Ingenuity pathway analysis of 148 DE genes in rescued brains vs. control (Red- Strong activation, Pink- activation) JR Coronal sections of E14 cortices from Control, Hnrnpu Mutant 2 carrying a single Tp53 deleted allele and Hnrnpu/Tp53 double mutant, stained for Reelin (Magenta), Tbr1 (Green) and CTIP2 (Red). Single Tp53 allele deletion (Mutant 2), stained with Rabbit N-ter Anti-hnRNP U antibody (Red) in the Control brain section (S) and Mutant 2 (T) and Rescue (U) samples. Tbr2 + (Red) in the VZ and sVZ (V), EdU + (Green), mutant cortices (W) and rescued brains (X). KI67 + in Control (Y), Mutant 2 (Z), and Rescued embryos (AA). Phalloidin 488 (Green) stains F-Actin in Control (AB) and mutant sections (Mutant 2, AC). F-actin belt (Phalloidin 488, Green) (Control Cortex, AB) in the mutant brain (Mutant 2, AC) and rescued cortices (AD). AE Proportion of EdU positive cells ±SEM (30 min pulse) counted in VZ/sVZ of control (blue), mutant (red) and rescued (green) cortices (n = 3). Nested t test. P values Control vs. Mutant p < 0.0001, Control vs. Rescue p < 0.0001, Mutant vs. Rescue p = 0.0067. **p < 0.01, ***p < 0.001, ****p < 0.0001. LV-lateral ventricle⊡ Size bar units are μM. Source data are provided as a Source Data file.
Fig. 6
Fig. 6. Srsf3 downregulation compensates for HNRNPU loss of activity.
A Images of E14 derived mouse cortex neurospheres electroporated with either px330 (CRISPR/CAS9 Control plasmid) or with two sgRNA sequences, for either Hnrnpu, Tp53, or Srsf3. When genes are targeted (Hnrnpu and Tp53 or Hrnrnpu and Srsf3), neurospheres grow to large sizes (DAPI, Blue) and incorporate EdU (Magenta) despite the accumulation of activated Caspase 3 (CC3, green). B Quantification of the size of neurospheres, two days post electroporation treated with the indicated combination of CRISPR/CAS9 sgRNA’s or overexpressing MDM2. Px330, n = 10 Hnrnpu sgRNA n = 12 Hnrnpu + Tp53 sgRNA n = 13 Hnrnpu + srsf3 sgRNA n = 11 Hnrnpu sgRNA +MDM2 n = 12 Tp53 sgRNA n = 11 Srsf3 sgRNA n = 12 MDM2 n = 12. Error bars ±SE. Analysis was done using ordinary one-way ANOVA with Dunnett’s multiple comparisons test. C Splice variants sensitive PCR of cDNA prepared from treated neurospheres (depicted in panels A and B) shows correction of the over-representation of MDM2 Exon 3 skipping splice variant (300 bp vs. 250 pb, actin band size: 150 bp). One-way ANOVA with Dunnett’s multiple comparison test. Adjusted p values vs. control: Hnrnpu < 0.0001, Hnrnpu+Tp53, Hnrnpu+ Srsf3 NS, Hnnrpu + MDM2 NS, Tp53 p = 0.0007, Srsf3 p = 0.0005, MDM2 p < 0.0001. Error bars (±SEM). D qPCR of the relative abundance of MDM2 isoforms in cultured Neurospheres (NS). Graphs depicted transcript levels, compared to control (p x 330, no sgRNA) of MDM2 splice variants (MDM2 lacking exon 3 (MDM2ΔE3)/MDM2 with retained E3 (MDM2) in NS treated with the indicated combination of CRISPR/CAS9 sgRNA’s, n = 6. Error bars (±SEM) are indicated. Coronal sections (60 μM) shows the location of radially migrating cortical neurons electroporated with the control plasmid (blue), Hnrnpu sgRNA (red), Srsf3 sgRNA (green), both genes (purple). E, F Distribution GFP + cells (%) in five horizontal bins across the cortex width (1 the most apical), Averages, and error bars (±SEM). VZ-Ventricular Zone, CP-cortical plate. Three biological repeats were used; 2–4 70 μM thick slices of comparable position were analyzed of each electroporated brain. Control n = 8, Hnrnpu sgRNA n = 11, Srsf3 sgRNA n = 9, Srsf3 + Hnrnpu sgRNA n = 7. Analysis was done using two-way ANOVA with Tukey’s multiple comparisons test. P values: **p < 0.01, ***p < 0.001, ****p < 0.0001, ns non significant. Source data are provided as a Source Data file.

Similar articles

Cited by

References

    1. Aylon, Y. & Oren, M. The paradox of p53: what, how, and why? Cold Spring Harb. Perspect. Med. 6, 1–15 (2016). - PMC - PubMed
    1. Ranjan, A. & Iwakuma, T. Non-canonical cell death induced by p53. Int. J. Mol. Sci.17, 2068–2077 (2016). - PMC - PubMed
    1. Wong FK, Marin O. Developmental cell death in the cerebral cortex. Annu. Rev. Cell Dev. Biol. 2019;35:523–542. doi: 10.1146/annurev-cellbio-100818-125204. - DOI - PubMed
    1. Mihalas, A. B. & Hevner, R. F. Clonal analysis reveals laminar fate multipotency and daughter cell apoptosis of mouse cortical intermediate progenitors. Development145, 1–6 (2018). - PMC - PubMed
    1. Degrassi, F., Damizia, M. & Lavia, P. The mitotic apparatus and kinetochores in microcephaly and neurodevelopmental diseases. Cells9, 49–67 (2019). - PMC - PubMed

Publication types

Substances

Grants and funding