. 2022 Jul 21;13(1):4197.
doi: 10.1038/s41467-022-31654-0.

A metagenomic DNA sequencing assay that is robust against environmental DNA contamination

Affiliations

A metagenomic DNA sequencing assay that is robust against environmental DNA contamination

Omary Mzava et al. Nat Commun. .

Abstract

Metagenomic DNA sequencing is a powerful tool to characterize microbial communities but is sensitive to environmental DNA contamination, in particular when applied to samples with low microbial biomass. Here, we present Sample-Intrinsic microbial DNA Found by Tagging and sequencing (SIFT-seq) a metagenomic sequencing assay that is robust against environmental DNA contamination introduced during sample preparation. The core idea of SIFT-seq is to tag the DNA in the sample prior to DNA isolation and library preparation with a label that can be recorded by DNA sequencing. Any contaminating DNA that is introduced in the sample after tagging can then be bioinformatically identified and removed. We applied SIFT-seq to screen for infections from microorganisms with low burden in blood and urine, to identify COVID-19 co-infection, to characterize the urinary microbiome, and to identify microbial DNA signatures of sepsis and inflammatory bowel disease in blood.


Conflict of interest statement

I.D.V., O.M., A.P.C., and A.C. have submitted a patent related to the present work. A.P.C., I.D.V., D.D., and J.R.L. are inventors on the patent US-2020-0048713-A1 titled “Methods of Detecting Cell-Free DNA in Biological Samples.” I.D.V. is a member of the Scientific Advisory Board of Karius Inc., Kanvas Biosciences and GenDX. J.R.L. received research support under an investigator-initiated research grant from BioFire Diagnostics, LLC. E.J.S. is a consultant for Axle Informatics. Remaining authors declare no competing interests.

Figures

Fig. 1
Fig. 1. SIFT-seq proof-of-principle.
a Experimental workflow. Tagging of sample-intrinsic DNA by bisulfite DNA treatment is performed directly on urine or plasma. Contaminating DNA introduced after the tagging step is identified based on lack of cytosine conversion. b Bioinformatics workflow. c Representative example of the cytosine fraction of mapped reads in an unfiltered (top) dataset, a read-level filtered dataset (middle) and a fully filtered dataset (bottom). d Number of reads assigned to Cutibacterium acnes (common environmental DNA contaminant) in ΦX174 DNA after conventional sequencing (green) and SIFT-seq (purple). e Deliberate contamination assay. Detection of known contaminants before (top) and after (bottom) filtering. f Number of reads assigned to contaminants. Boxes in the boxplots indicates 25th and 75th percentile, the band in the box indicated the median and whiskers extend to 1.5 × Interquartile Range (IQR) of the hinge. Outliers (beyond 1.5 × IQR) are plotted individually. Source data for (df) are provided as a Source Data file.
Fig. 2
Fig. 2. SIFT-seq applied to cell-free DNA in urine and plasma.
a Microbial abundance of 25 most abundant common contaminant genera (selected from the 68 genera) before and after SIFT-seq filtering in plasma and urine from six independent subject cohorts (Tx = transplant). Total abundance of all contaminant genera (b) and C. acnes (c) before and after SIFT-seq filtering (KUCP = Kidney Transplant cohort with positive urine culture, KUCN = Kidney Transplant cohort with negative urine culture, EPTx = Early Post Transplant cohort). Bray–Curtis dissimilarity index before (d) and after (e) filtering. Samples are organized by: sequencing batch, researcher performing the experiment, cohort, and biofluid. Boxes in the boxplots indicates 25th and 75th percentile, the band in the box indicated the median and whiskers extend to 1.5 × Interquartile Range (IQR) of the hinge. Outliers (beyond 1.5 × IQR) are plotted individually. ***p value < 0.001. Source data are provided as a source data file.
Fig. 3
Fig. 3. Application of SIFT-seq to urine.
a Heatmap of abundance of species (molecules per million, MPM, species with at least one read detected by BLAST) identified in patients with and without urine culture-confirmed UTIs, before and after application of SIFT-seq filter (black * indicates agreement with urine culture). b Boxplot of the relative number of microbe-derived molecules (MPM) in samples from patients with and without urine culture-confirmed UTIs, before and after SIFT-seq filtering. c (i) Sample collection timepoints after transplantation for 5 patients. (ii) Boxplot showing Bray–Curtis similarity index (as defined in c (i)) of the urine microbiome within individual patients and between patients before and after stent removal. Boxes in the boxplots indicates 25th and 75th percentile, the band in the box indicated the median and whiskers extend to 1.5 × Interquartile Range (IQR) of the hinge. Outliers (beyond 1.5 × IQR) are plotted individually. (* p value < 0.05, ** p value < 0.01,*** p value < 0.001). Source data for (ac(ii)) are provided as a source data file.
Fig. 4
Fig. 4. Application of SIFT-seq to plasma.
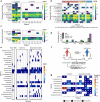
Heatmaps of the abundance of species identified in plasma from COVID-19 patients with and without culture confirmed (a) lung and (b) blood infection, before and after application of SIFT-seq filter (black * indicates agreement with culture; HCMV: Human cytomegalovirus, HSV-1: Herpes simplex virus 1). c A heatmap of abundance of species identified in the sepsis cohort before and after SIFT-seq filtering (black * indicates species identified by blood culture). d Barplot of the prevalence of Epstein-Barr Virus (EBV), Torque teno virus (TTV), malaria-causing, or shigellosis-causing microorganisms in different patient cohorts. e Heatmap of the abundance of species identified in matched stool and plasma cfDNA samples in patients diagnosed with Crohn’s disease or ulcerative colitis. f Schematic for matched stool and plasma samples from individuals before and after medical therapy. g Heatmap of the change in abundance of gut-specific bacteria before and after treatment. Source data are provided as a source data file.

Update of

References

    1. Glassing A, Dowd SE, Galandiuk S, Davis B, Chiodini RJ. Inherent bacterial DNA contamination of extraction and sequencing reagents may affect interpretation of microbiota in low bacterial biomass samples. Gut Pathog. 2016;8:24. doi: 10.1186/s13099-016-0103-7. - DOI - PMC - PubMed
    1. Weyrich LS, et al. Laboratory contamination over time during low-biomass sample analysis. Mol. Ecol. Resour. 2019;19:982–996. doi: 10.1111/1755-0998.13011. - DOI - PMC - PubMed
    1. Salter SJ, et al. Reagent and laboratory contamination can critically impact sequence-based microbiome analyses. BMC Biol. 2014;12:87. doi: 10.1186/s12915-014-0087-z. - DOI - PMC - PubMed
    1. Eisenhofer R, et al. Contamination in Low Microbial Biomass Microbiome Studies: Issues and Recommendations. Trends Microbiol. 2019;27:105–117. doi: 10.1016/j.tim.2018.11.003. - DOI - PubMed
    1. Davis NM, Proctor DM, Holmes SP, Relman DA, Callahan BJ. Simple statistical identification and removal of contaminant sequences in marker-gene and metagenomics data. Microbiome. 2018;6:226. doi: 10.1186/s40168-018-0605-2. - DOI - PMC - PubMed

Publication types