. 2022 Jul 21;13(1):4214.
doi: 10.1038/s41467-022-31799-y.

Engineered biomimetic nanoparticles achieve targeted delivery and efficient metabolism-based synergistic therapy against glioblastoma

Affiliations

Engineered biomimetic nanoparticles achieve targeted delivery and efficient metabolism-based synergistic therapy against glioblastoma

Guihong Lu et al. Nat Commun. .

Abstract

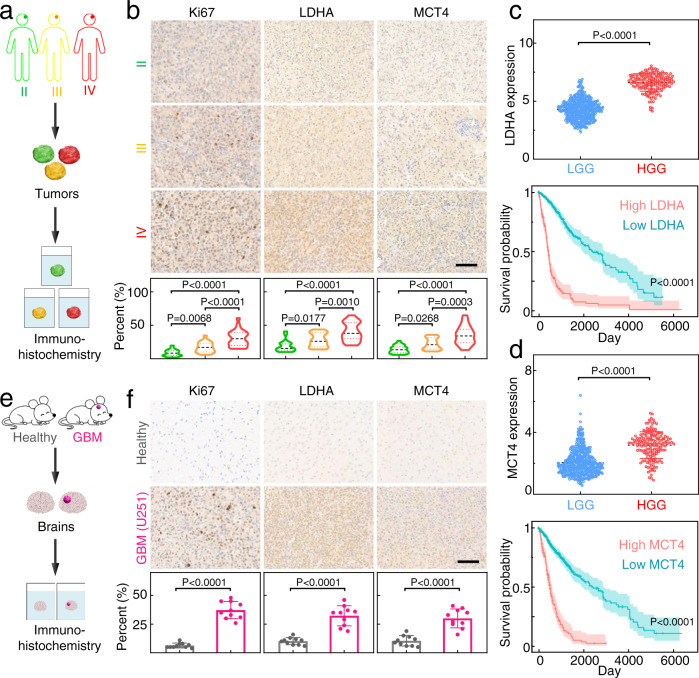
Glioblastoma multiforme (GBM) is an aggressive brain cancer with a poor prognosis and few treatment options. Here, building on the observation of elevated lactate (LA) in resected GBM, we develop biomimetic therapeutic nanoparticles (NPs) that deliver agents for LA metabolism-based synergistic therapy. Because our self-assembling NPs are encapsulated in membranes derived from glioma cells, they readily penetrate the blood-brain barrier and target GBM through homotypic recognition. After reaching the tumors, lactate oxidase in the NPs converts LA into pyruvic acid (PA) and hydrogen peroxide (H2O2). The PA inhibits cancer cell growth by blocking histones expression and inducing cell-cycle arrest. In parallel, the H2O2 reacts with the delivered bis[2,4,5-trichloro-6-(pentyloxycarbonyl)phenyl] oxalate to release energy, which is used by the co-delivered photosensitizer chlorin e6 for the generation of cytotoxic singlet oxygen to kill glioma cells. Such a synergism ensures strong therapeutic effects against both glioma cell-line derived and patient-derived xenograft models.


Conflict of interest statement

The authors declare no competing interests.

Figures

Fig. 1
Fig. 1. Schematic illustration of clinical and mice glioma analysis and M@HLPC construction for tumor inhibition.
a Analysis of lactate (LA) metabolism-associated indicators (lactate dehydrogenase A, LDHA; monocarboxylate transporter 4, MCT4) in tumor samples from patients and mice gliomas. b Schematic illustration of the construction of M@HLPC. The self-assembly NPs composed of oxygen-carrying Hb-O2, LOX, CPPO, and Ce6 (denoted as HLPC) are fabricated using a one-pot approach, followed by coating with the M prepared from glioma cells. c Targeted accumulation of M@HLPC in GBM and subsequent synergistic therapy upon the combination of LA metabolic therapy and chemiexcited PDT. M@HLPC are able to cross the BBB and actively target GBM due to the homotypic targeting ability of glioma cell membranes. After accumulation in the glioma site, the LOX in M@HLPC can selectively convert the intra-tumor LA into PA and H2O2 upon consumption of O2 carried by Hb (①). Furthermore, the in situ-produced PA can act as a signaling molecule to repress histone gene expression, delay cell cycle progression, and terminate cell proliferation. At the same time, the released H2O2 can react with CPPO to produce chemical energy, which can activate the photosensitizer Ce6 to generate 1O2 and induce cell apoptosis (②), achieving chemiexcited PDT without laser irradiation. This design enables M@HLPC to achieve targeted accumulation in GBM and then support both LA metabolic therapy and chemiexcited PDT in a synergistic manner.
Fig. 2
Fig. 2. Profiling of LA metabolism-associated indicators expression in gliomas obtained from patients or mice.
a Schematic illustration of LA metabolism-related indicators (LDHA and MCT4) analysis in tumor samples from glioma patients. b IHC images and quantitative analysis of the expression of Ki67, LDHA, and MCT4 in grade II, III, and IV gliomas resected from glioma patients (II: n = 22, III: n = 21, IV: n = 23). Scale bar: 100 μm. c Assessment of LDHA expression and the corresponding survival probability of glioma patients. Data from The Cancer Genome Atlas (TCGA) database, including 524 low-grade glioma (LGG) and 167 high-grade glioma (HGG) cases. Each dot represents an individual case. The OncoLnc tool was used to explore the relationship between survival probability and LDHA levels. d MCT4 expression and the corresponding survival probability of the same glioma samples in panel (c). The OncoLnc tool was used to explore the relationship between survival probability and MCT4 levels. e Schematic illustration of LA metabolism-related indicators analysis for brains from healthy and U251 CDX tumor-bearing mice. f IHC images and quantitative analysis for the expression of Ki67, LDHA, and MCT4 in brain samples from healthy mice and U251 CDX tumor-bearing mice (n = 1 experiment, n = 10 mice per group). Scale bar: 100 μm. Data in (bd, f) were presented as the mean ± SD. P values were calculated by using one-way ANOVA (b) or two-tailed unpaired Student’s t-test (c, d, f). Source data are provided in the Source data file.
Fig. 3
Fig. 3. Construction and characterization of M@HLPC.
a Fitted sigmoidal binding curve of temperature-jump microscale thermophoresis (MST) signal for Hb-CPPO, LOX-CPPO, Hb-Ce6, LOX-Ce6, and Hb-LOX interactions. b Schematic illustration of the preparation of HLPC and M@HLPC. c TEM images of HLPC and M@HLPC. M@HLPC was negatively stained with 2% phosphotungstic acid solution before imaging. Scale bar: 200 nm. d Size and zeta potential distribution of HLPC and M@HLPC analyzed using nanoparticle tracking analysis (NTA). e Confocal laser scanning microscopy (CLSM) images of HLPC and M@HLPC. Note that the Ce6 (inside the formed HLPC) is known to emit strong fluorescence (false colored in red here); the green signal was from DIO, which was used to label the coated M. Scale bar: 25 μm. f Stability of M@HLPC over the 8-day period in PBS or PBS with 10% FBS. g Particle size and zeta potential of M@HLPC before and after lyophilization/rehydration. h Oxygen release profiles of free Hb, M@LPC (lacking Hb-O2), and M@HLPC in hypoxic PBS, analyzed using a portable oxygen meter. i Reaction evolution of LA (5 mM) oxidation by M@LPC (lacking Hb-O2), M@HPC (lacking LOX), and M@HLPC, analyzed with Lactate and Pyruvate Assay Kit in hypoxic PBS. j ESR spectroscopy of M@LPC (lacking Hb-O2), M@HPC (lacking LOX), M@HLP (lacking Ce6), and M@HLPC in hypoxic PBS for analysis of 1O2 signal intensity upon addition of 5 mM LA. Data in (f), (h), (i) were presented as the mean ± SD, n = 3 independent samples. The experiments in (ce, g) were repeated independently three times with similar results. P values were calculated by using one-way ANOVA. Source data are provided in the Source data file.
Fig. 4
Fig. 4. In vitro homotypic tumor cell uptake and BBB penetration ability of M@HLPC.
a Schematic illustration, representative CLSM images, and corresponding flow cytometry analysis in the experiment testing homotypic tumor cell uptake of nanoparticles (NPs). Human cervical carcinoma cells (HeLa) or human glioma cells (U251, the source of M used in the coating for the M@HLPC) were incubated with the same concentrations of bare HLPC or M@HLPC. Red: NPs (Ce6 signal); blue: Hoechst 33342-labeled nuclei; green: Rhodamine phalloidin-labeled HeLa or U251 cells. Scale bar: 25 μm. b Schematic illustration, representative CLSM images, and corresponding flow cytometry analysis of an experiment examining the influence of the M source on the glioma cell homing ability. HLPC were coated with M harvested from the diverse cell lines (macrophage J774A.1, red blood cells (RBC), HeLa, U251), and then incubated with U251 cells. Red: NPs (Ce6 signal); blue: Hoechst 33342-labeled nuclei; green: Rhodamine phalloidin-labeled U251 cells. Scale bar: 25 μm. c Schematic illustration of the in vitro BBB model (Transwell™) for evaluating the potential BBB penetration ability of the bare HLPC and those coated with diverse M. d Representative CLSM images of the hCMEC/D3 monolayer, BBB layer, and U251 cells showed the penetration and targeting ability of various NPs. Red: NPs; blue: Hoechst 33342-labeled nuclei; green: DIO-labeled BBB layer cell membrane. Scale bar: 25 μm. e Quantification analysis of time-dependent internalization of NPs by U251 cells. Data in e were presented as the mean ± SD, n = 3 independent samples. The experiments in (a, b, d) were repeated independently three times with similar results. Source data are provided in the Source data file.
Fig. 5
Fig. 5. In vivo evaluation for the glioma-targeting of M@HLPC in orthotopic U251-luc glioma-bearing mice.
a Representative bioluminescence images and MRI transverse section view of small-size glioma-bearing mice at 9 days’ post tumor cell inoculation. The mice were randomly divided into two groups and i.v. injected with HLPC or M@HLPC for the subsequent distribution analysis. Red circles: tumor regions. b In vivo distributions and the signal profiles of HLPC or M@HLPC in small-size U251-luc glioma-bearing Balb/c nude mice at different time points post i.v. injection. The fluorescence signals originate from Ce6 inside the formed NPs. c Representative ex vivo fluorescence images and corresponding quantitative fluorescence analysis of major organs and glioma tumors dissected from glioma-bearing mice at 24 h after i.v. injection with HLPC or M@HLPC. d In vivo two-photon images indicating the diffusion of HLPC and M@HLPC across the brain microvascular endothelial cells. Red: Tetramethylrhodamine isothiocyanate dextran-labeled blood vessels; green: NPs. Scale bar: 50 μm. e Representative fluorescence images of frozen brain sections at 24 h post NPs injection showed the effective accumulation of M@HLPC as yellow arrows indicated in the enlargement. Blue: Hoechst 33342-labeled nuclei; green: NPs. Scale bar: 50 μm. f Representative bioluminescence images and MRI transverse section view of large glioma-bearing mice at 18 days’ post U251 tumor cell inoculation. The mice were randomly divided into two groups and i.v. injected with HLPC or M@HLPC for the subsequent analysis of distributions. Red circles: tumor regions. g In vivo distributions and the signal profiles of HLPC or M@HLPC in large-size U251-luc glioma-bearing Balb/c nude mice at different time points post i.v. injection. The fluorescence signals originate from Ce6 inside the formed NPs. Quantitative data in (b, c, g) were presented as the mean ± SD, n = 1 experiment, n = 3 mice per group. Images were representative of three independent mice. P values were calculated by using two-tailed unpaired Student’s t-test. Source data are provided in the Source data file.
Fig. 6
Fig. 6. In vitro evaluation of the synergistic therapeutic effects of M@HLPC against hypoxic U251 cells.
a Heat map showing the differentially expressed genes in M@HLPC + LA-treated and LA-treated U251 cells. Exogenous 5 mM LA was added to enhance the LA level in the cultured U251 cells. b Kyoto Encyclopedia of Genes and Genomes (KEGG) enrichment analysis of the differentially-expressed genes between M@HLPC + LA and LA treatment groups. c Quantitative analysis of PA concentration in U251 cells receiving the following different treatments: PBS, LA, M@HLPC, or M@HLPC + LA. d Intracellular NAMPT and histones (H2A, H2B, and H4) levels in U251 cells analyzed by ProteinSimple WesTM Capillary Western Blot analyzer. The original data were provided in Supplementary Fig. 14. e Analysis of the NAD+/NADH ratio in U251 cells using NAD+/NADH Assay Kit. f Cell-cycle progression with different treatments, determined by flow cytometry. G1, S, and G2 represented G1 phase, S phase, and G2 phase of cell division cycle, respectively. All cells were synchronized to the G1 phase with 1.5 mM HU before subjecting to the indicated treatments. g Flow cytometry and corresponding quantitative analysis of U251 cell proliferation by Ki67 staining. h Representative CLSM images and corresponding quantitative analysis of DCFH-DA for the generation of 1O2 in U251 cells receiving the indicated treatments. Scale bar: 50 μm. i Flow cytometry and corresponding quantitative analysis of the extent of U251 cell apoptosis by Annexin V/PI staining. j Proportions of U251 cells that were alive (gray), proliferation termination (blue), or apoptosis (red) after the indicated treatments. Data of proliferation termination and apoptosis were derived from (g), (i), respectively. k Relative cell viability of U251 cells after the indicated treatments for cultures supplemented with the indicated M@HLPC concentrations. LA: 5 mM. Quantitative data in (c), (e), (gi), (k) were presented as the mean ± SD, n = 3 independent samples. The experiments in (d), (h) were repeated independently three times with similar results. P values were calculated by using one-way ANOVA. Source data are provided in the Source data file.
Fig. 7
Fig. 7. In vivo evaluation of the synergistic therapeutic effects of M@HLPC in U251-luc tumor-bearing mice.
a Experimental design for evaluating the efficiency of tumor inhibition upon treatment with PBS, M@HLP, M@HPC, or M@HLPC in U251-luc tumor-bearing mice. b Bioluminescence images of U251-luc cells in glioma-bearing Balb/c nude mice receiving different treatments at the indicated time points. The blank area indicated that the corresponding mouse had died. c Quantification of the bioluminescence signal intensity from bioluminescence images on days 9, 12, 15, 18, 21, and 24. d Survival curves of the glioma-bearing mice receiving different treatments. e Body-weight change curves in mice receiving different treatments. f LA and PA concentrations in tumor tissue after i.v. injection of the indicated agents. g Intracellular NAMPT and histones (H2A, H2B, and H4) levels in tumor tissue. The original data were provided in Supplementary Fig. 24. h Quantification of cell proliferation (indicated by Ki67) in tumor tissues. i Representative two-photon fluorescence images of DCFH-DA for the generation of 1O2 in tumor tissue after the indicated treatments. Scale bar: 50 μm. j Quantification of cell apoptosis (indicated by TUNEL) in tumor tissues. Data in (c, e, f, h, j) were presented as the mean ± SD, n = 1 experiment, n = 6 mice per group in (c) and (e); n = 3 mice per group in (f), (h), (j). Images in i were representative of three independent mice. P values were calculated by using one-way ANOVA (c, f, h, j), two-tailed unpaired Student’s t-test (e) or Log-rank tests (d). Source data are provided in the Source data file.
Fig. 8
Fig. 8. Evaluation of the synergistic therapeutic effect of hM@HLPC in patient-derived xenograft (PDX) model.
a Schematic illustration of the experimental design for humanized hM@HLPC construction, PDX model construction, and evaluation of the BBB penetration and tumor-targeting ability of hM@HLPC. b Super-resolution fluorescence and TEM images of hM@HLPC. i–iv: green, Ce6 (inside the formed HLPC); red, DIO-labeled the coated hM. Scale bar: 2 μm. v: hM@HLPC were negatively stained with 2% phosphotungstic acid solution for TEM imaging. Scale bar: 50 nm. Super-resolution fluorescence and TEM images indicated the presence of hM coating on HLPC. c Size and zeta potential of HLPC and hM@HLPC analyzed by dynamic light scattering (DLS). DLS showed an increase in the hydrodynamic diameter and reversed surface charge between the HLPC and hM@HLPC samples, indicating successful coating of the HLPC with hM. d SDS-PAGE analysis of (1) Hb, (2) LOX, (3) hM, (4) hM@HLPC, and (5) Marker. The copresence of Hb, LOX, and hM in hM@HLPC demonstrated the successful hM coating. e MRI transverse section view of GBM PDX tumor-bearing mice before treatment (left), in vivo distributions (middle), and the signal profiles (right) of HLPC or hM@HLPC in GBM PDX tumor-bearing mice at different time points after i.v. injection. f Schematic illustration for the evaluation of the tumor inhibition effects of hM@HLPC against the PDX model. g MRI transverse section view of GBM PDX tumor-bearing mice and corresponding quantification of the T1-weighted MRI signal of the tumor site at 7 and 21 days after i.v. injection of PBS, HLPC, or hM@HLPC. h Survival curves of GBM PDX tumor-bearing mice in different groups. Quantitative data in (c, e, g) were presented as the mean ± SD, n = 3 independent samples in (c); n = 1 experiment, n = 3 mice per group in (e); n = 1 experiment, n = 6 mice per group in (g). The experiments in (b, d) were repeated independently three times with similar results. P values were calculated by using two-tailed unpaired Student’s t-tests (e), one-way ANOVA (g), or Log-rank tests (h). Source data are provided in the Source data file.

Comment in

References

    1. Alexander BM, et al. Adaptive global innovative learning environment for glioblastoma: GBM AGILE. Clin. Cancer Res. 2018;24:737–743. doi: 10.1158/1078-0432.CCR-17-0764. - DOI - PubMed
    1. Zanders ED, Svensson F, Bailey DS. Therapy for glioblastoma: is it working? Drug Discov. Today. 2019;24:1193–1201. doi: 10.1016/j.drudis.2019.03.008. - DOI - PubMed
    1. Metwali H, Valenca MM. Intraoperative assistive technologies and extent of resection in glioma surgery: a systematic review of prospective controlled studies. Neurosurg. Rev. 2015;38:226–227. - PubMed
    1. Shergalis A, Bankhead A, Luesakul U, Muangsin N, Neamati N. Current challenges and opportunities in treating glioblastoma. Pharmacol. Rev. 2018;70:412–445. doi: 10.1124/pr.117.014944. - DOI - PMC - PubMed
    1. Yi HG, et al. A bioprinted human-glioblastoma-on-a-chip for the identification of patient-specific responses to chemoradiotherapy. Nat. Biomed. Eng. 2019;3:509–519. doi: 10.1038/s41551-019-0363-x. - DOI - PubMed

Publication types

Substances