. 2022 Jul 21;13(1):4220.
doi: 10.1038/s41467-022-31869-1.

Targeting retinoic acid receptor alpha-corepressor interaction activates chaperone-mediated autophagy and protects against retinal degeneration

Affiliations

Targeting retinoic acid receptor alpha-corepressor interaction activates chaperone-mediated autophagy and protects against retinal degeneration

Raquel Gomez-Sintes et al. Nat Commun. .

Abstract

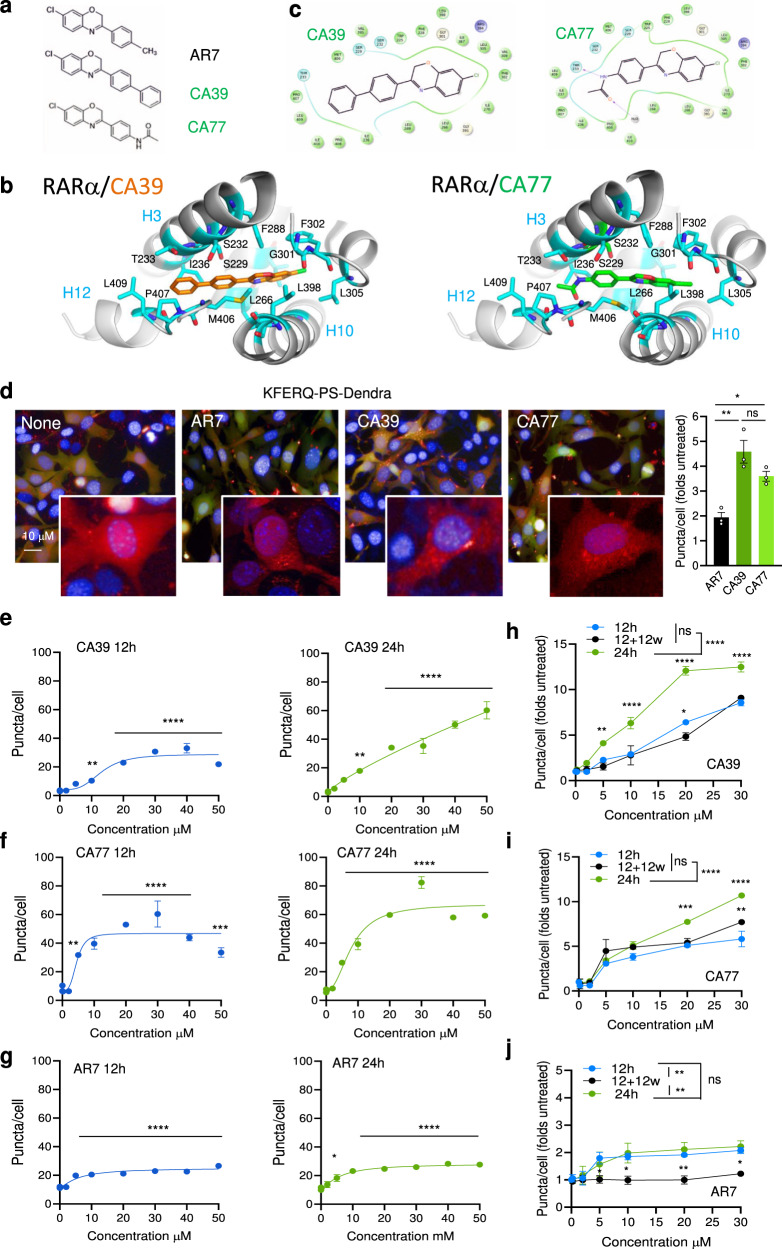
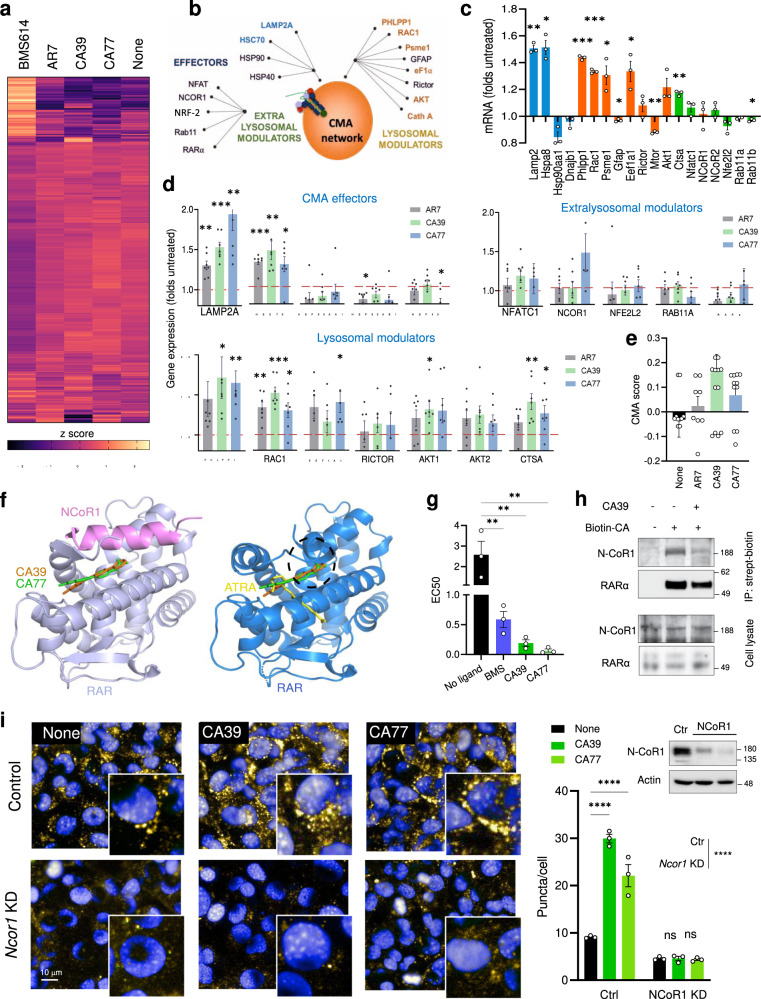
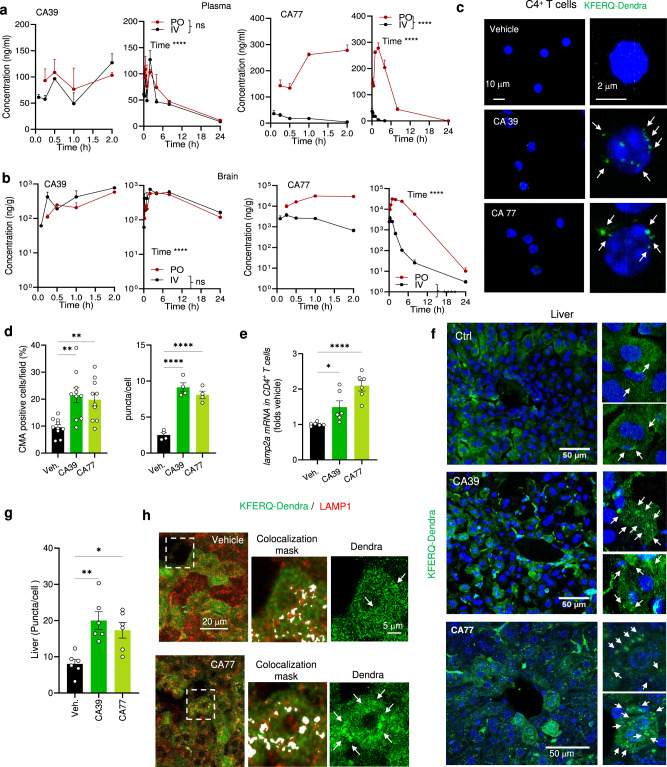
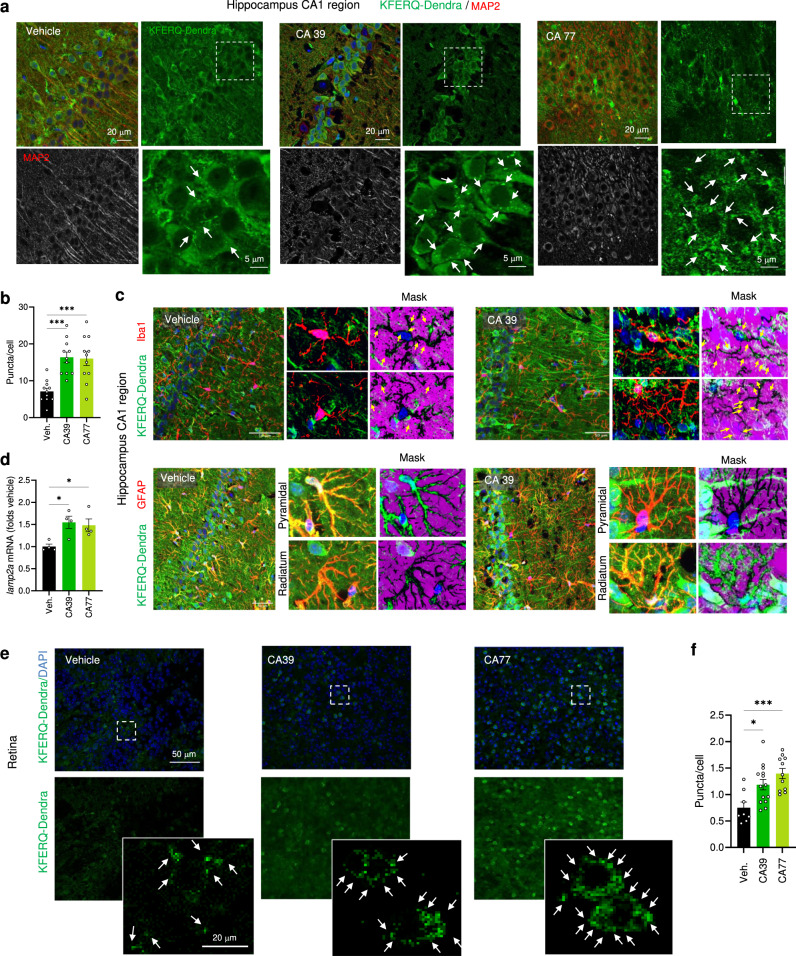
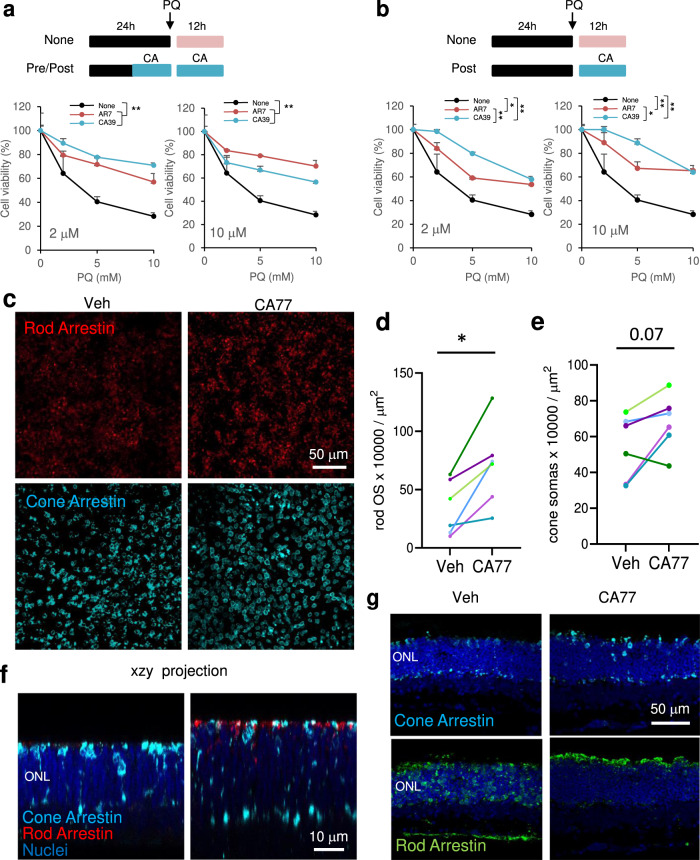
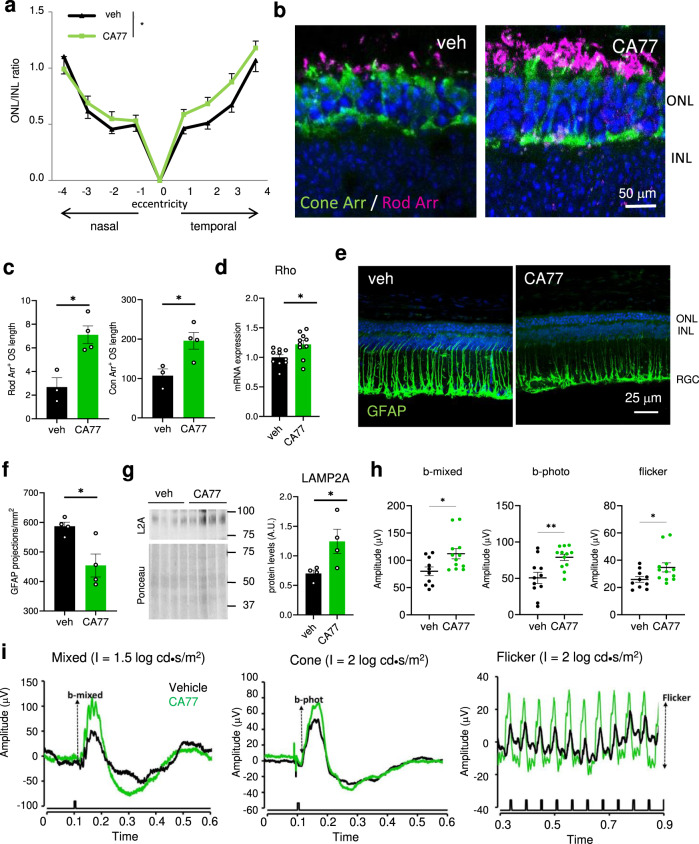
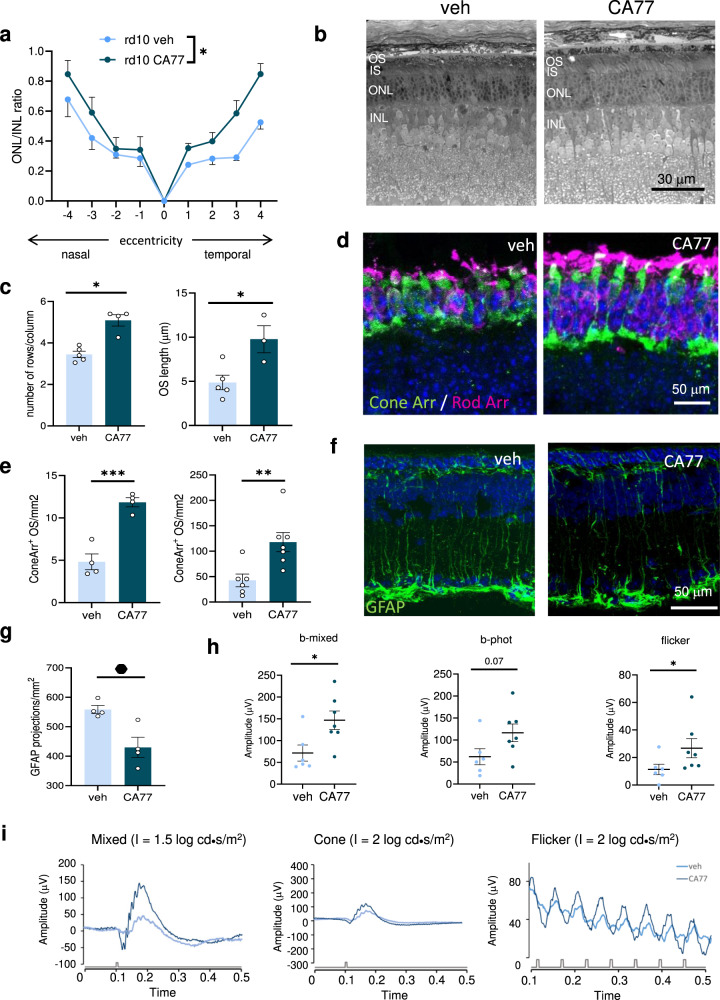
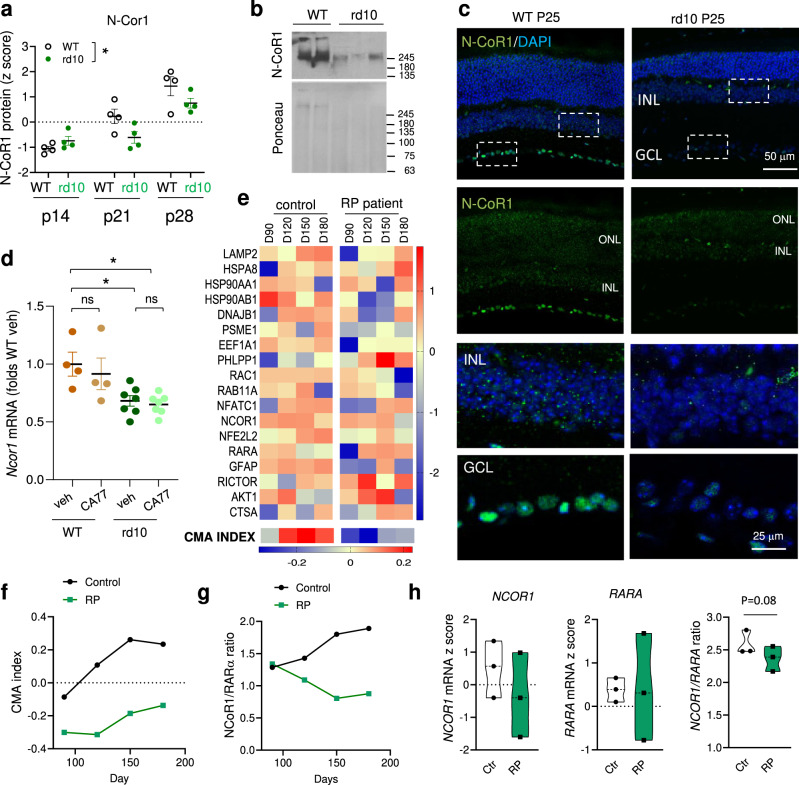
Chaperone-mediated autophagy activity, essential in the cellular defense against proteotoxicity, declines with age, and preventing this decline in experimental genetic models has proven beneficial. Here, we have identified the mechanism of action of selective chaperone-mediated autophagy activators previously developed by our group and have leveraged that information to generate orally bioavailable chaperone-mediated autophagy activators with favorable brain exposure. Chaperone-mediated autophagy activating molecules stabilize the interaction between retinoic acid receptor alpha - a known endogenous inhibitor of chaperone-mediated autophagy - and its co-repressor, nuclear receptor corepressor 1, resulting in changes of a discrete subset of the retinoic acid receptor alpha transcriptional program that leads to selective chaperone-mediated autophagy activation. Chaperone-mediated autophagy activators molecules activate this pathway in vivo and ameliorate retinal degeneration in a retinitis pigmentosa mouse model. Our findings reveal a mechanism for pharmacological targeting of chaperone-mediated autophagy activation and suggest a therapeutic strategy for retinal degeneration.


Conflict of interest statement

AMC and EG are co-founders and scientific advisory board members of Selphagy Therapeutics (Life Biosciences, MA). AMC consults for Generian Pharmaceutics and Cognition Therapeutics. CA compounds are under US patent US9512092 (EG, AMC, QX). All other authors declare no competing interest.

Figures

Fig. 1
Fig. 1. CA39 and CA77 activate CMA in a dose-dependent manner.
a Chemical structure of AR7, CA39, and CA77. b Molecular docking of CA39 (orange sticks) and CA77 (green sticks) in the binding pocket of inactive RARα (PDB ID: 1DKF). c Interaction map showing predicted RARα amino acid interactions with CA39 and CA77. d CMA activity in NIH3T3 stably expressing the KFERQ-PS-Dendra after incubation with AR7, CA39, or CA77. Representative images of cells treated with 20 μM of each compound. Nuclei are highlighted with DAPI. Inserts shows higher magnification of the red channel. Right shows the comparison with activation of CMA by AR7. n = 3 independent experiments (>1,500 cells counted). eg Quantification of CMA activity in the same cells upon addition of increasing concentrations of CA39 (e), CA77 (f) or AR7 (g) for 12 (left) or 24 (right) hours. n = 4 independent experiments (>2,500 cells counted). hj Quantification of CMA activity in the same cells after addition of increasing concentrations of CA39 (h), CA77 (i) or AR7 (j) for 12, 24 h, and 12 h after washing (w) them out from the media. n = 3 independent experiments (>1,500 cells counted). All values are mean + s.e.m. One-way ANOVA (dg) or two-way ANOVA (h, j) followed by Bonferroni’s multiple comparisons post-hoc test were used. Significant differences with untreated samples are indicated in e and among the different incubation protocols in f. **p < 0.01, ***p < 0.001, ****p < 0.0001. ns: not significant. Source data and exact p values are provided as a Source Data file.
Fig. 2
Fig. 2. CA induce discrete transcriptional changes by promoting the interaction of RARα and N-CoR1.
a Heat map of the transcriptional changes in NIH3T3 cells cultured without additions (None) or with 20μM AR7, CA39, CA77, or BMS614 for 24 h. bd Effect of CA in components of the CMA network (b). Changing components highlighted in bold. c AR7-induced changes in expression of CMA network components. n = 3 different experiments. d, e mRNA levels of the CMA network components by qPCR (d) and calculated CMA activation score (e) in cells treated as in a. n = 7 independent experiments. f Molecular docking of CA39 (orange) and CA77 (green) is compatible within the inactive (left) conformation of RARα (lilac) bound to N-CoR1 peptide (pink) (PDB ID: 3KMZ). RARa active (blue) conformation is shown for comparison. ATRA (yellow) binds only to the active conformation. Hypothetical binding poses of CA39 (orange) and CA77 (green) are not compatible within the active conformation of RARα due to steric clash (black dashed circle). g EC50 (μM) in fluorescence polarization assays with RARα and the N-CoR1 peptide incubated without additions (no ligand) or in the presence of 10 μΜ of BMS394 (BMS), CA39, and CA77. n = 3 experiments. h Immunoblot for N-CoR1 and RARα of streptavidin pulldowns (top) or total cellular lysates (bottom) of NIH3T3 incubated without additions or with CA39 (10 μM) or biotin-CA (10 μM) for 24 h. IP: immunoprecipitation. This experiment was repeated 3 times. i CMA activity in NIH3T3 cells control (empty vector) or knock-down (KD) for N-CoR1 incubated without additions (none) or with 20 μM CA39 or CA77 for 24 h. Left: representative images. Nuclei are highlighted with DAPI. Inserts: higher magnification. Right: Quantification of the number of puncta per cell. n = 3 different experiments (>2,500 cells counted). Inset: immunoblot for N-CoR1. Individual values and mean + s.e.m are shown. One sample t and Wilcoxon test was used in c and d and one-way ANOVA (g) or two-way ANOVA (i) followed by Bonferroni’s multiple comparisons post-hoc test. *p < 0.05, **p < 0.01, ***p < 0.001 and ****p < 0.0001. Uncropped blots are in Supplementary Fig. 10. Source data and exact p values are provided as a Source Data file.
Fig. 3
Fig. 3. CA compounds activate CMA in peripheral tissues in vivo.
a, b Levels of CA39 and CA77 at the indicated times in plasma (a) or brain (b) after p.o. (oral, 30 mg/kg bw) and i.v. (intravenous, 1 mg/kg bw) administration in mice. Graph show early (left) and late (right) time points. n = 3 mice per time point. c Direct fluorescence in CD4 + T cells isolated from blood from KFERQ-Dendra mice i.p. injected daily with (30 mg/kg bw) CA39 or CA77 for three consecutive days. Nuclei are highlighted in blue by DAPI. Right: higher magnification images. Arrows: puncta. d Percentage of CD4 + T cells with CMA puncta >3 per cell (CMA + ). n = 5 mice per condition. e mRNA levels of lamp2a in CD4 + T cells activated for 24 h in the presence of CA39 or CA77 (10 μM). Values are expressed relative to untreated cells (None) after normalization by the housekeeping gene actin. Biological triplicates from 2 independent experiments. f Representative images of livers from KFERQ-Dendra mice i.p. injected with vehicle, CA39 or CA77 as in c. Nuclei are highlighted in blue by DAPI. Insets: higher magnification of sections. Arrows: Dendra+ puncta. g Quantification of the average number of puncta per cell in liver. n = 12 sections from 4 different mice. h Representative images of liver sections from mice treated as in c with vehicle or CA77 and co-stained with LAMP1. Merged channels and higher magnification inset of merged with colocalization mask or Dendra fluorescence channel are shown. Arrows: coincidence of fluorophores in puncta. All values are mean + s.e.m. Two-way ANOVA followed by Sidak‘s multiple comparisons post-hoc test was used in (a, b), and one-way ANOVA followed by Bonferroni’s multiple comparisons post-hoc test in d, e, and g *p < 0.05, **p < 0.01 and ***p < 0.001 and ****p < 0.0001. ns: not significant. Source data and exact p values are provided as a Source Data file.
Fig. 4
Fig. 4. CA compounds activate CMA in CNS and retina in vivo.
a Representative images of the hippocampus (CA1 region) from KFERQ-Dendra mice i.p. injected with vehicle, CA39 or CA77 daily with (30 mg/kg bw) for three consecutive days co-stained with MAP2. Merged and individual channels are shown. Inset: higher magnification of the boxed area. Arrows: Dendra+ puncta. b Quantification of the number of Dendra+ puncta per MAP2 + cell. n = 12 sections from 4 different mice. c Representative images of the hippocampus (CA1 region) from KFERQ-Dendra mice i.p. injected with vehicle or CA39 as in a co-stained with Iba1 (top) or GFAP/S100 (bottom). Merged channels are shown. Insets: higher magnification to highlight individual cells (left) and inverted mask for the Iba1 (top) or GFAP (bottom) channel to better appreciate Dendra+ puncta. d mRNA levels of lamp2a in the same brain regions as in a. n = 4 mice per condition. e Representative images of flat-mounted retinas from KFERQ-Dendra mice treated as in c. Nuclei are highlighted with DAPI on the top. Insets: higher magnification images. Arrows: Dendra+ puncta. f Quantification of the number of Dendra+ puncta per cell. n = 14 fields from 3 independent experiments. All values are mean + s.e.m. One-way ANOVA followed by Bonferroni’s multiple comparisons posthoc test was used in b, d, f. *p < 0.05 and ***p < 0.001. Source data and exact p values are provided as a Source Data file.
Fig. 5
Fig. 5. CA compounds are cytoprotective in cells and tissues.
a Cell viability of NIH3T3 exposed to the indicated concentrations of paraquat (PQ) after 12 h treatment with 2 μM (left) or 10 μM (right) the indicated compounds. The treatment with PQ alone (None) or in the presence of the compounds lasted 12 h. n = 3 independent experiments. b Cell viability of NIH3T3 simultaneously exposed to the indicated concentrations of paraquat (PQ) and 2 μM (left) or 10 μM (right) of the indicated compounds for 12 h. n = 3 independent experiments. c Immunostaining for the indicated markers of rods and cones in whole-mount retinas from rd10 mice maintained without additions (right eye; Vehicle (Veh.)) or in the presence of CA77 (left eye) for 72 h. Right: Quantification of the OS stained for rod arrestin (d) or number of cone arrestin-positive somas per field (e) in retinas from the right and left eye of each animal. n = 8 mice (representative experiment from 3 independent experiments). All values are mean + s.e.m. f Orthogonal xzy projection corresponding to the areas above show from a different angle to better appreciate preserved ONL and rod and cone OS in CA77 compared to vehicle-treated mice. g Images showing staining with rod and cone arrestin in standard 12 µm-cryosections show comparable results to those obtained by whole-flat mounts. Two-way ANOVA followed by Bonferroni’s multiple comparisons posthoc test was used in a and b. Significant differences between treatments are shown in the legend and specific differences between treatment for a given PQ concentration in the figure. Data from the three independent experiments in d to compare the effect of vehicle and CA77 on arrestin OS counts or cone arrestin soma numbers, were analyzed by paired two tailed t test. *p < 0.05 and **p < 0.01. Source data and exact p values are provided as a Source Data file.
Fig. 6
Fig. 6. CA compounds prevent rd10 retinas degeneration.
a Ratio of the thickness of the outer nuclear layer (ONL) and inner nuclear layer (INL) in retinas of rd10 mice treated from P18 to P25 with daily i.p. injection of the vehicle only or 40 mg/kg bw of CA77. n = 8 (vehicle) and 9 (CA treated), from 3 independent experiments. b Cone (green) and rod (magenta) arrestin markers in temporal central retina of rd10 mice treated as in a. Nuclei are highlighted with DAPI. c Quantification of outer segment (OS) length of the rods (left) and number of cones (right) measured in the whole retina with the markers used in b. n = 4 areas per animal, 4 mice per condition. d mRNA levels of rho in the same animals used in a. n = 10. e, f Representative image of the immunostaining for GFAP in the same retinas (e) and corresponding quantification of the GFAP projections (f). n = 4. g Immunoblot for the indicated proteins in retinas of mice treated as in a. 4 different mice are shown. Right: Densitometric quantification of L2A in n = 4 different mice. Values are expressed as arbitrary units. h, i Electroretinogram wave amplitudes at P33 from rd10 mice injected with CA77 or vehicle as in a (h) measured as shown in the traces (i). n = 10 veh and 12 CA77. Individual values and mean + s.e.m. are shown. Two-way ANOVA followed by Bonferroni’s multiple comparisons post-hoc test was used in a, and unpaired two-tailed t test in all others. *p < 0.05 and **p < 0.01. Uncropped blots are in Supplementary Fig. 10. Source data and exact p values are provided as a Source Data file.
Fig. 7
Fig. 7. Single intravitreal CA77 injection reproduces neuroprotection obtained with systemic CA77 administration.
a Spider graphs of the ratio of the thickness of the outer nuclear layer (ONL) and inner nuclear layer (INL) in retinas of rd10 mice 7 days after receiving at P18 a single intravitreal injection of CA77 (40 µM) or vehicle. n = 4 (vehicle) and 7 (CA treated), from 3 independent experiments. b, c Toluidine blue staining in plastic embedded sections from the same animals. Representative images (b) and quantification of the number of rows per column (left) and OS length (right) in the semithin sections (c) are shown. n = 4 animals. d, e Cone (green) and rod (magenta) staining in cryosections of rd10 mice treated as in a. Representative images (d) and quantification of rod (left) and cone (right) arrestin in outer segment (OS) (e) are shown. Nuclei are highlighted with DAPI. n = 4 (for rod arrestin) and 6 (for cone arrestin) mice per condition. f, g Representative image of the immunostaining for GFAP in the same retinas (f) and corresponding quantification of the GFAP projections (g). n = 4. h, i Electroretinographic responses of rd10 mice intravitreally injected with CA77 or vehicle. Wave amplitudes (h) and representative waves of electroretinograms (i) are shown. n = 6 veh and 7 CA77. Individual values and mean + s.e.m. are shown. ANOVA of repeated measures was applied to data in a. Two-sided unpaired t-test was applied in the rest of analysis shown. *p < 0.05, **p < 0.01 and ***p < 0.001. Source data and exact p values are provided as a Source Data file.
Fig. 8
Fig. 8. N-CoR1 expression is reduced in retinitis pigmentosa.
a Protein levels of N-CoR1 in retinas from wild type (WT) and rd10 mice at the indicated postnatal (P) days. Data from. Values are expressed as Z score. n = 4 mice/genotype/time. b Immunoblot for N-CoR1 in retinas of 2 WT and 3 rd10 mice. Ponceau staining is shown as loading control. c Immunostaining for N-CoR1 in cyrosections of WT and rd10 mice retinas at p25. Nuclei are highlighted with DAPI. Merged (DAPI and N-CoR1) (top) and single (N-CoR1) (bottom) images. Bottom: Higher magnification of boxed regions from the inner nuclear layer (INL) (top) and in the ganglion cell layer (GCL) (bottom). d Ncor1 mRNA levels in WT and rd10 mice treated from P18 to P25 with daily i.p. injection of vehicle or CA77 (40 mg/kg bw). Values are expressed as folds WT vehicle. n = 4 (WT) and 7 (rd10) mice. e Heat map of CMA network genes expression in retinal organoids from healthy (Control) and retinitis pigmentosa patients (RP) bearing the PDE6B mutation. D: days of organoid differentiation. D90-D180: features of mid-state disease; D230: features of late-state disease. CMA index is shown at the bottom. Data from. f, g CMA activation index (f) and ratio of NCOR1 to RARA mRNA levels (g) in the same samples as in e. RNA was isolated from 3-5 organoids from two independent differentiations. h mRNA levels of NCOR1 (left), RARA (middle) and NCOR1 to RARA ratio in retinal organoids from Control and RP patients bearing mutations in RP2 at D180. Data from n = 3 individuals per diagnosis (minima, maxima, center, bounds of box, whiskers and percentile, are detailed in the Source Data File). Individual values and mean + s.e.m. are shown. Two-way ANOVA was used in a, One-way ANOVA with Tukey’s multiple comparison post-hoc test in d and two-sided paired t test in h. *p < 0.05 and **p < 0.01. ns, not significant. Uncropped blots are in Supplementary Fig. 10. Source data and exact p values are provided as a Source Data file.

References

    1. Sala AJ, Bott LC, Morimoto RI. Shaping proteostasis at the cellular, tissue, and organismal level. J. Cell Biol. 2017;216:1231–1241. doi: 10.1083/jcb.201612111. - DOI - PMC - PubMed
    1. Kaushik S, Cuervo AM. Proteostasis and aging. Nat. Med. 2015;21:1406–1415. doi: 10.1038/nm.4001. - DOI - PubMed
    1. Brandvold KR, Morimoto RI. The chemical biology of molecular chaperones—implications for modulation of proteostasis. J. Mol. Biol. 2015;427:2931–2947. doi: 10.1016/j.jmb.2015.05.010. - DOI - PMC - PubMed
    1. Kaushik S, Cuervo AM. The coming of age of chaperone-mediated autophagy. Nat. Rev. Mol. Cell Biol. 2018;19:365–381. doi: 10.1038/s41580-018-0001-6. - DOI - PMC - PubMed
    1. Scrivo A, Bourdenx M, Pampliega O, Cuervo AM. Selective autophagy as a potential therapeutic target for neurodegenerative disorders. Lancet Neurol. 2018;17:802–815. doi: 10.1016/S1474-4422(18)30238-2. - DOI - PMC - PubMed

Publication types

Substances