. 2022 Sep;14(9):1013-1020.
doi: 10.1038/s41557-022-00995-0. Epub 2022 Jul 21.

A general design of caging-group-free photoactivatable fluorophores for live-cell nanoscopy

Affiliations

A general design of caging-group-free photoactivatable fluorophores for live-cell nanoscopy

Richard Lincoln et al. Nat Chem. 2022 Sep.

Abstract

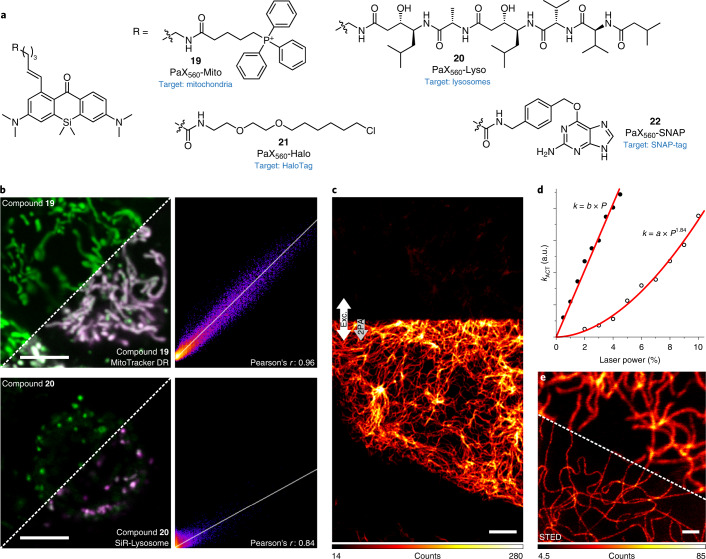
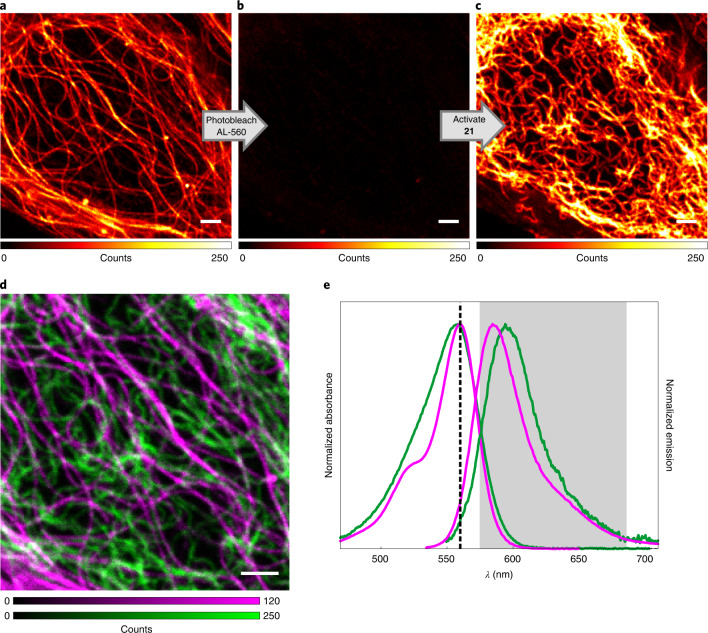
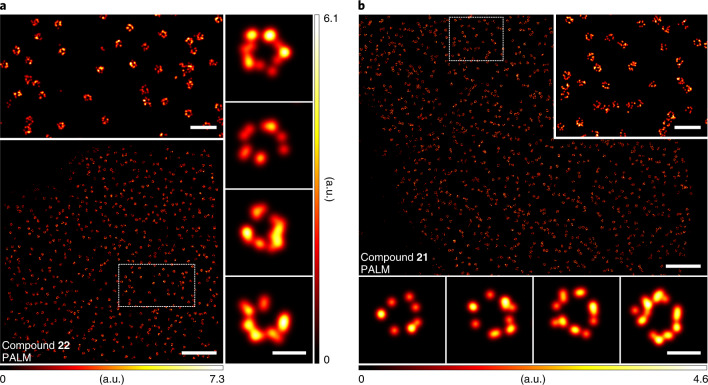
The controlled switching of fluorophores between non-fluorescent and fluorescent states is central to every super-resolution fluorescence microscopy (nanoscopy) technique, and the exploration of radically new switching mechanisms remains critical to boosting the performance of established, as well as emerging super-resolution methods. Photoactivatable dyes offer substantial improvements to many of these techniques, but often rely on photolabile protecting groups that limit their applications. Here we describe a general method to transform 3,6-diaminoxanthones into caging-group-free photoactivatable fluorophores. These photoactivatable xanthones (PaX) assemble rapidly and cleanly into highly fluorescent, photo- and chemically stable pyronine dyes upon irradiation with light. The strategy is extendable to carbon- and silicon-bridged xanthone analogues, yielding a family of photoactivatable labels spanning much of the visible spectrum. Our results demonstrate the versatility and utility of PaX dyes in fixed and live-cell labelling for conventional microscopy, as well as the coordinate-stochastic and deterministic nanoscopies STED, PALM and MINFLUX.


Conflict of interest statement

The authors declare the following competing financial interest(s): R.L., M.L.B. and A.N.B. are co-inventors of a patent application (International Patent Application No. PCT/EP2021/069804) covering the photoactivatable dyes of this work, filed by the Max Planck Society. S.W.H. owns shares of Abberior GmbH and Abberior Instruments GmbH, whose dyes and MINFLUX microscope, respectively, have been used in this study. The remaining authors declare no competing interests.

Figures

Fig. 1
Fig. 1. Design, synthesis and characterization of PaX dyes.
a, Whereas traditional strategies for photoactivatable dyes for nanoscopy rely on the release (‘unlocking’) of caging groups, our approach relies on the light-induced assembly (‘locking’) of a fluorophore. b, General structure of a PaX with a 1-alkenyl radical trap and its 9-alkoxypyronine photoproduct (closed-form, CF), and the proposed photoactivation mechanism. c, Synthetic route for the preparation of PaX. (1) B2pin2, [Ir(cod)(OMe)]2, AsPh3, n-octane, 120 °C, 22 h; (2) CuBr2, KF, pyridine, DMSO/H2O, 80 °C, 30 min; (3) RB(OH)2, RBpin or RBF3K (R = alkenyl), Pd(dppf)Cl2, K2CO3, dioxane/H2O, 80 °C, 3–18 h; (4) CH2Cl2/TFA 3:1, r.t., 1 h. d, Temporal evolution of the absorption and fluorescence spectra of 1 (1.66 µg ml−1) irradiated in phosphate buffer (100 mM, pH 7; λact = 405 nm). e, Comparative photoactivation kinetics of Si-bridged PaX 16, under the same conditions as in d. f, Comparative photoactivation kinetics of PaX dyes 912, under the same conditions as in d. Inset: magnified view of the 0–60 s time region. g, Comparative photoactivation kinetics of 11 (3.8 µM) in phosphate buffer (100 mM) at different pH values (λact = 405 nm). h, Photo-fatigue resistance of 11-CF and established commercial fluorophores, with similar spectral properties, measured in phosphate buffer (λexc = 530 nm). Source data
Fig. 2
Fig. 2. Photoactivatable labels for optical nanoscopy.
a, Structures of PaX560 derivatives for bioconjugation (13, 14) and actin labelling (15). b, STED (left) and PALM (right) images of microtubules in COS-7 cells labelled by indirect immunofluorescence with a secondary antibody bearing 13. Preactivation to 13-CF for STED imaging was achieved with widefield illumination (AHF analysentechnik AG, 4,6-diamidino-2-phenylindole filter set F46-816). c, Actin structures of the periodic membrane cytoskeleton in the axon of fixed primary hippocampal neuron cultures labelled with 15 and mounted in Mowiol. Preactivation to 15-CF for STED imaging was achieved with widefield illumination (AHF, enhanced green fluorescent protein (EGFP) filter set F46-002) followed by a 518-nm laser. Image data were smoothed with a 1-pixel low-pass Gaussian filter. d, PALM image of NPCs in COS-7 cells labelled via indirect immunofluorescence with an anti-NUP98 primary antibody and a secondary nanobody labelled with 14. Inset: magnified view of the region marked in the overview image. Bottom row: individual NPCs. e, PALM image of NPCs in HeLa-Kyoto cells expressing NUP107-mEGFP labelled with anti-GFP nanobodies conjugated to 14. Inset: magnified view of the region marked in the overview image. Bottom row: individual NPCs. Scale bars: 2 μm (be, main images), 500 nm (d,e insets), 50 nm (d, bottom row), 100 nm (e, bottom row).
Fig. 3
Fig. 3. Imaging with photoactivatable PaX labels in living cells.
a, Structures of PaX560 derivatives (1922) for live-cell imaging. b, Confocal images and corresponding Pearson correlation analysis of COS-7 cells co-incubated with 19 (200 nM) and MitoTracker Deep Red (50 nM, top row) or 20 (20 nM) and SiR-lysosome (200 nM, bottom row). Conversion to 19-CF and 20-CF was achieved with a 355-nm laser. c, Confocal image of vimentin filaments labelled with 21 (200 nM) in U2OS cells before activation (upper portion) and with two-photon activation (2PA) (lower portion, indicated by the arrows). d, Plot of activation rate versus laser power for a one-photon (355 nm, 0.3 µW at 100%) or two-photon activation laser (810 nm, 109 mW at 10%). The lines represent fits of activation rate kACT to a linear or quadratic function of power P for one- or two-photon activation with parameters b and a, respectively. e, Confocal (top) and STED (bottom) images of the same sample following activation by a 405-nm laser. Scale bars: 5 µm (b,c) and 1 µm (e). Source data
Fig. 4
Fig. 4. Channel duplexing with PaX labels.
ac, Confocal imaging of U2OS cells labelled with Abberior LIVE 560 tubulin (AL-560, 500 nM) and vimentin filaments labelled with compound 21 (100 nM) before (a) and after (b) photobleaching of AL-560 and after photoactivation by a 405-nm laser of 21 (c). d, Combined pseudo two-colour image showing tubulin (magenta) and vimentin (green) filaments obtained by sequential imaging (ac). e, Absorption and emission spectra of AL-560 (magenta) and 21-CF (green), with the excitation laser (dashed line) and detection window (grey) indicated. Scale bars, 2 µm (ad). Source data
Fig. 5
Fig. 5. PALM imaging of NPCs in living cells using self-labelling PaX560 substrates.
a, Bottom: PALM image of U2OS stably expressing a NUP107–SNAP-tag construct labelled with 22. Top: magnified view of the region marked in the overview image. Right column: magnified individual NPCs. b, Bottom: PALM image of U2OS cells stably expressing a NUP96-HaloTag construct labelled with 21. Inset: magnified view of the region marked in the overview image. Bottom row: magnified individual NPCs. Scale bars: 2 μm (a,b, main), 500 nm (a,b, top insets), 100 nm (a, right column; b, bottom row).
Fig. 6
Fig. 6. MINFLUX imaging of NPCs using PaX560.
a, MINFLUX image of NPCs in HeLa-Kyoto cells expressing NUP107-mEGFP labelled with anti-GFP nanobodies conjugated to 14. b, Individual NPCs, as marked in a. Scale bars: 500 nm (a) and 50 nm (b).

References

    1. Schmidt R, et al. MINFLUX nanometer-scale 3D imaging and microsecond-range tracking on a common fluorescence microscope. Nat. Commun. 2021;12:1478. doi: 10.1038/s41467-021-21652-z. - DOI - PMC - PubMed
    1. Strauss S, Jungmann R. Up to 100-fold speed-up and multiplexing in optimized DNA-PAINT. Nat. Methods. 2020;17:789–791. doi: 10.1038/s41592-020-0869-x. - DOI - PMC - PubMed
    1. Sahl SJ, Hell SW, Jakobs S. Fluorescence nanoscopy in cell biology. Nat. Rev. Mol. Cell Biol. 2017;18:685–701. doi: 10.1038/nrm.2017.71. - DOI - PubMed
    1. Balzarotti F, et al. Nanometer resolution imaging and tracking of fluorescent molecules with minimal photon fluxes. Science. 2017;355:606–612. doi: 10.1126/science.aak9913. - DOI - PubMed
    1. Dempsey GT, Vaughan JC, Chen KH, Bates M, Zhuang X. Evaluation of fluorophores for optimal performance in localization-based super-resolution imaging. Nat. Methods. 2011;8:1027–1036. doi: 10.1038/nmeth.1768. - DOI - PMC - PubMed

Publication types