. 2022 Aug;54(8):1214-1226.
doi: 10.1038/s41588-022-01120-0. Epub 2022 Jul 21.

Loss of FOCAD, operating via the SKI messenger RNA surveillance pathway, causes a pediatric syndrome with liver cirrhosis

Affiliations

Loss of FOCAD, operating via the SKI messenger RNA surveillance pathway, causes a pediatric syndrome with liver cirrhosis

Ricardo Moreno Traspas et al. Nat Genet. 2022 Aug.

Abstract

Cirrhosis is usually a late-onset and life-threatening disease characterized by fibrotic scarring and inflammation that disrupts liver architecture and function. While it is typically the result of alcoholism or hepatitis viral infection in adults, its etiology in infants is much less understood. In this study, we report 14 children from ten unrelated families presenting with a syndromic form of pediatric liver cirrhosis. By genome/exome sequencing, we found recessive variants in FOCAD segregating with the disease. Zebrafish lacking focad phenocopied the human disease, revealing a signature of altered messenger RNA (mRNA) degradation processes in the liver. Using patient's primary cells and CRISPR-Cas9-mediated inactivation in human hepatic cell lines, we found that FOCAD deficiency compromises the SKI mRNA surveillance pathway by reducing the levels of the RNA helicase SKIC2 and its cofactor SKIC3. FOCAD knockout hepatocytes exhibited lowered albumin expression and signs of persistent injury accompanied by CCL2 overproduction. Our results reveal the importance of FOCAD in maintaining liver homeostasis and disclose a possible therapeutic intervention point via inhibition of the CCL2/CCR2 signaling axis.


Conflict of interest statement

Competing interests

P.B., A.M.B.-A., V.K., N.O.-H. and S.K. are employed by and receive a salary from Centogene AG (exome sequencing is among the commercially available tests). K.M.G. is founder and director of Suma Genomics (exome sequencing is among the commercially available tests). The remaining authors declare no competing interests.

Figures

Extended Data Fig. 1
Extended Data Fig. 1. Clinical data from patient F2-II:2 (France).
a, Photograph of the patient showing a triangular face, high forehead and plagiocephaly. b, Liver biopsy at 2 years and 4 months. Periodic acid Schiff staining (PAS, top left) showed elevated intrahepatocellular glycogen. Gordon and Sweet’s silver staining (bottom left) revealed some regions of the liver parenchyma with an abnormal reticular fiber pattern (yellow arrows). H&E staining (top middle and right) showed presence of fibrogenic connective tissue (black frame) and lipid vesicles in hepatocytes indicative of steatosis (green arrows). Picrosirius red staining (bottom middle and right) confirmed the presence of fibrotic bands (black frame) and highlighted the presence of pericellular collagen fibers among hepatocytes (white arrows). Scale bars, 50 μm (bottom left) and 25 μm (bottom right).
Extended Data Fig. 2
Extended Data Fig. 2. focad is maternally contributed in zebrafish.
a, Schematic diagram of the genomic structure of focad in zebrafish. Two germline deletion mutations were selected to generate focad knockouts using CRISPR-Cas9 technology. The focad gene comprises 44 exons (bars). The blue line highlights the region targeted by the CRISPR guide RNA (gRNA) in exon 4. Black arrows point where the genomic deletions of 7 (focadΔ7) and 8 (focadΔ8) base pairs have occurred, which result in out-of-frame alleles creating early stop codons. b, Temporal RT-qPCR quantification of the expression levels of focad relative to β-actin during the 7 days postfertilization. focad is maternally contributed to the egg. Data are presented as mean ± s.e.m. (n = 2 biological replicates of 30 to 50 embryos).
Extended Data Fig. 3
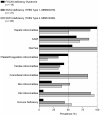
Extended Data Fig. 3. Overlap of the main clinical manifestations seen in FOCAD-deficient patients and THES type 1 and type 2.
Data related to both types of THES were extracted from Bourgeois et al..
Fig. 1
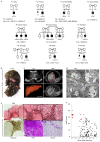
Fig. 1. Biallelic FOCAD mutations in 14 children diagnosed with pediatric liver disease.
a, Pedigrees of ten families segregating autosomal recessive liver disease. Filled black symbols indicate affected individuals. Crossed symbols indicate deceased individuals. Small black circles indicate miscarriage. Germline FOCAD variant coordinates are indicated below the pedigrees. Homozygous mutations are presented in bold. Compound heterozygous mutations are presented according to their parental origin. b, Explanted liver from patient F3-II:1 at 6 months showing collapsed lobules and severe cirrhosis. c, Abdominal ultrasound (US) and MRI from patient F3-II:1. US imaging (top left) showed a diffusely heterogeneous liver and a focal hyperechoic mass of 1.5 cm in diameter (yellow arrow). MRI without contrast (top right) revealed the heterogeneity and multinodularity of the liver parenchyma (delineated by a red line). Larger nodules ranging from 0.5 to 1.5 cm (white arrows) were visible with Eovist contrast (bottom right). A three-dimensional (3D) reconstruction of the liver (bottom left) showed a small and irregular organ with a mildly nodular surface. d, Liver electron microscopy (EM) images from patient F3-II:1. Hepatocytes appeared large in size with visible pericellular fibrosis (top left, yellow arrows) and abundant vesicular steatosis (top right, black arrows). Enlarged lysosomes containing flocculent materials were also observed (bottom). Scale bars, 5 μm (top left), 1 μm (top right), 300 nm (bottom left) and 150 nm (bottom right). e, Liver biopsy from patient F1-II:1 at 17 months. H&E staining (top) revealed a marked cirrhotic pattern. Hepatocytes showed moderate swelling with pale cytoplasm (top right). Reticulin staining (bottom left) showed broad septal fibrosis. PAS staining (bottom middle) revealed high levels of intracytoplasmic glycogen in hepatocytes, which was readily digested by diastase (PAS-D, bottom right). Scale bars, 150 μm (top left), 100 μm (top middle), 50 μm (bottom middle) and 25 μm (top right). f, FOCAD is intolerant to genetic variation: minor allele frequency (x axis) and CADD score (y axis) of homozygous FOCAD coding variants found in gnomAD v.2.1.1 (black dots, n = 135) and those found in each of the ten families (red dots, n = 13).
Fig. 2
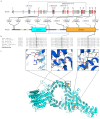
Fig. 2. FOCAD variants are predicted to be loss-of-function alleles.
a, Schematic diagrams of the genomic (top) and protein (bottom) structure of FOCAD in humans. The FOCAD protein contains two conserved domains of unknown function (blue, DUF3037; orange, DUF3028) and three predicted transmembrane domains (green). A total of 14 germline variants in FOCAD are indicated at the DNA and the protein levels. Homozygous mutations are shown in bold. Compound heterozygous mutations are linked by a blue line. b, Multiple sequence alignment for FOCAD protein in different species from fish to humans, showing the conservation of residues affected by missense mutations. c, Predicted 3D conformation for human FOCAD as predicted by AlphaFold (v.2). The three residues affected by missense mutations Arg563, Ala1232 and Leu1780 are embedded in α-helices. Arg563 forms a hydrogen bond with Pro559 through its amino group, a hydrogen bond with Val567 through its carboxyl group and three hydrogen bonds with Glu560 through its side chain. Ala1232 forms a hydrogen bond with Gly1228 through its amino group and a hydrogen bond with Ile1236 through its carboxyl group, while the side chain remains free. Leu1780 forms a hydrogen bond with Leu1776 through its amino group and a hydrogen bond with Leu1783 through its carboxyl group, with its side chain free. Nt, N terminus; Ct, C terminus.
Fig. 3
Fig. 3. focad loss in zebrafish compromises growth, fertility, lifespan and liver homeostasis, phenocopying the human syndrome.
a, Brightfield images of adult 3-month-old male zebrafish. MZ focadΔ7/Δ7 fish are smaller in size compared with focad+/Δ7 fish. Scale bar, 20 mm. b, Quantification of the body length, weight and BMI of focad+/Δ7 (n = 50) and MZ focadΔ7/Δ7 (n = 50) male zebrafish at 3 months of age. MZ focadΔ7/Δ7 animals are proportionally smaller. ****p < 0.0001; NS, nonsignificant (two-tailed unpaired t-test). c, Quantification of the number of viable offspring from focad+/Δ7 incrosses (n = 20) and MZ focadΔ7/Δ7 incrosses (n = 18). MZ focadΔ7/Δ7 mothers laid significantly fewer eggs. ****P < 0.0001 (two-tailed unpaired t-test). d, Kaplan–Meier survival curves of focad+/Δ7 (n = 100) and MZ focadΔ7/Δ7 (n = 100) zebrafish during 70 days. MZ focadΔ7/Δ7 animals showed a significant survival disadvantage. ****P < 0.0001 (Logrank Mantel-Cox test). e, Endogenous focad transcript levels were reduced by 75% in liver samples from MZ focadΔ7/Δ7 3-month-old male zebrafish. Fold change relative to WT is plotted as mean ± s.d. (n = 3 biologically independent liver samples). ***P = 0.0001 (two-tailed unpaired t-test). f, Western blot analysis of endogenous Focad protein in brain extracts from 3-month-old male zebrafish, using our custom-made antibody. Focad protein was not detected in the MZ focadΔ7/Δ7 zebrafish. g,h, Histological analysis of paraffin-embedded liver sections from 3-month-old male zebrafish. g, MZ focadΔ7/Δ7 livers presented with a heterogeneous and less compact parenchyma, with hepatocytes appearing more dissociated and of irregular shape. Hepatocellular cytoplasmic swelling with presence of vacuoles resembling hepatic lipidosis was noted by H&E staining (white arrows). Increased collagen content (blueish staining, yellow arrows) was revealed by Masson’s trichrome staining. Scale bars, 50 μm (lower magnification) and 20 μm (higher magnification). h, Significantly increased TUNEL staining was detected in MZ focadΔ7/Δ7 livers compared with WT livers. Left, Representative images. DAPI (blue), TUNEL (green). Scale bar, 20 μm. Right, Quantification of TUNEL+ cells. Data are plotted as mean ± s.d. (n = 3 biologically independent liver samples). **P = 0.0061 (two-tailed unpaired t-test). Unprocessed western blots are provided as source data.
Fig. 4
Fig. 4. focad knockout zebrafish livers show altered lipidomic and transcriptomic signatures.
a, OPLS-DA score plot from multivariate analysis of hepatic lipids in WT (n = 12) and MZ focadΔ7/Δ7 (n = 11) male zebrafish of 3 months of age, showing separation between both genotypes. b, Correlation coefficient plot from the lipidomics analysis. Red bars, upregulation; blue bars, downregulation of lipid species in MZ focadΔ7/Δ7 livers (n = 11) compared with WT livers (n = 12). PC, phosphatidylcholine; PE, phosphatidylethanolamine; SM, sphingomyelin; PI, phosphatidylinositol; PG, glycerophosphoglycerol; LPC, lysophosphatidylcholine. c-f, RNA-seq data from 3-month-old male zebrafish livers (n = 3). c, Heatmap showing the cluster analysis of DEGs in MZ focadΔ7/Δ7 versus WT livers. d, GO term enrichment analysis of the significant DEGs in MZ focadΔ7/Δ7 livers. e, Bubble plot showing the KEGG pathway enrichment analysis of the significant DEGs in MZ focadΔ7/Δ7 livers. The rich factor for each pathway (horizontal coordinates) was calculated as the ratio of the DEGs enriched in the pathway to the total number of genes annotated in the pathway. Q values were calculated with hypergeometric test. f, Volcano plot showing DEGs between MZ focadΔ7/Δ7 and WT livers. Red dots, top 68 upregulated transcripts; blue dots, top 100 downregulated transcripts. The P values were calculated using two-tailed Wald test (DESeq) and corrected for multiple comparisons using Benjamini and Hochberg’s approach. g, RT-qPCR quantification of the expression of some relevant DEGs (up, left; down, right) identified by RNA-seq using independent liver samples from 3-month-old male zebrafish. Results confirm the reliability of our RNA-seq data and provide further molecular evidence of the hepatic injury phenotype in MZ focadΔ7/Δ7 fish. Fold change relative to WT is plotted as mean ± s.d. (n = 3 biologically independent liver samples). *P < 0.05 (mhcluba: 0.0108; sh3bp5b: 0.0214); **P < 0.01 (mfap4: 0.0017; nlrp3l: 0.0058; coch: 0.0094; saa: 0.0023; hp: 0.0031; cyp3c2: 0.0018); ***P = 0.0008; ****P < 0.0001 (two-tailed unpaired t-test).
Fig. 5
Fig. 5. FOCAD localizes in the cytosol and its absence in patient-derived primary dermal fibroblasts leads to reduced SKIC2 protein levels.
a, Immunofluorescence staining of anti-MYC (green) in HEK293T cells transfected with the pcDNA3.1-MYC-FOCAD construct. MYC-FOCAD showed a cytosolic localization. Scale bar, 20 μm. b, Western blot for FOCAD protein (Ab.1, custom-made antibody) using cytosolic, ER/Golgi/Mito and nuclear protein extracts from WT primary dermal fibroblasts. Endogenous FOCAD was detected exclusively in the cytosolic fraction. β-TUBULIN, cytosolic marker; TGN46, Golgi network marker; BiP, ER marker; AK2 (adenylate kinase), Mito marker; LAMIN A/C, nuclear marker. c,d, Endogenous FOCAD expression analysis at the mRNA and protein levels in primary dermal fibroblasts from F1-II:1 (p.Arg863*; p.Arg563Cys, p.Ala1232Pro) and F2-II:2 (p.Lys1668Asn; p.Trp893Leufs*32) patients and two unrelated controls (WT1, WT2). c, FOCAD RNA transcripts were significantly reduced in F2-II:2 but remained unaltered in F1-II:1 compared with controls. Fold change relative to WT1 is plotted as mean ± s.d. (n = 3 biological replicates). ***P = 0.0007; NS, nonsignificant (ordinary one-way-ANOVA with Tukey test for multiple comparisons). d, Western blot analysis of endogenous FOCAD (Ab.1, custom-made antibody; Ab.2, Invitrogen, catalog no. PA5-63051) and SKIC2 proteins. Results showed that FOCAD protein levels were almost negligible in both patient cell lines, while SKIC2 protein levels were also drastically reduced. Unprocessed western blots are provided as source data.
Fig. 6
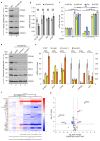
Fig. 6. Loss of FOCAD compromises the stability of the SKI complex, resulting in damaged hepatocytes.
a, Western blot analysis of endogenous FOCAD (Ab.2), SKIC2, SKIC3 and SKIC8 proteins in human hepatic stellate cells (LX-2 cell line). Decreased SKIC2 and SKIC3 protein levels were observed in the absence of FOCAD, whereas no overt difference was detected for SKIC8. b, Quantification of the expression of myofibroblast and ECM genes showed no alterations in the activation state of FOCAD knockout hepatic stellate cells. Fold change relative to WT is plotted as mean ± s.d. (n = 3 biological replicates). NS, nonsignificant (two-tailed unpaired t-test). c, Both WT and FOCAD knockout hepatic stellate cells were responsive to TGFβ1 (2.5 ngml−1 for 20 h), but there was no significant difference in the extent of the response between both genotypes. Data are presented as mean ± s.d. (n = 3 biological replicates). For the TGFβ1 treatment, fold change relative to the control condition for each genotype is plotted. For the control treatment data, fold change relative to WT is plotted. ****P < 0.0001; NS, nonsignificant (ordinary two-way ANOVA). d, Western blot analysis of endogenous FOCAD (Ab.2), SKIC2, SKIC3 and SKIC8 proteins in human embryonic hepatocytes (Hc3716-hTERT cell line). Absence of FOCAD resulted in reduced SKIC2 and SKIC3 protein levels, without affecting SKIC8. e, Loss of FOCAD expression in human embryonic hepatocytes led to the upregulation (left) and downregulation (right) of several genes involved in hepatocyte function, stress, regeneration and tumorigenesis. Fold change relative to WT is plotted as mean ± s.d. (n = 3 biological replicates). **P = 0.0012; ***P = 0.0003; ****P < 0.0001 (ordinary one-way ANOVA). f, Heatmap showing the Luminex cluster analysis of significantly dysregulated cytokines in the culture media of WT, FOCAD knockout polyclonal and FOCAD knockout monoclonal human hepatocyte cell lines. ***P = 0.0004; ****P < 0.0001 (ordinary two-way-ANOVA). g, Volcano plot showing differentially secreted cytokines between WT and FOCAD knockout monoclonal hepatocytes. The red dots represent the top three upregulated cytokines (log2(fold change) > 0.6, –log10(P) > 1.5); the blue dots represent the top eight downregulated cytokines (log2(fold change) < –0.6, –log10(Padj) > 1.5). The P values were calculated using two-tailed unpaired t-test. polyC, polyclonal population; monoC.1, monoclonal population 1; monoC.2, monoclonal population 2. Unprocessed western blots are provided as source data.

Comment in

References

    1. Elpek GÖ. Cellular and molecular mechanisms in the pathogenesis of liver fibrosis: an update. World J Gastroenterol. 2014;20:7260–7276. - PMC - PubMed
    1. Seki E, Brenner DA. Recent advancement of molecular mechanisms of liver fibrosis. J Hepatobiliary Pancreat Sci. 2015;22:512–518. - PMC - PubMed
    1. Friedman SL. Hepatic fibrosis—overview. Toxicology. 2008;254:120–129. - PubMed
    1. Ding B-S, et al. Divergent angiocrine signals from vascular niche balance liver regeneration and fibrosis. Nature. 2014;505:97–102. - PMC - PubMed
    1. Mederacke I, et al. Fate tracing reveals hepatic stellate cells as dominant contributors to liver fibrosis independent of its aetiology. Nat Commun. 2013;4:2823. - PMC - PubMed

Publication types