. 2022 Aug;54(8):1238-1247.
doi: 10.1038/s41588-022-01132-w. Epub 2022 Jul 21.

Hijacking of transcriptional condensates by endogenous retroviruses

Affiliations

Hijacking of transcriptional condensates by endogenous retroviruses

Vahid Asimi et al. Nat Genet. 2022 Aug.

Abstract

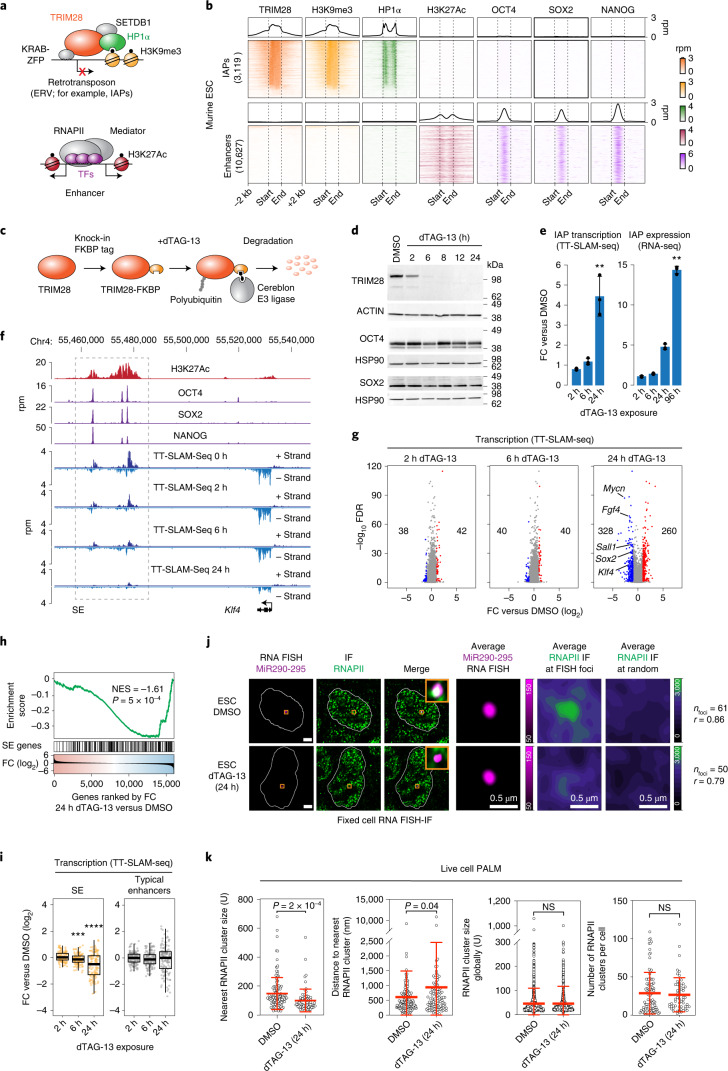
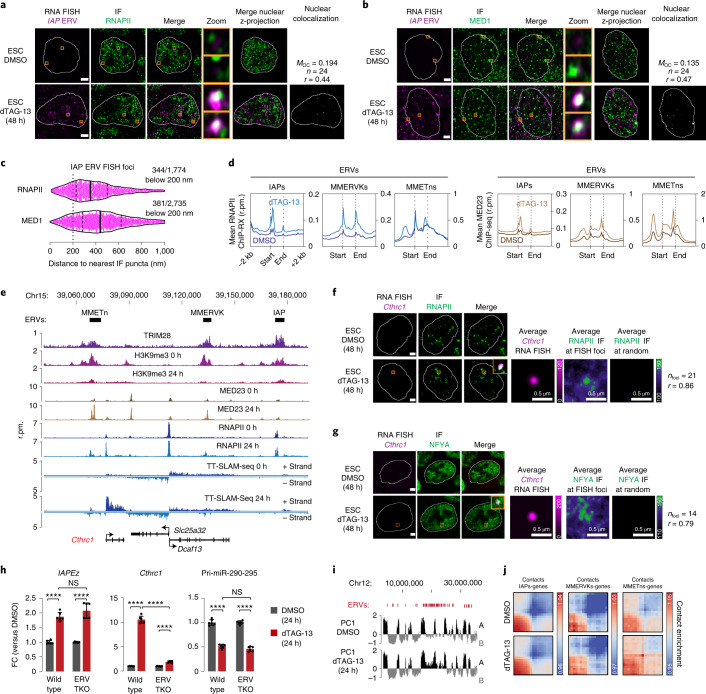
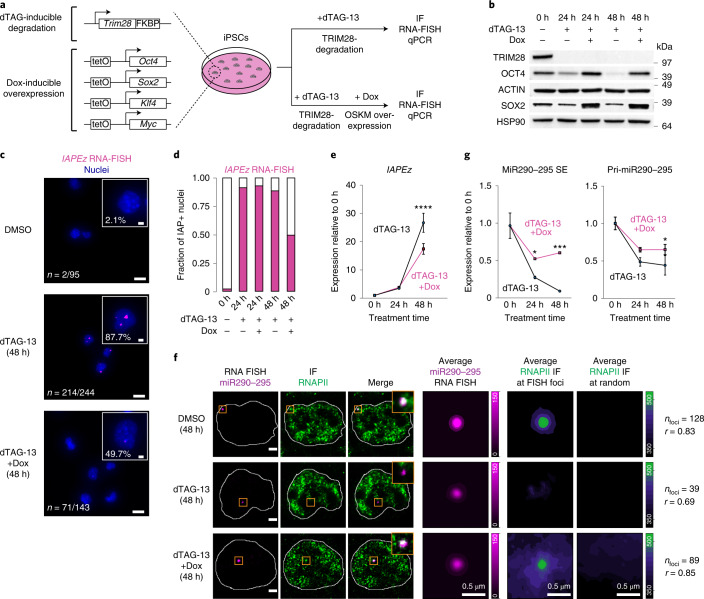
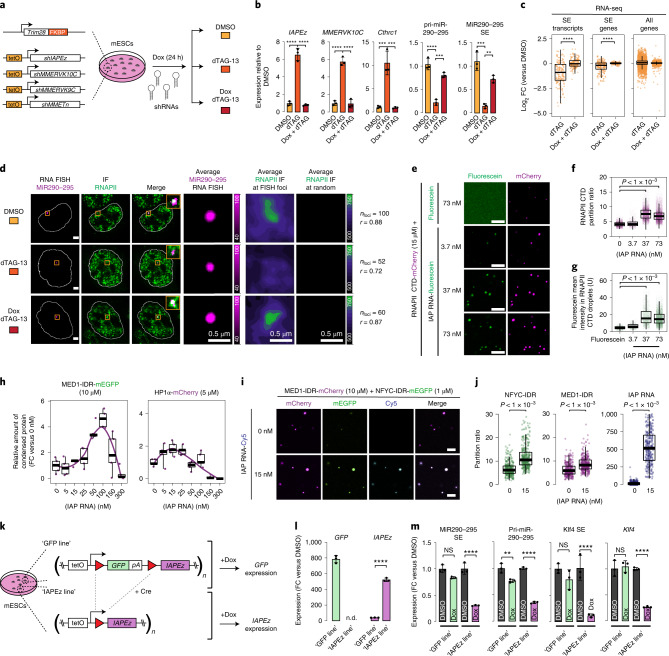
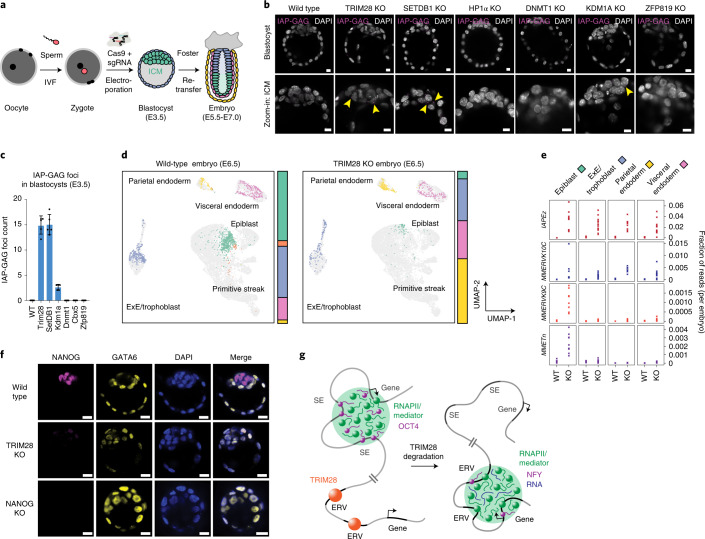
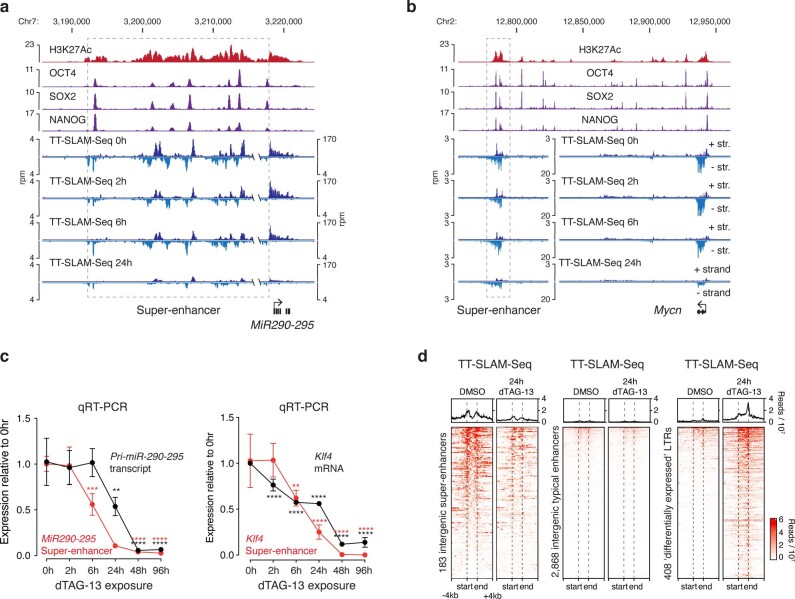
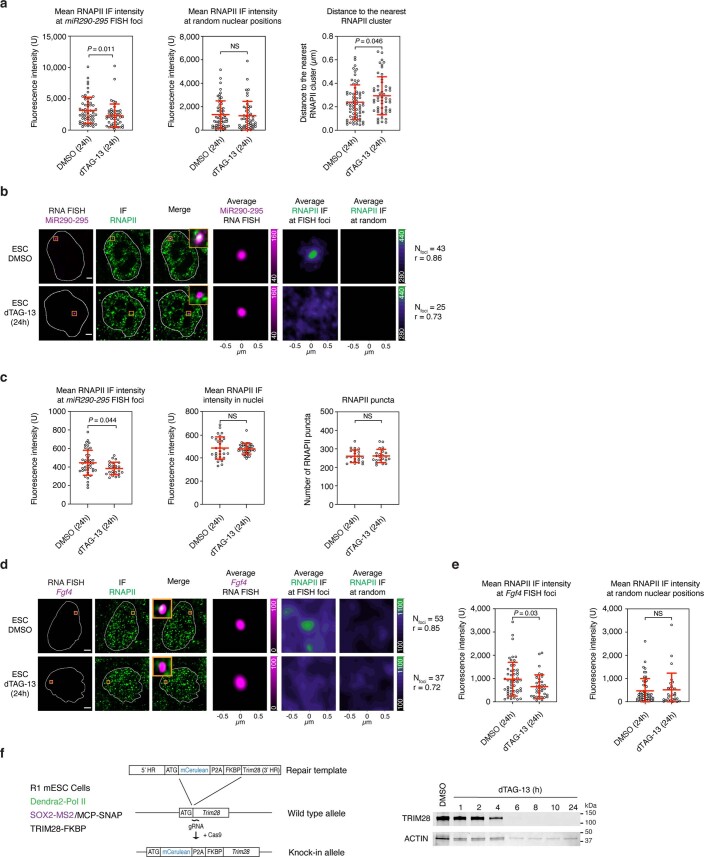
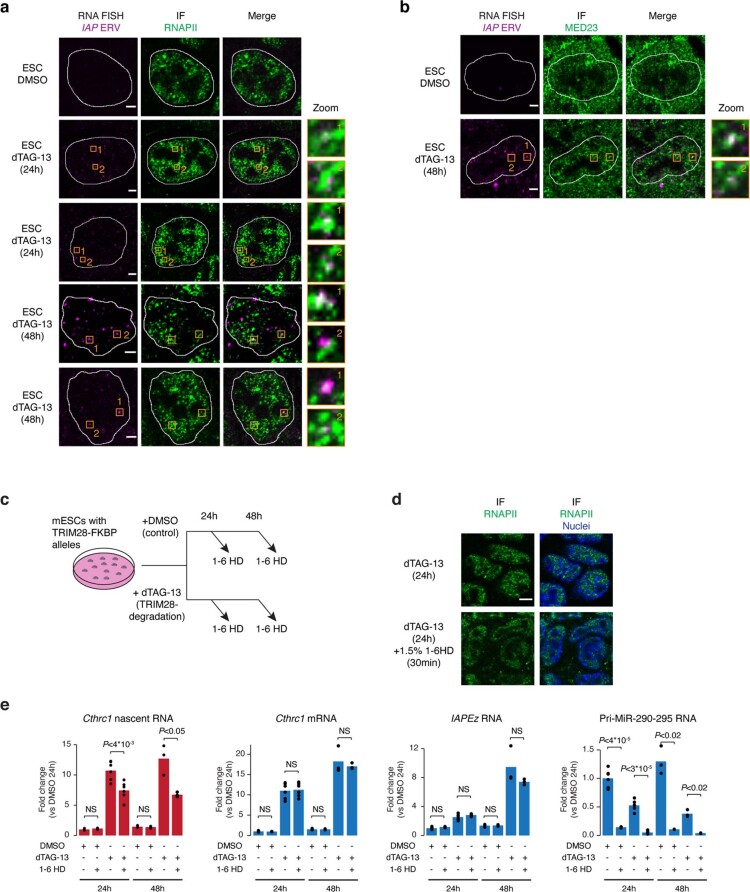
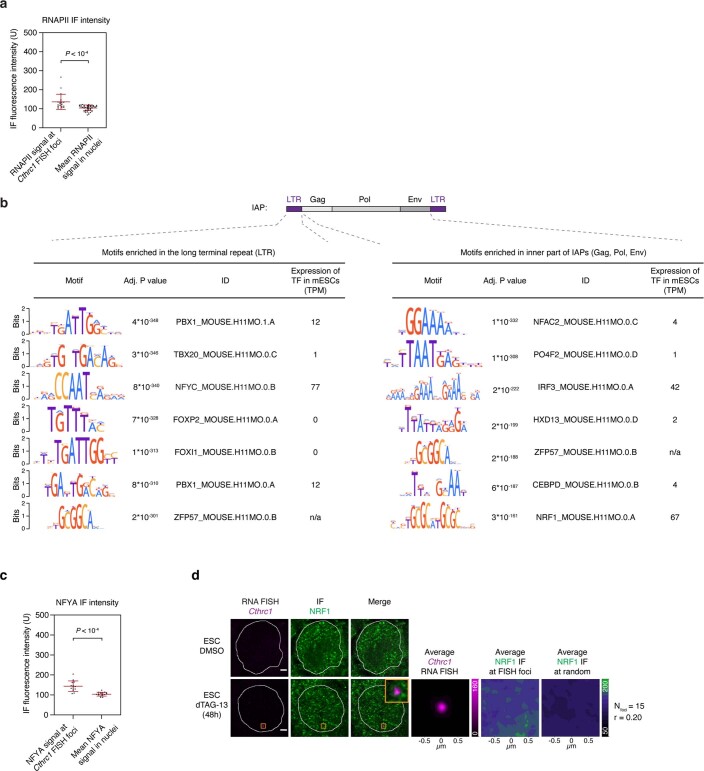
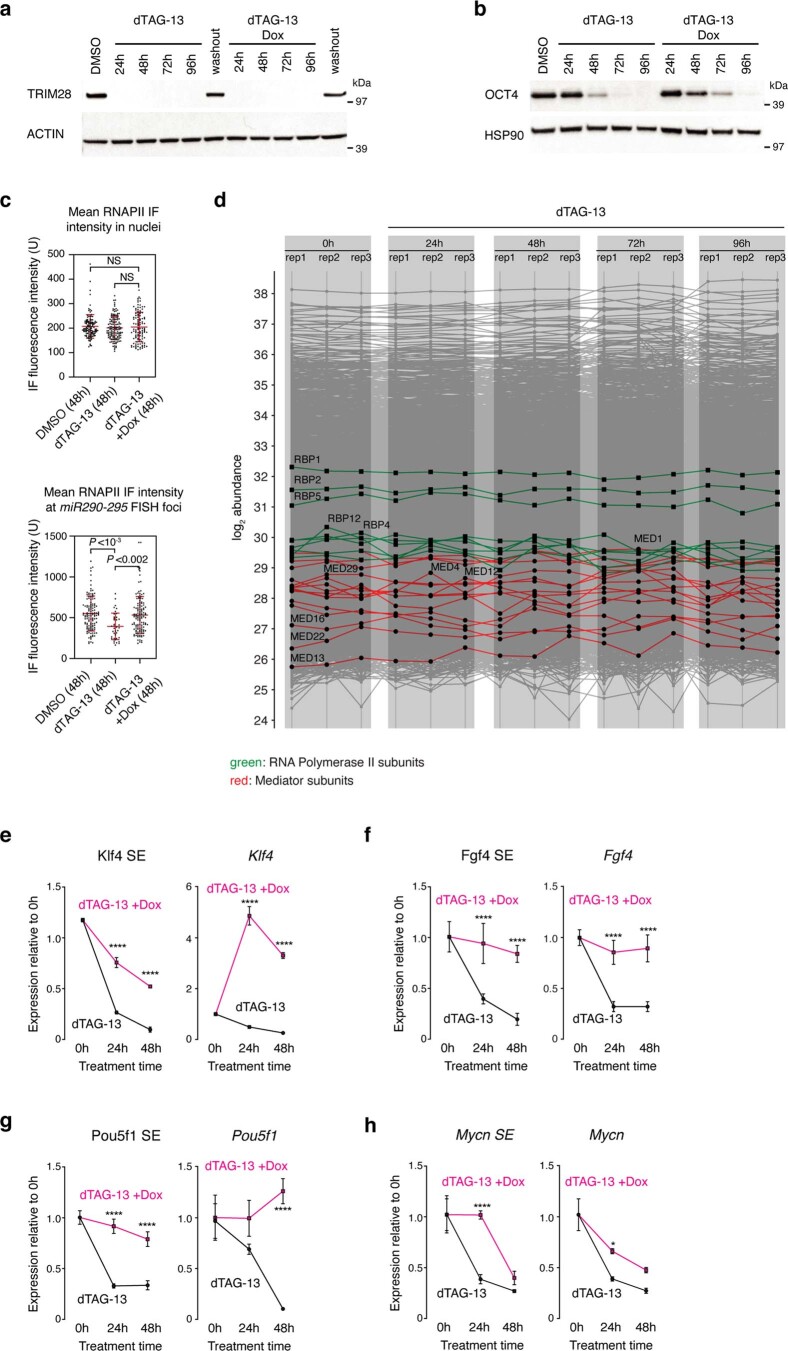
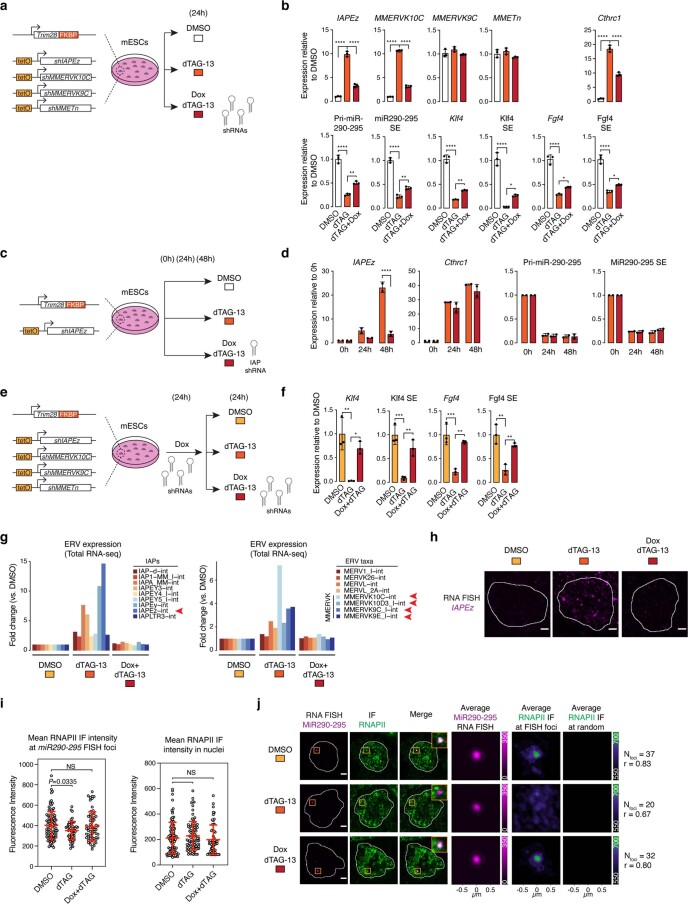
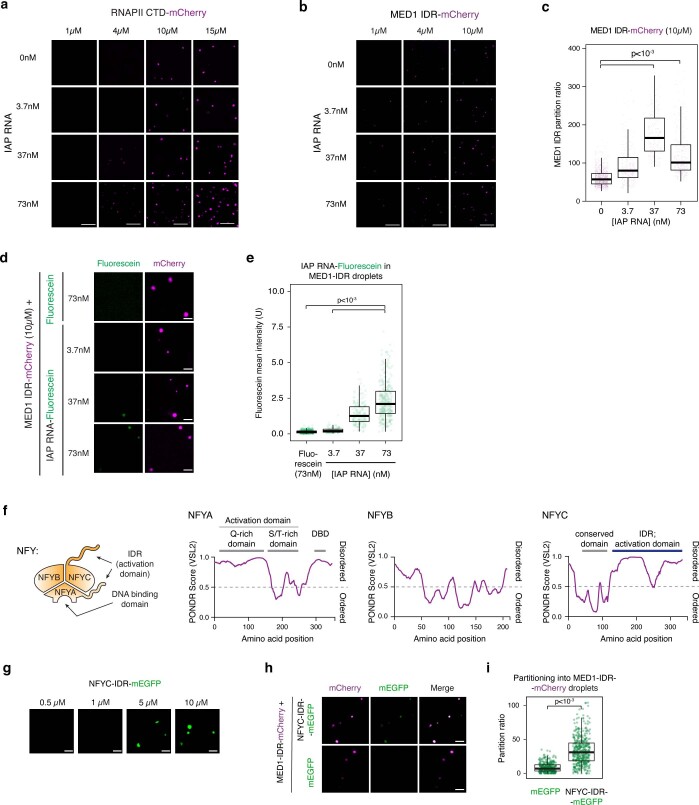
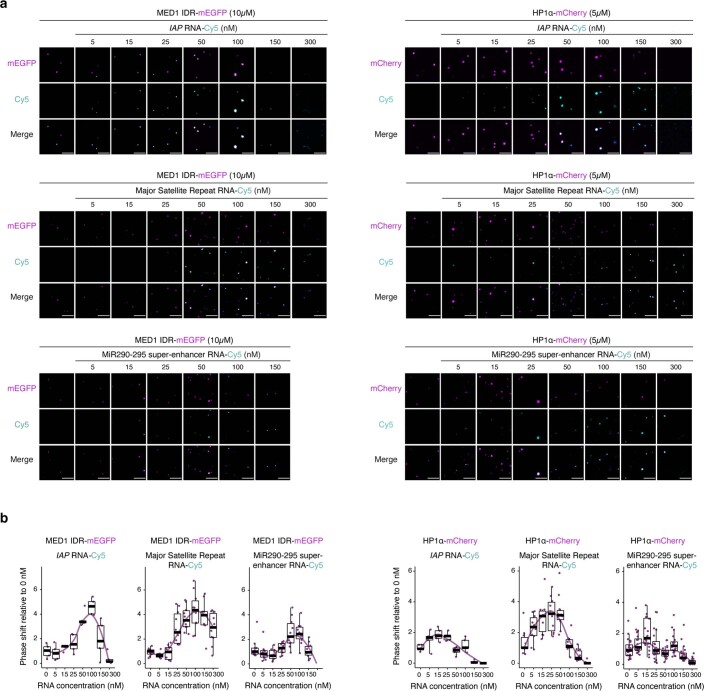
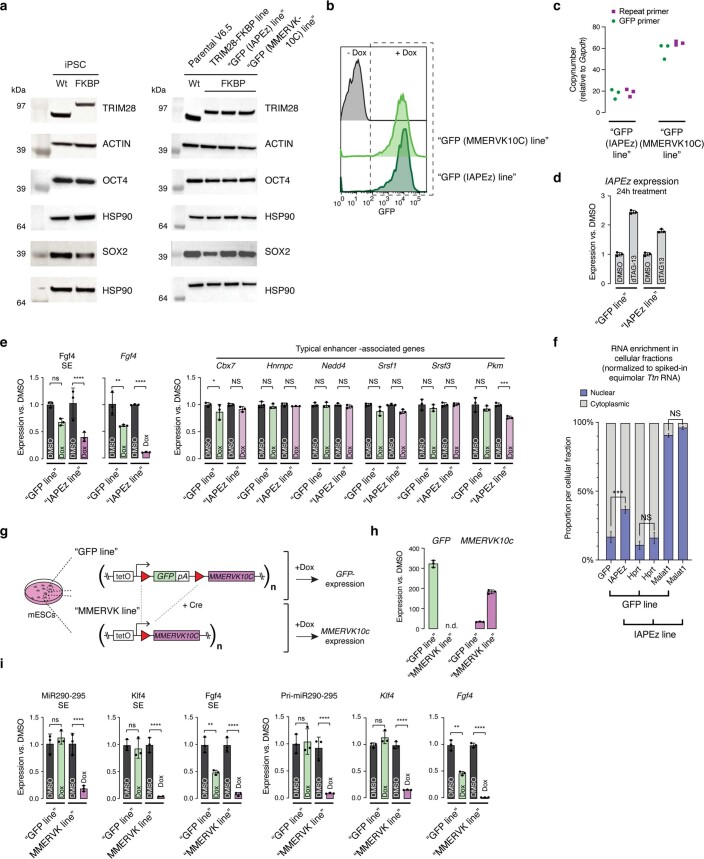
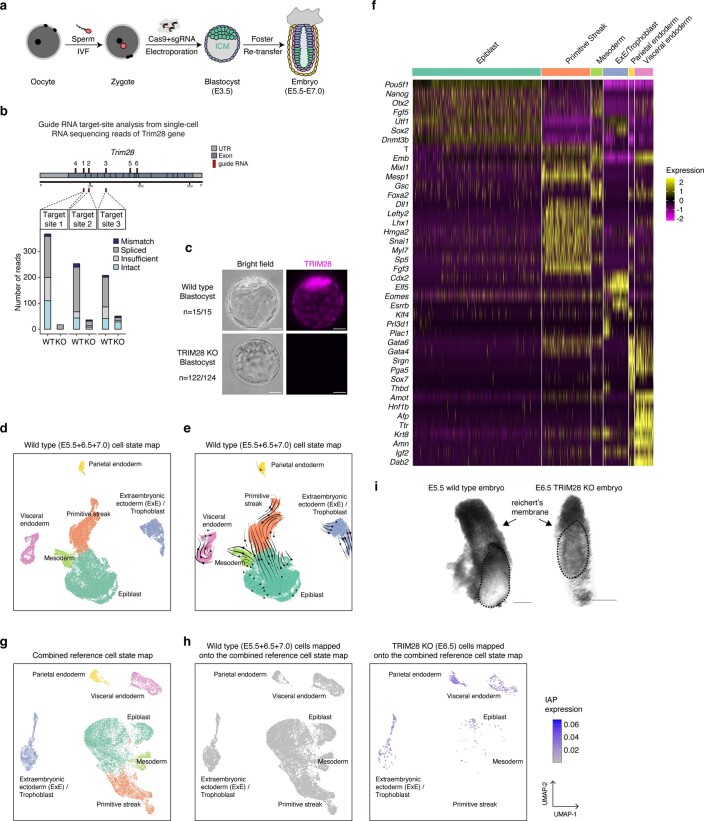
Most endogenous retroviruses (ERVs) in mammals are incapable of retrotransposition; therefore, why ERV derepression is associated with lethality during early development has been a mystery. Here, we report that rapid and selective degradation of the heterochromatin adapter protein TRIM28 triggers dissociation of transcriptional condensates from loci encoding super-enhancer (SE)-driven pluripotency genes and their association with transcribed ERV loci in murine embryonic stem cells. Knockdown of ERV RNAs or forced expression of SE-enriched transcription factors rescued condensate localization at SEs in TRIM28-degraded cells. In a biochemical reconstitution system, ERV RNA facilitated partitioning of RNA polymerase II and the Mediator coactivator into phase-separated droplets. In TRIM28 knockout mouse embryos, single-cell RNA-seq analysis revealed specific depletion of pluripotent lineages. We propose that coding and noncoding nascent RNAs, including those produced by retrotransposons, may facilitate 'hijacking' of transcriptional condensates in various developmental and disease contexts.


Conflict of interest statement

S.L.A. declares competing interest based on a granted patent related to SLAMseq. S.L.A. is co-founder, advisor and member of the board of QUANTRO Therapeutics GmbH

Figures

Fig. 1
Fig. 1. TRIM28 degradation leads to the reduction of SE transcription and loss of transcriptional condensates at SEs in mESCs.
a, Models of the TRIM28/HP1α pathway and enhancers. b, Heatmap of ChIP–seq read densities within a 2-kb window around full-length IAP ERVs and enhancers in mESC. The genomic elements were length normalized. Enhancers include the constituent enhancers of SEs and typical enhancers. Rpm, reads per million. c, Scheme of the dTAG system to degrade TRIM28 in mESCs. d, Western blot validation of the FKBP degron tag and its ability to degrade TRIM28. e, FC in read density of TT-SLAM-seq and RNA-seq data after the indicated duration of dTAG-13 treatment, normalized to the level in the DMSO control. Data are presented as mean values ± s.d. from three biological replicates. P values are from unpaired two-sided t-tests. **P < 0.01. f, Genome browser tracks of ChIP–seq data (H3K27Ac, OCT4, SOX2, NANOG) in control mESCs and TT-SLAM-seq data upon 0 h, 2 h, 6 h and 24 h dTAG-13 treatment at the Klf4 locus. Chr, chromosome. g, FC of gene transcription (TT-SLAM-seq data) upon dTAG-13 treatment. The number of significantly deregulated genes (DESeq2) and example pluripotency genes are highlighted. h, Gene set enrichment analysis: genes are ranked according to their FC in transcription (TT-SLAM-seq) after 24 h of dTAG-13 treatment. SE genes are marked with black ticks. P denotes a nominal P value. i, Log2 FC in TT-SLAM-seq read density at SEs and typical enhancers upon dTAG-13 treatment normalized to untreated control mESCs. P values are from two-sided Wilcoxon–Mann–Whitney tests. ****P = 5 × 10−8, ***P = 5 × 10−4. j, Representative images of individual z-slices (same z) of RNA-FISH and IF signal, and an image of the merged channels. The nuclear periphery determined by DAPI staining is highlighted as a white contour (scale bars, 2.5 μm). Also shown are averaged signals of either RNA-FISH or RNAPII IF centered on the FISH foci or randomly selected nuclear positions (scale bars, 0.5 μm). r denotes a Spearman’s correlation coefficient. k, Live-cell PALM imaging of Dendra2-RNAPII and nascent RNA transcripts of Sox2-MS2 in mESCs after 24 h dTAG-13 treatment. Left, size of the nearest RNAPII cluster around Sox2; middle left, distance between the Sox2 locus and the nearest RNAPII cluster; middle right, average RNAPII cluster size globally; right, number of RNAPII clusters per cell. Data are presented as mean values ± s.d. P values are from Wilcoxon–Mann–Whitney tests. Source data
Fig. 2
Fig. 2. Derepressed IAPs form nuclear foci that associate with RNAPII condensates and incorporate nearby genes.
a, Representative images of individual z-slices (same z) of RNA-FISH and RNAPII IF signal, and an image of the merged channels. The nuclear periphery determined by DAPI staining is highlighted as a white contour. The zoom column displays the region of the images highlighted in a yellow box (enlarged for greater detail). Merge of the nuclear z-projections is displayed, and overlapping pixels between the RNA-FISH and IF channels are highlighted in white. Displayed MOC and Pearson’s correlation coefficient (r) values are an average obtained from 24 analyzed nuclei. Scale bars, 2.5 μm. b, Same as a, except with MED1 IF. c, Distance of IAP RNA-FISH foci to the nearest RNAPII or MED1 IF puncta. Each dot represents one IAP RNA-FISH focus. d, Meta representations of RNAPII ChIP with reference exogenous genome (ChIP-RX) (left) and MED23 ChIP–seq (right) read densities at IAP, MMERVK and MMETn ERVs in control (DMSO-) and dTAG-13 (24 h)-treated mESCs. The mean read densities are displayed ±2 kb around the indicated elements. The genomic elements were length normalized. e, Genome browser tracks at the Cthrc1 locus. Note the independent transcription initiation events at Cthrc1 and MMETn, ruling out that the MMETn acts as an alternative Cthrc1 promoter. Rpm, reads per million. f, Representative images of individual z-slices (same z) of RNA-FISH and IF signal, and an image of the merged channels. The nuclear periphery determined by DAPI staining is highlighted as a white contour (scale bars, 2.5 μm). Also shown are averaged signals of either RNA-FISH or IF centered on the Cthrc1 FISH foci or randomly selected nuclear positions (scale bars, 0.5 μm). r denotes a Spearman’s correlation coefficient. g, Same as f, except with NFYA IF. h, qRT–PCR data for IAP RNA, Cthrc1 mRNA and the Pri-miR-290-295 transcript in control and ERV-triple knockout (TKO) cells. Data are presented as mean values ± s.d. from six biological replicates. P values are from two-tailed t-tests. ****P < 1 × 10−4. i, Principal component (PC) plot of Hi-C interactions at an ERV-rich locus on chromosome 12. j, Pile-up analysis of contacts between IAPs, MMERVKs, MMETns and transcribed genes in wild-type and TRIM28-degraded mESCs.
Fig. 3
Fig. 3. SE-enriched TFs rescue condensate localization in TRIM28-degraded mESCs.
a, Genotype of the iPSC line and scheme of the experimental setup. The iPSC line contains degradation-sensitive Trim28-FKBP alleles and doxycycline-inducible Oct4, Sox2, Klf4 and c-Myc (OSKM) transgenes. b, Western blot validation of the FKBP degron tag and OSKM ectopic expression in iPSCs. c, Representative images of IAP RNA-FISH staining. The number and percentage refer to cells with detectable IAP foci, pooled from two biological replicates. Scale bars, 10 μm; inset scale bars, 2 μm. d. Quantification of cells with detectable IAP foci (IAP+ cells) at the indicated treatment regimes. e, IAP RNA expression is reduced in TRIM28-degraded iPSCs that ectopically express OSKM factors. The line plot shows qRT–PCR data of IAP RNA levels normalized to 0 h of dTAG-13 treatment. Data are from three independent biological replicates (three wells on a tissue culture plate) and are presented as mean values ± s.d. The experiment was repeated three times, and data from one representative experiment are shown. P value is from two-tailed t-tests. ***P < 1 × 10−4. f, Colocalization between the nascent RNA of miR290-295 and RNAPII puncta in TRIM28-degraded iPSCs that ectopically express OSKM factors. Separate images of individual z-slices (same z) of the RNA-FISH and IF signal are shown along with an image of the merged channels. The nuclear periphery determined by DAPI staining is highlighted as a white contour (scale bars, 2.5 μm). Also shown are averaged signals of either RNA-FISH or RNAPII IF centered on the miR290-295 RNA FISH foci or randomly selected nuclear positions. r denotes a Spearman’s correlation coefficient (scale bars, 0.5 μm). g, Elevated levels of miR290-295 SE transcript and Pri-miR290-295 nascent transcript in TRIM28-degraded iPSCs that ectopically express OSKM factors. qRT–PCR data was normalized to the 0 h of dTAG-13 treatment. Data are from three independent biological replicates (three wells on a tissue culture plate) and are presented as mean values ± s.d. The experiment was repeated three times, and data from one representative experiment are shown. P values are from two-tailed t-tests. *P = 0.027, ***P = 1 × 10−4. Source data
Fig. 4
Fig. 4. Contributions of IAP RNA to condensate localization in vivo and condensate formation in vitro.
a, Schematic model of the ERV shRNA knockdown experiments. b, qRT–PCR data as FC-normalized to the DMSO treatment control. Data are presented as mean values ± s.d. from three biological replicates. P values are from two-tailed t-tests. ****P < 1 × 10−4, ***P < 1 × 10−3, **P < 1 × 10−2. c, Log2 FC values in total RNA-seq data at intergenic SEs and genes. Data are from three biological replicates. P values are from two-sided Wilcoxon–Mann–Whitney tests. ****P < 1 × 10−4. d, Representative images of individual z-slices (same z) of RNA-FISH and IF signal, and an image of the merged channels. The nuclear periphery determined by DAPI staining is highlighted as a white contour (scale bars, 2.5 μm). Also shown are averaged signals of either RNA-FISH or RNAPII IF centered on the miR290-295 FISH foci or randomly selected nuclear positions (scale bars, 0.5 μm). r denotes a Spearman’s correlation coefficient. e, Representative images of mixtures of fluorescein-labeled IAP RNA and purified recombinant RNAPII CTD-mCherry in droplet formation buffer. Scale bar, 5 μm. f, Partitioning ratio of RNAPII CTD-mCherry into droplets at the indicated IAP RNA concentrations. Every dot represents a detected droplet. P values are from two-sided t-tests. g, Quantification of the enrichment of fluorescein-labeled IAP RNA in RNAPII CTD-mCherry droplets. P values are from two-sided t-tests. h, Quantification of the partitioning of (left) MED1 IDR and (right) HPIα into droplets in the presence of IAP RNA. Values are normalized against the partition ratio at no RNA added. Corresponding images are found in Extended Data Fig. 8a. The displayed quantification is the same as displayed in Extended Data Fig. 8b. i, Representative images of droplet formation by purified NFYC-IDR-mEGFP (1 μM) and MED1 IDR-mCherry (5 μM) fusion proteins in the presence of in vitro transcribed Cy5-labeled IAP RNA fragment. Scale bar, 5 μm. j, Partitioning ratio of NFYC-IDR-mEGFP, MED1 IDR-mCherry and IAP RNA into droplets at the indicated IAP RNA concentrations. Every dot represents a detected droplet. All pairwise P values <2.2 × 10−16 (Welch’s t-test). k, Schematic model of the experiment mimicking IAPEz transcription. l, qRT–PCR data as FC-normalized to the DMSO control treatment. n.d., not detectable. Data are presented as mean values ± s.d. P values are from two-tailed t-tests. ****P < 1 × 10−4. m, qRT–PCR data as FC-normalized to the DMSO control treatment. Data are presented as mean values ± s.d. from three biological replicates. P values are from two-tailed t-tests. ****P < 1 × 10−4, ***P < 1 × 10−3, **P < 1 × 10−2, NS, not significant. In panels f, g, h and j, data for quantification were acquired from at least five images of two independent image series per condition.
Fig. 5
Fig. 5. Early ERV activation correlates with depletion of pluripotent lineages in mouse embryos.
a, Scheme of the zygotic CRISPR–Cas9 perturbation platform. b, IF images of mouse E3.5 blastocysts stained for the GAG protein produced by IAPs. Nuclei are counterstained with DAPI. Note the magenta IAP GAG foci highlighted with yellow arrowheads. Scale bar, 10 µm. c, Quantification of IAP GAG foci in multiple embryos of the indicated genotype across three independent perturbation experiments. Five embryos were picked from the pool of embryos from each genotype for the staining. Each dot represents the GAG foci from an individual embryo. Data are presented as mean values ± s.d. d, Epiblast cells are depleted in TRIM28 KO embryos. Uniform manifold approximation and projection (UMAP) of E6.5 wild-type and E6.5 TRIM28 KO embryos mapped on the combined reference cell state map. The proportions of cells that belong to the individual cell states are indicated as a bar on the right of the UMAP plots. Exe, extraembryonic ectoderm. e, Lineage-specific ERV derepression in TRIM28 KO mouse embryos. The plot shows the fraction of RNA-seq reads that map to the displayed ERV taxa in the indicated cell types in wild-type (WT) and TRIM28 KO embryos in the scRNA-seq data. Each ‘x’ represents a single embryo. f, The inner part of TRIM28 KO blastocysts is populated by GATA6-expressing, NANOG-negative cells. Displayed are representative IF images of NANOG and GATA6 in E3.5 wild-type, TRIM28 KO and NANOG KO blastocysts across two independent perturbation experiments with around 20 embryos per condition. Scale bars, 20 μm. g, Condensate hijacking model. In pluripotent cells, transcriptional condensates associate with SEs bound by pluripotency TFs (for example, OCT4). In the absence of TRIM28, transcriptional condensates are lost from SEs and associate with derepressed ERVs.
Extended Data Fig. 1
Extended Data Fig. 1. Reduction of super-enhancer transcription and the pluripotency circuit in TRIM28-degraded mESCs.
a. Acute reduction of transcription at the miR290-295 super-enhancer locus upon TRIM28-degradation. Displayed are genome browser tracks of ChIP-seq data (H3K27Ac, OCT4, SOX2, NANOG) in control mESCs, and TT-SLAM-seq data upon 0 h, 2 h, 6 h and 24 h dTAG-13 treatment at the miR290-295 locus. Rpm: reads per million. Co-ordinates are mm10 genome assembly co-ordinates. b. Acute reduction of transcription at the Mycn super-enhancer locus upon TRIM28-degradation. Displayed are genome browser tracks of ChIP-seq data (H3K27Ac, OCT4, SOX2, NANOG) in control mESCs, and TT-SLAM-seq data upon 0 h, 2 h, 6 h and 24 h dTAG-13 treatment at the Mycn locus. Rpm: reads per million. Co-ordinates are mm10 genome assembly co-ordinates. c. qRT-PCR validation of the TT-SLAM-seq data at the miR290-295 and Klf4 loci. Displayed are transcript levels after the indicated duration of dTAG-13 treatment. Values are displayed as mean ± SD from three independent experiments and are normalized to the level at 0 h. P values are from two-tailed t-tests. ****: P < 10−4, ***: P < 10−3, **: P < 10−2, *: P < 0.05. d. Visualization of nascent transcripts at super-enhancers, enhancers and de-repressed LTR retrotransposons. Displayed are TT-SLAM-seq read densities from both strands within 4 kb around the indicated sites. The genomic features (the middle part of the plot) were length normalized. Meta-analyses of the mean signals are displayed above the heatmaps.
Extended Data Fig. 2
Extended Data Fig. 2. Loss of SE-association with RNAPII puncta at super-enhancers.
a. Analyses of cells used in Fig. 1j. (left) RNAPII IF intensity at the miR290-295 FISH foci (nDMSO = 61, ndTAG-13 = 50). (middle) RNAPII mean fluorescence intensity at random nuclear positions (nDMSO = 61, ndTAG-13 = 50). (right) Distance between the FISH focus and the nearest RNAPII puncta (nDMSO = 67, ndTAG-13 = 53). Data presented as mean values ± SD from one staining experiment. P values are from two-sided Mann-Whitney tests. NS: not significant. b. Images of RNA-FISH and IF signal. Nuclear periphery determined by DAPI staining is highlighted as a white contour. Also shown are averaged signal of either RNA FISH or RNAPII IF centered on the miR290-295 FISH foci or randomly selected nuclear positions. Data were collected as an independent replicate of experiments displayed in Fig. 1j. Scale bars: 2.5 μm. c. Analysis of cells used in panel ‘b’. (left) RNAPII IF intensity at the miR290-295 FISH foci (nDMSO = 43, ndTAG-13 = 25). (center) RNAPII mean fluorescence intensity (nDMSO = 30, ndTAG-13 = 40). (right) Number of RNAPII puncta on a representative set of cells (nDMSO = 22, ndTAG-13 = 22). Data are presented as mean values ± SD from one staining experiment. P values are from two-sided Mann-Whitney tests. NS: not significant. d. Images of individual z-slices (same z) of the Fgf4 RNA-FISH and IF signal. Nuclear periphery determined by DAPI staining is highlighted as a white contour. Also shown are averaged signals of either RNA FISH or RNAPII IF centered on the FISH foci or randomly selected positions. Scale bars: 2.5 μm. e. Analyses of cells used in panel ‘d.’ (left) RNAPII IF intensity at the Fgf4 FISH foci (nDMSO = 53, ndTAG-13 = 37). (right) RNAPII mean fluorescence intensity at random nuclear positions (nDMSO = 53, ndTAG-13 = 29). Data presented as mean values ± SD from one staining experiment. P values are from two-sided Mann-Whitney tests. NS: not significant. f. (left) Scheme of FKBP knock-in strategy in the R1 mESCs used in the PALM experiments. (right) TRIM28 Western blot in the R1 mESCs. Western blot was done once. Source data
Extended Data Fig. 3
Extended Data Fig. 3. Condensate hijacking additional data.
a, b. Co-localization between the IAP RNA and (a) RNAPII puncta and (b) MED23 puncta in TRIM28-degraded mESCs. Displayed are separate images of the RNA-FISH and IF signal, and an image of the merged channels. The nuclear periphery determined by DAPI staining is highlighted as a white contour. The zoom column displays the region of the images highlighted in a yellow box zoomed in for greater detail. After 24 h dTAG-13 treatment, small nuclear puncta appear, and after 48 h of dTAG-13 treatment, large nuclear foci are visible. Scale bars: 2.5 μm. c. Scheme of the 1-6 hexanediol (1-6 HD) treatment experiments. d. Representative images of RNAPII immunofluorescence in control and 1-6 HD-treated cells. 1-6 HD partially dissolved the punctate localization of RNAPII. Scale bars: 5 μm. e. Transcription of the nascent Cthcr1 RNA is reduced by 30 min 1% 1-6 hexanediol-treatment in TRIM28-degraded cells. The bar plots show qRT-PCR data as fold change normalized to the DMSO control across 6 and 3 biological replicates for 24 h and 48 h timepoints, respectively. Note that the IAP RNA does not contain introns; thus, the IAP RNA qRT-PCR detects the steady state pool of IAP RNAs. Each dot represents a data point, and bar indicates the mean. P values are from two-tailed t tests. NS: not significant.
Extended Data Fig. 4
Extended Data Fig. 4. Additional characterization NFY and NRF1.
a. The RNAPII IF signal at Cthrc1 FISH foci is higher than the average nuclear signal. Quantification of the RNAPII IF intensity at Cthrc1 FISH foci (n = 20) and nuclei (n = 47) in the cells analyzed in Fig. 2f is shown. Data are presented as mean values ± SD from one staining experiment. P value is from a two-sided Mann-Whitney test. b. The sequence of IAPs is enriched for various TF binding motifs, including the motif of NFY. Top: schematic of an IAP element. Bottom: motif images, adjusted P values and motif IDs, and the expression level of the TF in mESC RNA-seq data. Displayed are the top-scoring motifs based on adjusted P-value. Motifs were filtered for redundancy. c. The NFYA IF signal at Cthrc1 FISH foci is higher than the average nuclear signal. Quantification of the NFYA IF intensity at Cthrc1 FISH foci (n = 14) and nuclei (n = 16) in the cells analyzed in Fig. 2g is shown. Data are presented as mean values ± SD from one staining experiment. P value is from a two-sided Mann-Whitney test. d. NRF1 puncta do not co-localize with the nascent RNA Cthrc1 in TRIM28-degraded mESCs. Displayed are separate images of the RNA-FISH and IF signal, and an image of the merged channels. The nuclear periphery determined by DAPI staining is highlighted as a white contour. Also shown are averaged signals of either RNA FISH or NRF1 IF centered on the Cthrc1 FISH foci or randomly selected nuclear positions. Scale bars: 2.5 μm.
Extended Data Fig. 5
Extended Data Fig. 5. Additional characterization of the OSKM/dTAG-13 experiments.
a. Western blot validation of the FKBP degron tag and its ability to degrade TRIM28 in iPSCs. Washout of the dTAG-13 ligand (24 h) indicates reversibility of degradation. Western blot experiments were performed twice and one representative image is shown. Actin is shown as the loading control. b. Western blot validation of the OSKM ectopic expression in the iPSC line. Western blot experiments were performed three times and one representative image is shown. HSP90 is shown as the loading control. c. dTAG-13 treatment leads to reduced RNAPII immunofluorescence signal at miR290-295 FISH foci which is rescued by OSKM ectopic expression, while overall RNAPII levels do not change. (top) Quantification of RNAPII mean fluorescence intensity (n = 117 for DMSO, n = 138 for dTAG-13, n = 110 for Dox+dTAG-13) in the cells used in Fig. 3f. (bottom) Quantification of RNAPII IF intensities at the miR290-295 FISH foci (n = 128 for DMSO, n = 39 for dTAG-13, n = 89 for Dox+dTAG-13) detected in the cells used in Fig. 3f. Data are presented as mean values ± SD from one staining experiment. P value is from a two-sided Mann-Whitney test. d. Mass spectrometry-detected protein abundance for three individual replicate samples after 0 h, 24 h, 48 h, 72 h and 96 h dTAG-13 treatment of mESCs. RNAPII subunits are highlighted in green. Mediator complex subunits are highlighted in red. e–h. qRT-PCR data normalized to the 0 h of dTAG-13 treatment. Data are from three independent biological replicates (that is, three wells on a tissue culture plate) and are presented as mean values ± SD. The experiment was repeated three times, and data from one representative experiment are shown. P values are from two-tailed t-tests. *: P < 0.05, ***: P < 10−3, ****: P < 10−4. Source data
Extended Data Fig. 6
Extended Data Fig. 6. Knockdown of ERV RNA rescues super-enhancer transcription in TRIM28-degraded cells.
a. Scheme of knockdown experiments with simultaneous TRIM28 degradation. b. qRT-PCR analysis from three independent biological replicates. Data presented as mean values ± SD. Experiment was performed twice, and the data shown are from one representative experiment. P values are from two-tailed t tests. ****: P < 10−4, ***: P < 10−3, **: P < 10−2, *: P < 0.05. c. Scheme of IAP knockdown experiments. d. qRT-PCR data displayed as fold change normalized to the 0 h control from three independent biological replicates. Data are presented as mean values ± SD. Each dot represents the mean of the three biological replicates of an individual experiment. P values are from two-tailed t-tests. ****: P < 10−4, ***: P < 10−3, **: P < 10−2, *: P < 0.05. e. Scheme of the experiment in which shRNAs are induced for 24 h and then treated either with DMSO (yellow), dTAG-13 (orange) or with dTAG-13 and Dox (maroon) for additional 24 h. f. qRT-PCR data as fold change normalized to the Dox (24 h) treatment control from three independent biological replicates. Data are presented as mean values ± SD. Experiment was performed twice, and data from one representative experiment is shown. P values are from two-tailed t-tests. ****: P < 10−4, ***: P < 10−3, **: P < 10−2, *: P < 0.05. g. RNA levels detected with total RNA-seq. Values from three biological replicates are normalized to levels detected at 0 h. Red arrowheads highlight the ERV taxa against whose sequences the shRNAs were designed. h. Representative images of IAP RNA FISH in cells described in panels (e–f). Scale bar: 2.5 μm. i. Analyses of cells used in Fig. 4d. (left) RNAPII IF intensities at the miR290-295 FISH foci (nDMSO = 100, ndTAG-13 = 52, nDox+dTAG-13 = 60). (right) RNAPII mean fluorescence intensity at random nuclear positions (nDMSO = 97, ndTAG-13 = 88, nDox+dTAG-13 = 60). Data presented as mean values ± SD from one staining experiment. P values are from two-sided Mann-Whitney tests. NS: not significant. j. Images of individual z-slices (same z) of the RNA-FISH and IF signal. Nuclear periphery determined by DAPI staining is highlighted as a white contour. Also shown are averaged signals of either RNA FISH or RNAPII IF centered on the miR290-295 FISH foci or randomly selected positions. Scale bars: 2.5 μm. The experiment is an independent biological replicate of the experiments shown in Fig. 4d.
Extended Data Fig. 7
Extended Data Fig. 7. IAP RNA facilitates droplet formation of transcriptional activators in vitro.
a. IAP RNA facilitates RNAPII CTD droplet formation in vitro. Displayed are representative images of droplet formation by purified RNAPII CTD-mCherry fusion proteins in the presence of in vitro transcribed IAP RNA fragments. Scale bar: 10 μm. b. IAP RNA facilitates MED1 IDR droplet formation in vitro. Displayed are representative images of droplet formation by purified MED1 IDR-mCherry fusion proteins in the presence of in vitro-transcribed IAP RNA. c. Partitioning ratio of MED1 IDR-mCherry into droplets at the indicated IAP RNA concentrations. Every dot represents a detected droplet. Data for the quantification was acquired from at least five images of two independent image series per condition. P value is a from a two-tailed t test. d. IAP RNA is enriched within MED1 IDR droplets. Displayed are representative images of the enrichment of fluorescein-labeled IAP RNA in MED1 IDR-mCherry droplets. e. Quantification of the enrichment of fluorescein-labeled IAP RNA in MED1 IDR-mCherry droplets. Data for the quantification was acquired from at least five images of two independent image series per condition. P value is from a two-tailed t test. f. (left) Schematic model of the heterotrimeric NFY transcription factor. (right) Graphs plotting intrinsic disorder in the NFYA, NFYB and NFYC proteins. The NFYC-IDR cloned for subsequent experiments is highlighted with a blue bar. g. Concentration-dependent droplet formation by purified recombinant NFYC IDR-mEGFP. Scale bar: 10 μm. h. Representative images of droplet formation by purified NFYC IDR-mEGFP and MED1 IDR-mCherry fusion proteins. MED1 IDR-mCherry mixed with purified mGFP is included as a control. Scale bar: 10 μm. i. Partitioning ratio of NFYC IDR-mEGFP or mEGFP in MED1 IDR-mCherry droplets. Every dot represents a detected droplet. Data for the quantification was acquired from at least five images of two independent image series per condition. P value is a from a two-tailed t test.
Extended Data Fig. 8
Extended Data Fig. 8. Effects of various RNAs on MED1 IDR and HPα droplets in vitro.
a. RNA facilitates MED IDR and droplet HPα formation in vitro. Displayed are representative images of droplet formation by purified (left) MED1 IDR-mEGFP fusion protein and (right) HPα-mCherry fusion protein in the presence of in vitro transcribed RNA fragments. Scale bar: 10 μm. b. Quantification of the partitioning of (left) MED1 IDR and (right) HPIα into droplets in the presence of the indicated RNA species. Values are normalized against the partition ratio at no RNA added. Data for the quantification was acquired from at least five images of two independent image series per condition. IAP RNA quantification is the same plot displayed in Fig. 4h.
Extended Data Fig. 9
Extended Data Fig. 9. Induction of ERV transcription compromises super-enhancer transcription.
a. Western blot of TRIM28, OCT4 and SOX2 in the indicated cell lines. Western blot experiments were performed once. b. FACS analysis of GFP in the ‘GFP (IAPEz) line’ and ‘GFP (MMERVK10C) line’. c. Genotyping qRT-PCR of the ‘GFP (IAPEz) line’ and ‘GFP (MMERVK10C) line.’ Primer sets amplifying the transgenic GFP or repeat sequence (IAP or MMERVK10C) were used. Data are from triplicate experiments. d. qRT-PCR validation of IAPEz upregulation. Values are normalized against the IAPEz level in the corresponding DMSO condition. Data are presented as mean values ± SD from three biological replicates. e. Additional supporting data for the experiment in Fig. 4m. qRT-PCR data are shown as fold change normalized to the DMSO control treatment. Data are presented as mean values ± SD from three biological replicates. P values are from two-tailed t-tests. ****: P < 10−4, ***: P < 10−3, **: P < 10−2, NS: not significant. f. The amount of GFP, IAPEz, Hprt and Malat1 RNA were quantified in the nuclear and cytoplasmic fractions by qRT-PCR. The values are normalized against the amount of in vitro transcribed Ttn RNA that was spiked in at equimolar amount to the cytoplasmic and nuclear fractions. The expression values are then displayed as the percentage of the RNA in the nuclear and cytoplasmic fractions. Hprt is used as a control of a cytoplasmic mRNA, and Malat1 is used as control RNA known to be enriched in the nucleus. Data are presented as mean values ± SD from three biological replicates. P values are from a two-way ANOVA Sidak’s multiple comparison test. ***: P < 10−3, NS: not significant. g. Schematic model of the experiment mimicking MMERVK10C transcription. mESC lines harboring ~61 copies of a PiggyBac transposon encoding a Dox-inducible GFP or MMERVK10C transgene were treated with Dox (to induce GFP or MMERVK10C expression). h. qRT-PCR validation of the ‘GFP line’ and ‘MMERVK line’. The bar plots show qRT-PCR data as fold change normalized to the DMSO control treatment. Data are presented as mean values ± SD from three biological replicates. N.d.: not detectable. i. qRT-PCR data as fold change normalized to the DMSO control treatment. Data are presented as mean values ± SD from three biological replicates. P values are from two-tailed t-tests. ****: P < 10−4, ***: P < 10−3, **: P < 10−2, NS: not significant. Source data
Extended Data Fig. 10
Extended Data Fig. 10. Reference cell state maps in early mouse embryos.
a. Scheme of the zygotic CRISPR/Cas9 – scRNA-seq platform. b. Cut site analysis. The number, type and distribution of reads mapping to the sites targeted with the TRIM28 guide RNAs is quantified in the scRNA-seq data. c. Immunofluorescence verification of TRIM28 KO. Representative images are shown, with the number of embryos where the immunofluorescence confirmed the genotype per the total number of embryos analyzed. The knockout experiment was performed five times independently, and the pool of embryos from all experiments were used for staining. Scale bars: 20 μm. d. UMAP of wild type early mouse embryos spanning E5.5-E7.0 developmental window. The wild type cells used in scRNA-seq experiments from E5.5, E6.5 and E7.0 developmental stages were included. e. RNA velocity map of wild type early mouse embryos spanning E5.5-E7.0 developmental window. f. Heatmap representation of the expression levels of marker genes of each cluster/cell state. g. Combined cell state map. The wild type cells and TRIM28 KO cells used in scRNA-seq experiments were included. h. Elevated IAP expression in TRIM28 KO cells. (left) Wild type cells used in scRNA-seq experiments from E5.5, E6.5 and E7.0 developmental stages are projected on the combined reference map and are colored according to the IAP expression of the corresponding embryo and cell state. (right) TRIM28 KO E6.5 cells are projected on the combined reference map and are colored according to IAP expression of the corresponding embryo and cell state. i. Bright-field images of representative embryos from E5.5 wild type and E6.5 TRIM28 KO. Dotted lines represent the embryo that was dissected out from the dense Reichert’s membrane. Scale bar is 100 µm.

Comment in

Similar articles

Cited by

References

    1. Thompson PJ, Macfarlan TS, Lorincz MC. Long terminal repeats: from parasitic elements to building blocks of the transcriptional regulatory repertoire. Mol. cell. 2016;62:766–776. doi: 10.1016/j.molcel.2016.03.029. - DOI - PMC - PubMed
    1. Grewal SI, Jia S. Heterochromatin revisited. Nat. Rev. Genet. 2007;8:35–46. doi: 10.1038/nrg2008. - DOI - PubMed
    1. Cordaux R, Batzer MA. The impact of retrotransposons on human genome evolution. Nat. Rev. Genet. 2009;10:691–703. doi: 10.1038/nrg2640. - DOI - PMC - PubMed
    1. Payer LM, Burns KH. Transposable elements in human genetic disease. Nat. Rev. Genet. 2019;20:760–772. doi: 10.1038/s41576-019-0165-8. - DOI - PubMed
    1. Rowe HM, Trono D. Dynamic control of endogenous retroviruses during development. Virology. 2011;411:273–287. doi: 10.1016/j.virol.2010.12.007. - DOI - PubMed

Publication types