. 2022 Oct;96(10):2767-2783.
doi: 10.1007/s00204-022-03342-x. Epub 2022 Jul 21.

TRPM7 restrains plasmin activity and promotes transforming growth factor-β1 signaling in primary human lung fibroblasts

Affiliations

TRPM7 restrains plasmin activity and promotes transforming growth factor-β1 signaling in primary human lung fibroblasts

Sarah Zeitlmayr et al. Arch Toxicol. 2022 Oct.

Abstract

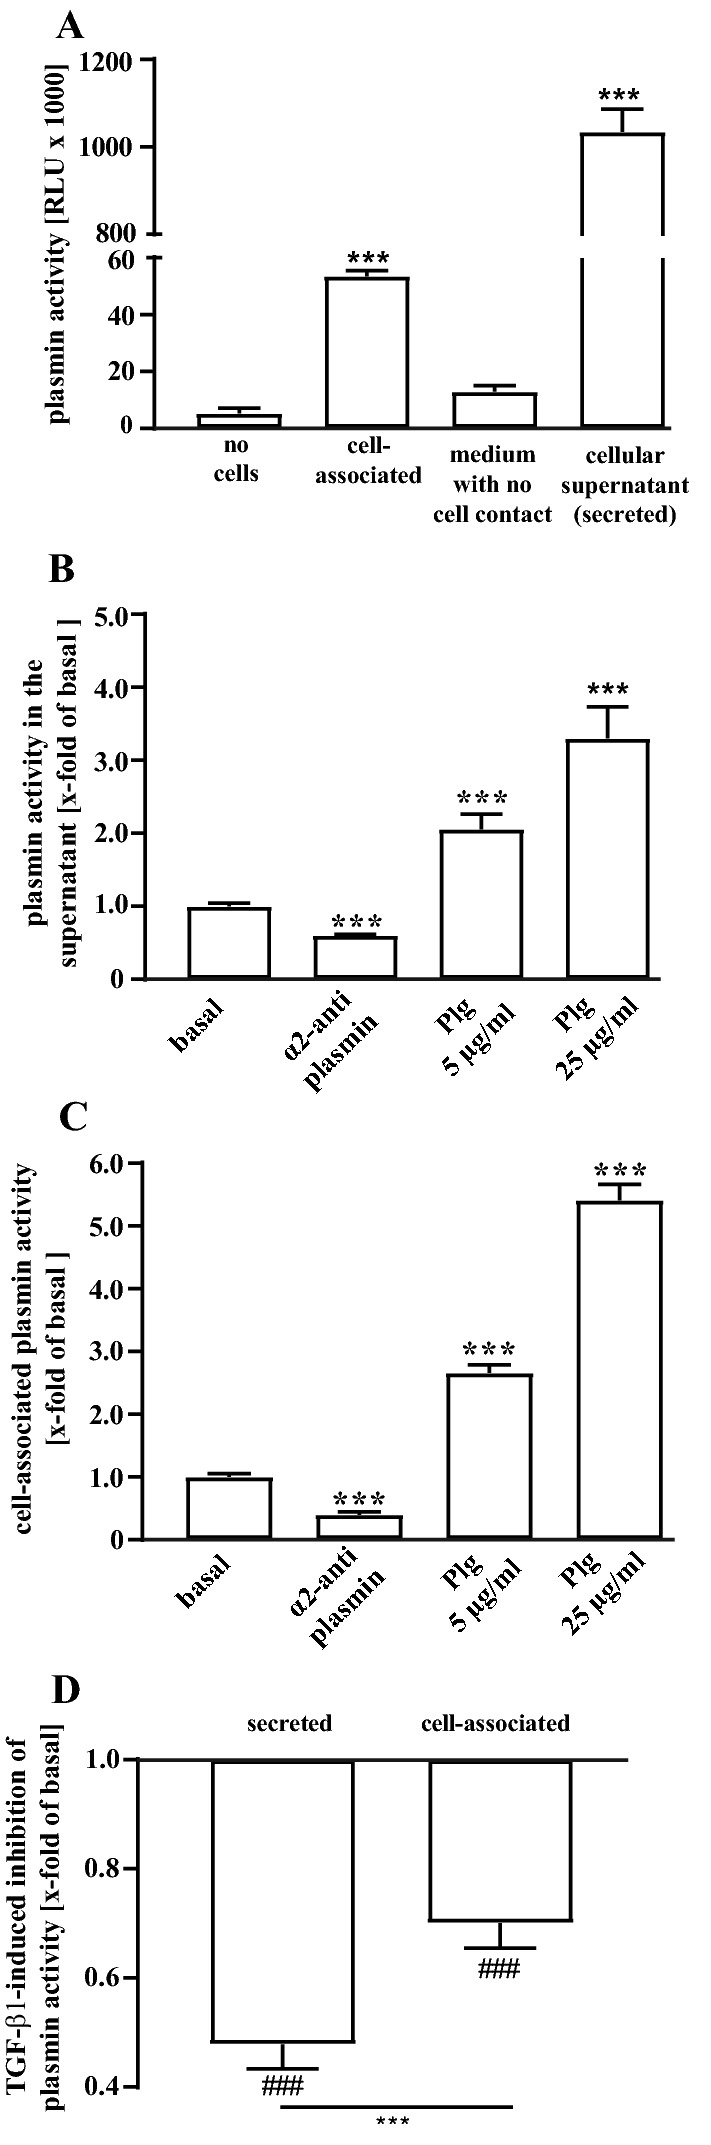
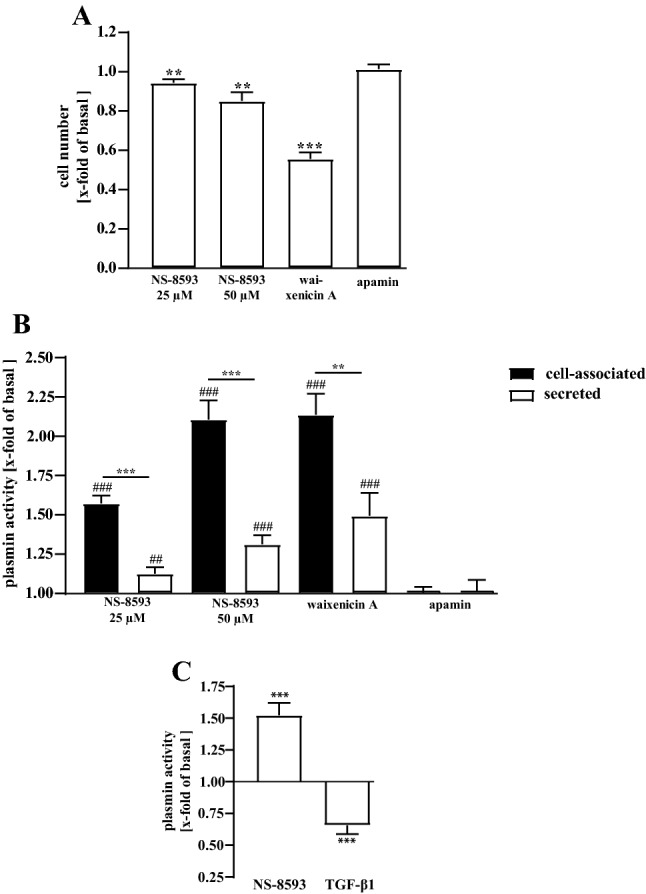
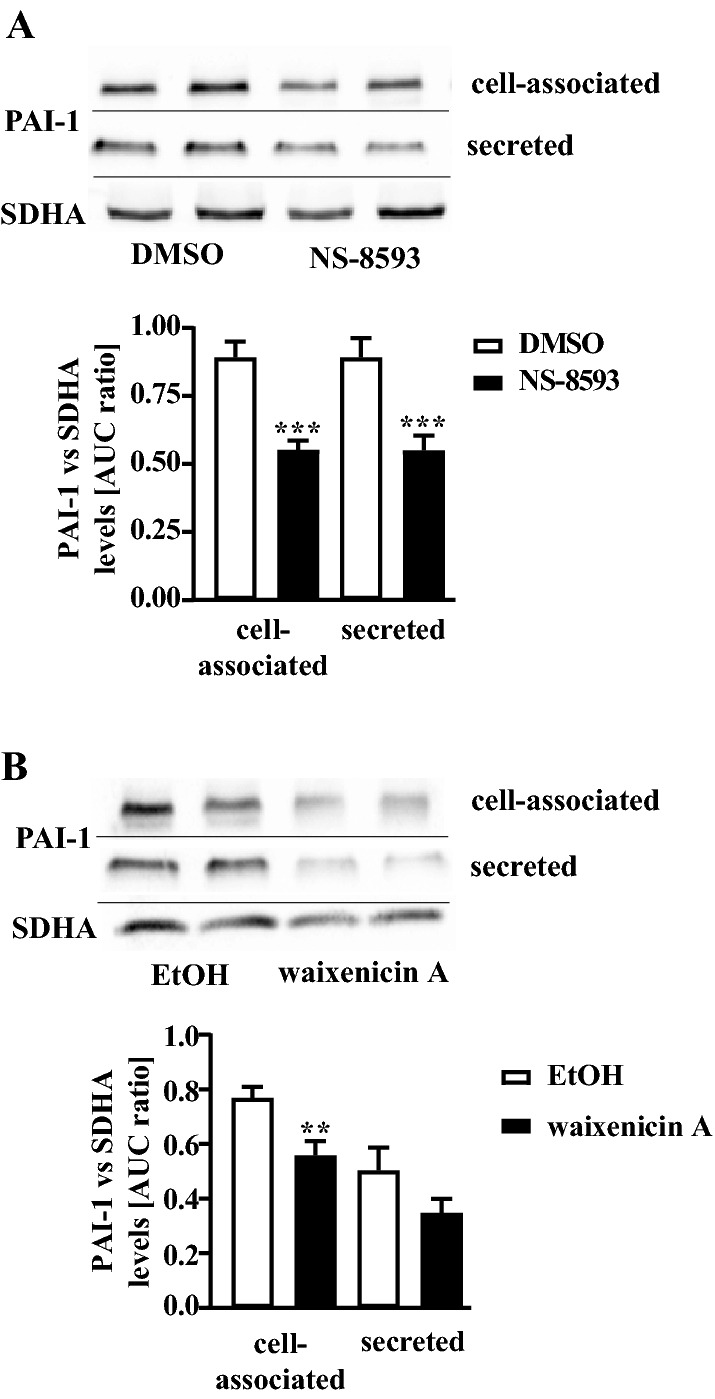
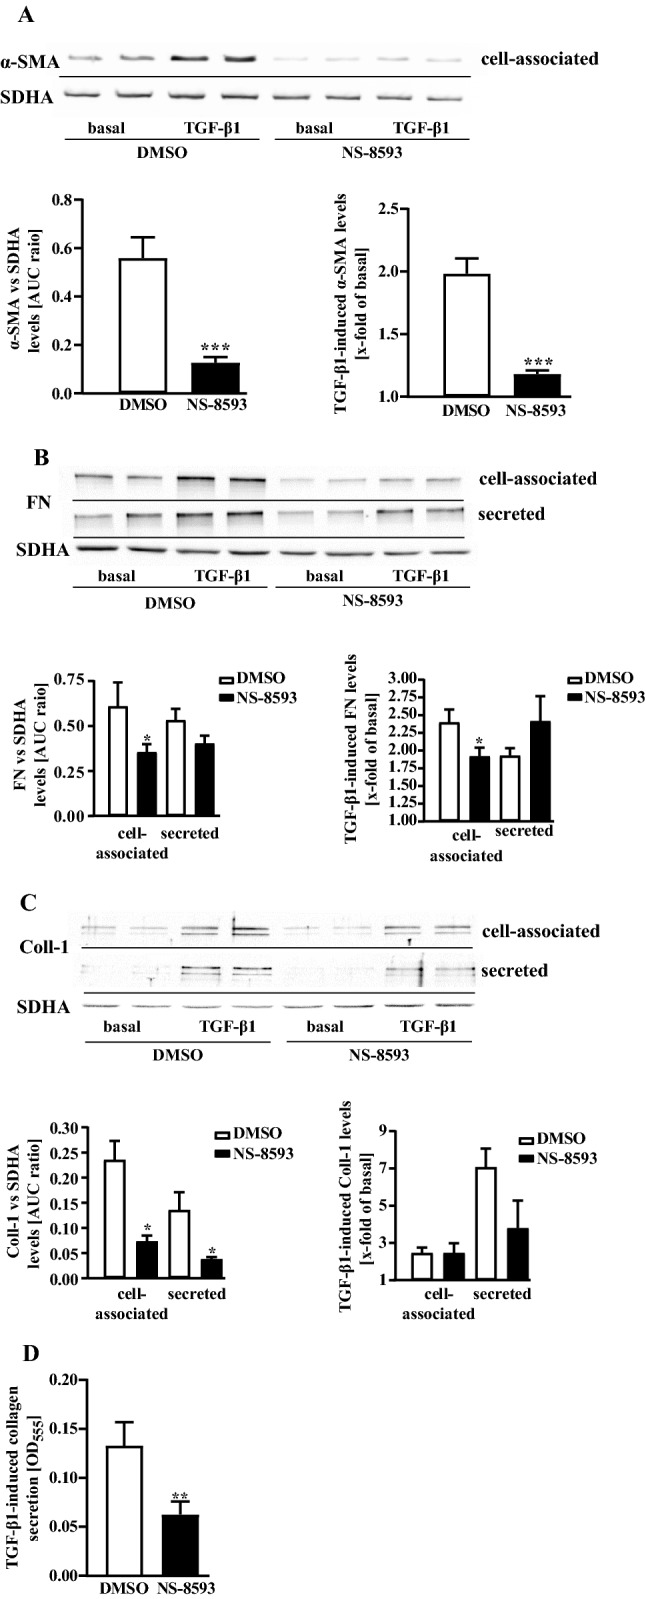
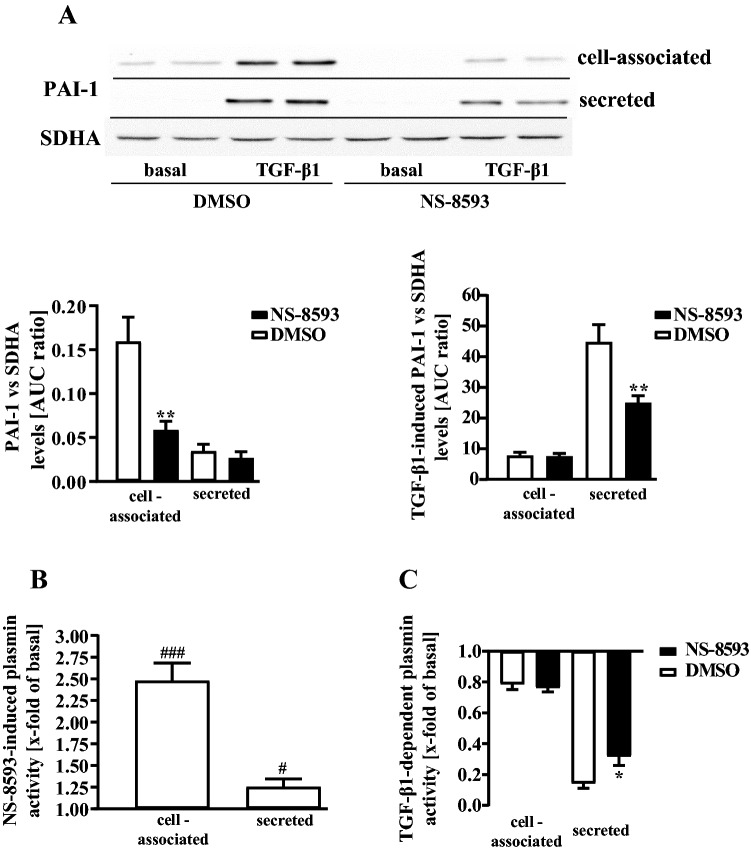
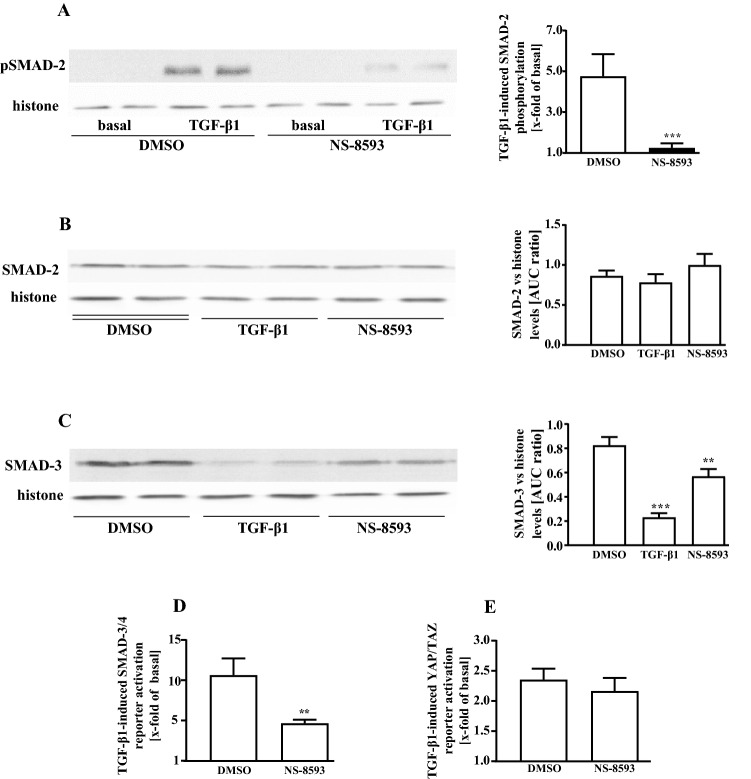
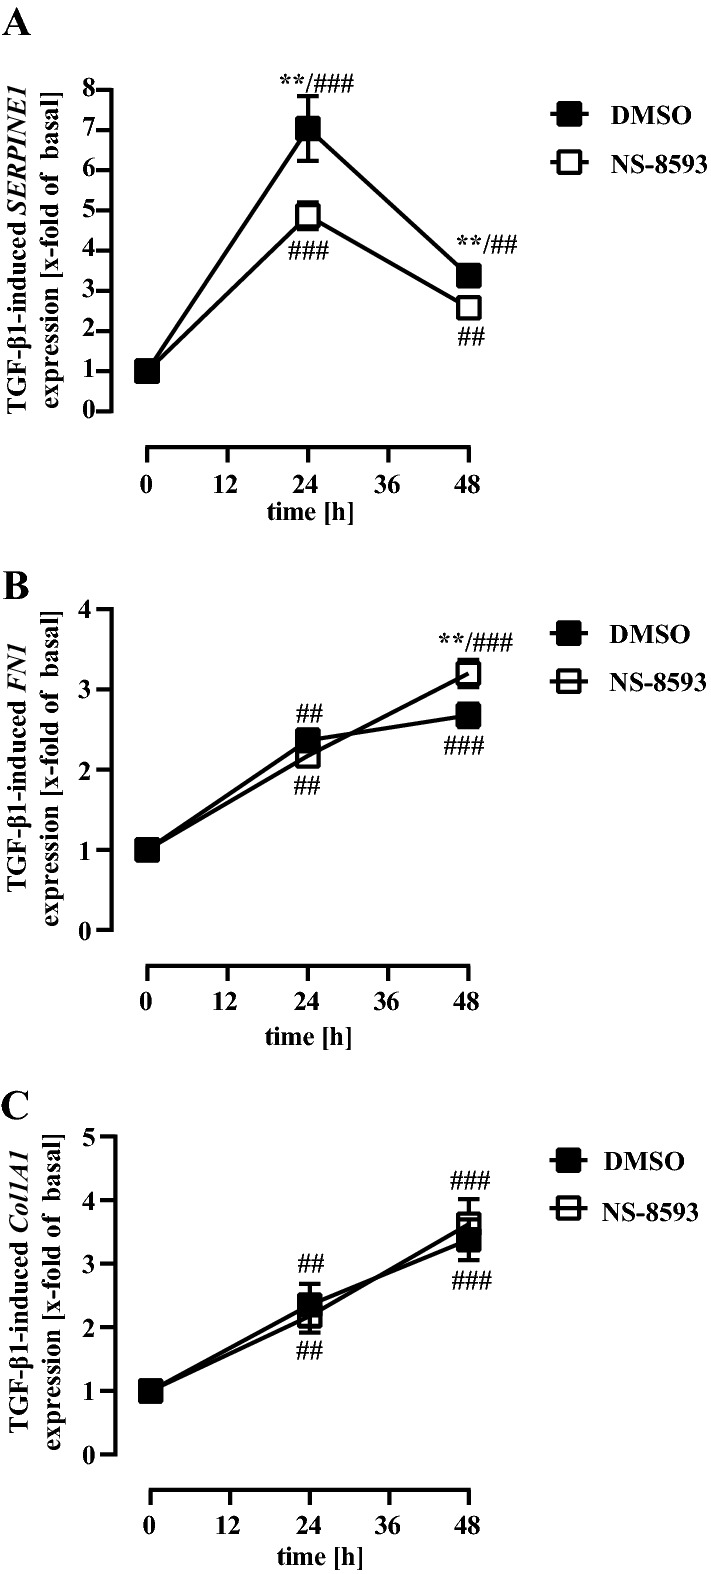
Sustained exposure of the lung to various environmental or occupational toxins may eventually lead to pulmonary fibrosis, a devastating disease with no cure. Pulmonary fibrosis is characterized by excessive deposition of extracellular matrix (ECM) proteins such as fibronectin and collagens. The peptidase plasmin degrades the ECM, but protein levels of the plasmin activator inhibitor-1 (PAI-1) are increased in fibrotic lung tissue, thereby dampening plasmin activity. Transforming growth factor-β1 (TGF-β1)-induced activation of SMAD transcription factors promotes ECM deposition by enhancing collagen, fibronectin and PAI-1 levels in pulmonary fibroblasts. Hence, counteracting TGF-β1-induced signaling is a promising approach for the therapy of pulmonary fibrosis. Transient receptor potential cation channel subfamily M Member 7 (TRPM7) supports TGF-β1-promoted SMAD signaling in T-lymphocytes and the progression of fibrosis in kidney and heart. Thus, we investigated possible effects of TRPM7 on plasmin activity, ECM levels and TGF-β1 signaling in primary human pulmonary fibroblasts (pHPF). We found that two structurally unrelated TRPM7 blockers enhanced plasmin activity and reduced fibronectin or PAI-1 protein levels in pHPF under basal conditions. Further, TRPM7 blockade strongly inhibited fibronectin and collagen deposition induced by sustained TGF-β1 stimulation. In line with these data, inhibition of TRPM7 activity diminished TGF-β1-triggered phosphorylation of SMAD-2, SMAD-3/4-dependent reporter activation and PAI-1 mRNA levels. Overall, we uncover TRPM7 as a novel supporter of TGF-β1 signaling in pHPF and propose TRPM7 blockers as new candidates to control excessive ECM levels under pathophysiological conditions conducive to pulmonary fibrosis.

Keywords: Plasmin; Primary human lung fibroblasts; Pulmonary fibrosis; TGF-β1; TRPM7.


Conflict of interest statement

The authors declare no conflict of interest.

Figures

Fig. 1
Fig. 1
Detection of plasmin activity in living pHPF by D-Val-Leu-Lys-AMC. a D-Val-Leu-Lys-AMC (50 µM) was incubated with unstimulated pHPF, without any cells or with fresh medium for 3 h at 37 °C and secreted and cell-associated fluorescence measured. Bars represent SEM of RLU, n = 10. b secreted and c cell-associated plasmin activity was measured after incubating the cells with Plg (5 or 25 µg/ml) for 24 h at 37 °C. α2-antiplasmin (500 nM) was co-administrated with D-Val-Leu-Lys-AMC. Bars represent SEM of RLU, n = 4. d Plasmin activity was measured after stimulation of the cells with TGF-β1 (2 ng/ml) for 24 h. Bars represent SEM of x-fold of basal values, n = 10. Statistical analysis was performed using one‐way ANOVA (ac) followed by Tukey’s post-test or one- and two-sample t test (in c) using the GraphPad prism software 9.1. Asterisks indicate in a significant differences to “no cells”, in b and c to basal and in d between the cellular fractions. Hash signs indicate significant differences to 1.0
Fig. 2
Fig. 2
Detection of plasmin activity in living pHPF. a pHPF were stimulated with NS-8593 (25 or 50 µM), with waixenicin A (10 µM) or apamin (100 nM) for 24 h and cell numbers determined using SRB. For NS-8593 corresponding DMSO and for waixenicin A ethanol controls were used. Bars represent SEM of x-fold of basal (DMSO or ethanol) values, n = 4–6. b pHPF were stimulated with NS-8593 (25 or 50 µM), with waixenicin A (10 µM) or apamin (100 nM) for 24 h and cell-associated and secreted plasmin activity determined. For NS-8593 corresponding DMSO and for waixenicin A ethanol control were used. Bars represent SEM of x-fold of basal values, n = 4–6. c Cell-associated plasmin activity was measured after stimulation of the cells with TGF-β1 (2 ng/ml) or NS-8593 (25 µM) for 24 h. Bars represent SEM of x-fold of basal values, n = 4. In b, data obtained with two distinct donors provided from PromoCell (C-12360) and in c, from one donor provided by Lonza (CC-2512) are shown. Statistical analysis was performed using one-sample t test or one‐way ANOVA followed by Tukey´s post-test using the GraphPad prism software 9.1. Asterisks indicate in b significant differences between the cellular fractions and in a and c to 1.0. In b hash signs indicate significant differences to 1.0
Fig. 3
Fig. 3
Detection of plasmin activity in living pHPF. pHPF were transfected with a pool of two distinct siRNAs against TRPM7 or a random control siRNA. In a 72 h post transfection of TRPM7 specific or control siRNAs cell numbers were determined using SRB (left y-axes) or TRPM7 mRNA detected by qRT-PCR (right y-axes). In b plasmin activity of unstimulated cells was determined. Bars represent SEM of x-fold of the control siRNA, n = 4. c 48 h post transfection pHPF were stimulated with TGF-β (2 ng/ml) or NS-8593 (25 µM) for 24 h and secreted (TGF-β1) or cell-associated (NS-8593) plasmin activity determined. Bars represent SEM of x-fold of basal values, n = 4. Statistical analysis was performed using one-sample t test or one‐way ANOVA followed by Tukey s post-test using the GraphPad prism software 9.1. Asterisks indicate in a and b significant differences to 1.0 and in c between control and TRPM7 siRNA
Fig. 4
Fig. 4
Detection of PAI-1 protein levels in pHPF. a cells were stimulated with NS-8593 (25 µM) and b with waixenicin A (10 µM) for 24 h and protein amount of PAI-1 or SDHA (loading control) determined. SDHA control of the cellular fraction was also used for the secreted fraction. Blots of the cellular fraction were cut in half and the upper part used for detection of PAI-1 and the lower part for SDHA. Resulting signals were quantified by densitometry and AUC ratios between PAI-1 and SDHA calculated. One set of representative blots is shown. Bars represent SEM of % AUC ratios, n = 4. Statistical analysis was performed using one‐way ANOVA followed by Tukey’s post-test using the GraphPad prism software 9.1. Asterisks indicate significant differences between basal (DMSO or EtOH) and the TRPM7 blocker
Fig. 5
Fig. 5
Detection of fibronectin (FN) protein levels in pHPF. a cells were stimulated with NS-8593 (25 µM) and b with waixenicin A (10 µM) for 24 h and protein amount of FN or SDHA (loading control) determined. SDHA control of the cellular fraction was also used for the secreted fraction. Blots of the cellular fraction were cut in half and the upper part used for detection of FN and the lower part for SDHA. Resulting signals were quantified by densitometry and AUC ratios between FN and SDHA calculated. One set of representative blots is shown. Bars represent SEM of % AUC ratios, n = 3. Statistical analysis was performed using one‐way ANOVA followed by Tukey’s post-test using the GraphPad prism software 9.1. Asterisks indicate significant differences between basal (DMSO or EtOH) and the TRPM7 blocker
Fig. 6
Fig. 6
Detection of FMT markers in pHPF treated with TGF-β1. pHPF were stimulated with TGF-β1 (2 ng/ml) for 48 h. Protein amount of α-SMA in a, of PAI-1 in b, of FN in c and of collagen-1 (Coll-1) in d was determined in the cell-associated and secreted fraction by western blotting. SDHA control of the cellular fraction was also used for the secreted fraction. Blots of the cellular fraction were cut in half and the upper part used for detection of α-SMA, PAI-1, FN or Coll-1 and the lower part for SDHA. Resulting signals were quantified by densitometry and AUC ratios of α-SMA, PAI-1, FN or Coll-1 and SDHA calculated. One set of representative blots is shown. Bars represent SEM of % AUC ratios, n = 3–5. Statistical analysis was performed using one‐way ANOVA followed by Tukey’s post-test using the GraphPad prism software 9.1. Asterisks indicate significant differences between basal and TGF-β1
Fig. 7
Fig. 7
Detection of FMT markers in pHPF co-treated with TGF-β and NS-8593. pHPF were stimulated with TGF-β1 (2 ng/ml) or NS-8593 (25 µM) for 48 h alone or together with both ligands. Protein amount of α-SMA in a, of FN in b and of collagen-1 (Coll-1) in c was determined in the cell-associated and secreted fraction by western blotting. SDHA control of the cellular fraction was also used for the secreted fraction. Blots of the cellular fraction were cut in half and the upper part used for detection of α-SMA, FN or Coll-1 and the lower part for SDHA. Resulting signals were quantified by densitometry and AUC ratios of α-SMA, FN or Coll-1 and SDHA calculated. One set of representative blots is shown. Bars represent SEM of % AUC ratios (NS-8593) or x-fold of basal values (TGF-β1), n = 3–5. In d, pHPF were stimulated with TGF-β1 (2 ng/ml) alone or together with NS-8593 (25 µM) for 48 h and secreted collagen levels determined by Sircol™ soluble collagen assay. Bars represent SEM of OD555 values, n = 5. Statistical analysis was performed using one‐way ANOVA followed by Tukey’s post-test using the GraphPad prism software 9.1. Asterisks indicate significant differences between DMSO and NS-8593
Fig. 8
Fig. 8
Detection of PAI-1 protein levels and plasmin activity in pHPF co-treated with TGF-β1 and NS-8593. a pHPF were stimulated with TGF-β1 (2 ng/ml) or NS-8593 (25 µM) for 48 h alone or together with both ligands. Protein amount of PAI-1 in the cell-associated and secreted fraction was determined by western blotting. SDHA control of the cellular fraction was also used for the secreted fraction. Blots of the cellular fraction were cut in half and the upper part used for detection of PAI-1 and the lower part for SDHA. Resulting signals were quantified by densitometry and AUC ratios of PAI-1 and SDHA calculated. One set of representative blots is shown. Bars represent SEM of PAI-1/SDHA expression ratios, n = 3–5. Asterisks indicate significant differences between DMSO and NS-8593, hash signs between basal and TGF-β1. In b, pHPF were stimulated with NS-8593 (25 µM) alone and in c only with TGF-β1 (2 ng/ml) or together with NS-8593 (25 µM) for 48 h and plasmin activity determined. In b, bars represent SEM of x-fold of basal (DMSO), n = 5. In c, bars represent SEM of x-fold of basal values, n = 5. Statistical analysis was performed using one-sample t test or one‐way ANOVA followed by Tukey’s post-test using the GraphPad prism software 9.1. In a, asterisks indicate significant differences between DMSO and NS-8593 in the absence of TGF-β and hash signs in the presence of TGF-β. In b, hash signs indicate significant differences to 1.0. In c, asterisks indicate significant differences between DMSO and NS-8593
Fig. 9
Fig. 9
NS-8593 inhibits TGF-β1-induced SMAD activation in pHPF. pHPF were stimulated with TGF-β1 (2 ng/ml) or NS-8593 (25 µM) for 48 h alone or together with both ligands. In a, the amount of pSMAD-2, in b of total SMAD-2 and in c of total SMAD-3 was determined by western blotting. Histone detection served as a loading control. Blots were cut in half and the upper part used for detection of pSMAD-2, SMAD-2 or SMAD-3 and the lower part for histone. Resulting signals were quantified by densitometry and AUC ratios of pSMAD-2, SMAD-2 or SMAD-3 and histone calculated. One set of representative blots is shown. Bars represent SEM of % AUC ratios, n = 3–8. In d, pHPF were electroporated with the pCAGA-luc reporter and in e with the 8xGTIIC-luciferase plasmid. After 24 h, cells were stimulated with TGF-β1 (2 ng/ml) alone or together with NS-8593 (25 µM) for 48 h and then luciferase activity determined. Bars represent SEM of x-fold over basal values, n = 5. Statistical analysis was performed using one‐way ANOVA followed by Tukey’s post-test using the GraphPad prism software 9.1. Asterisks indicate significant differences to DMSO
Fig. 10
Fig. 10
NS-8593 inhibits TGF-β1-induced SERPINE1 but not FN1 or Col1A1 mRNA expression in pHPF. pHPF were stimulated with TGF-β1 (2 ng/ml) for 24 or 48 h alone or together with NS-8593 (25 µM). In a, SERPINE1, in b FN1 and in c Col1A1 mRNA was determined by qRT-PCR. Data are represented as SEM of x-fold of basal values, n = 4. Statistical analysis was performed using two‐way ANOVA followed by Tukey’s post-test using the GraphPad prism software 9.1. Asterisks indicate significant differences to DMSO, hash signs to time point zero

Similar articles

Cited by

References

    1. Andreasen PA, Egelund R, Petersen HH. The plasminogen activation system in tumor growth, invasion, and metastasis. Cell Mol Life Sci. 2000;57(1):25–40. doi: 10.1007/s000180050497. - DOI - PMC - PubMed
    1. Bharadwaj AG, Holloway RW, Miller VA, Waisman DM. Plasmin and plasminogen system in the tumor microenvironment: implications for cancer diagnosis, prognosis, and therapy. Cancers (basel) 2021 doi: 10.3390/cancers13081838. - DOI - PMC - PubMed
    1. Boag AH, Colby TV, Fraire AE, et al. The pathology of interstitial lung disease in nylon flock workers. Am J Surg Pathol. 1999;23(12):1539–1545. doi: 10.1097/00000478-199912000-00012. - DOI - PubMed
    1. Breton JD, Heydet D, Starrs LM, Veldre T, Ghildyal R. Molecular changes during TGFbeta-mediated lung fibroblast-myofibroblast differentiation: implication for glucocorticoid resistance. Physiol Rep. 2018;6(7):e13669. doi: 10.14814/phy2.13669. - DOI - PMC - PubMed
    1. Chubanov V, Gudermann T. Mapping TRPM7 function by NS8593. Int J Mol Sci. 2020 doi: 10.3390/ijms21197017. - DOI - PMC - PubMed

MeSH terms