. 2022 Jul;4(7):856-866.
doi: 10.1038/s42255-022-00605-w. Epub 2022 Jul 21.

TFEB induces mitochondrial itaconate synthesis to suppress bacterial growth in macrophages

Affiliations

TFEB induces mitochondrial itaconate synthesis to suppress bacterial growth in macrophages

Ev-Marie Schuster et al. Nat Metab. 2022 Jul.

Abstract

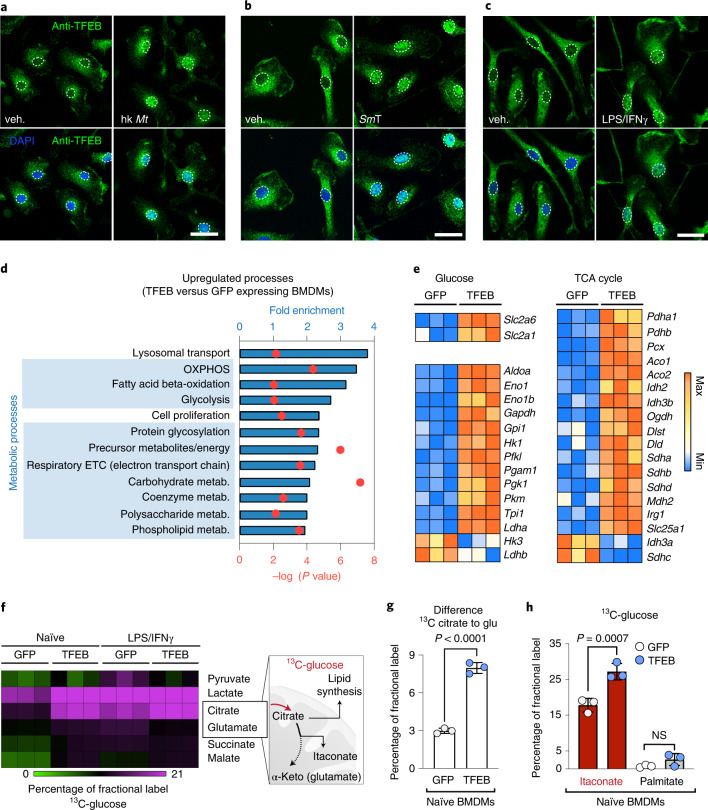
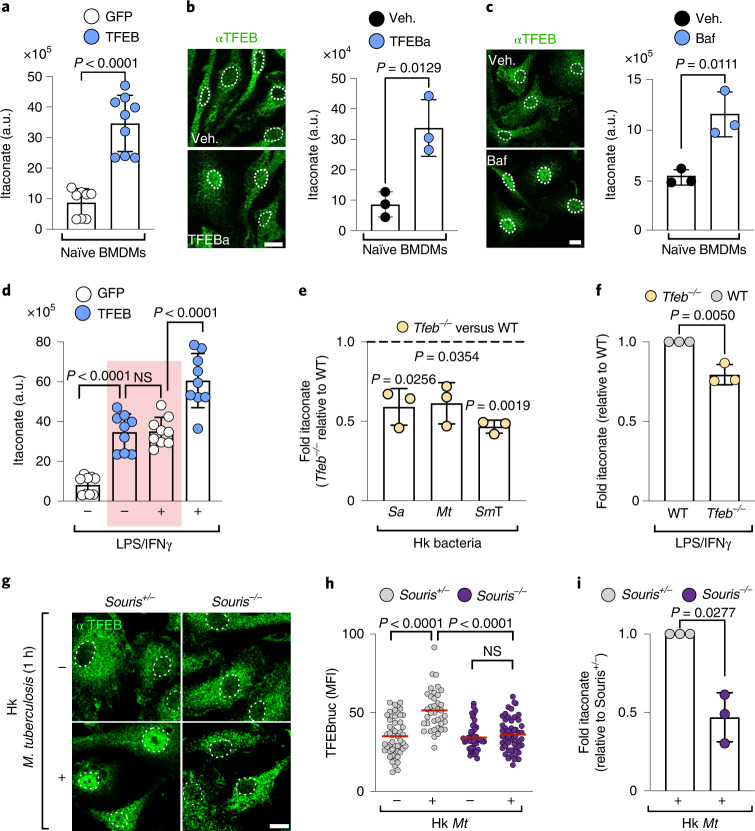
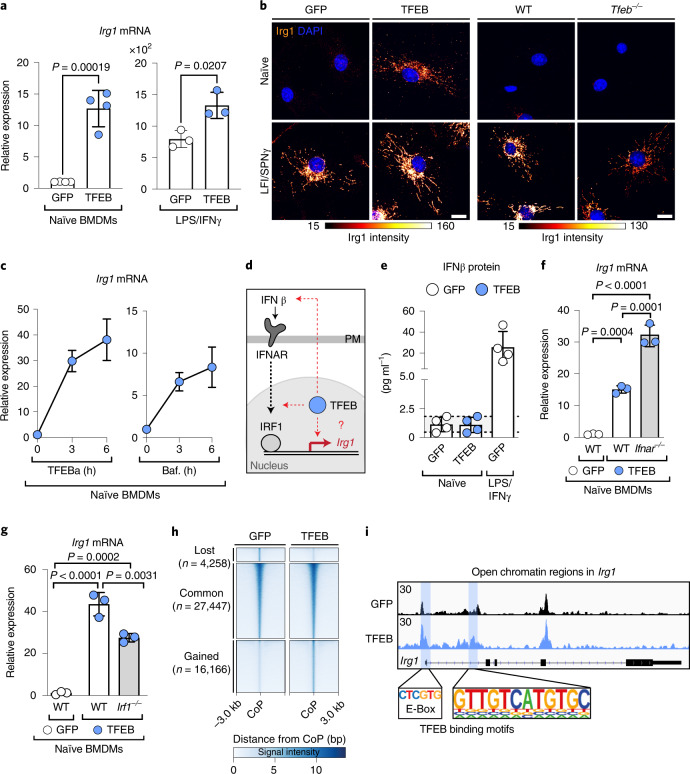
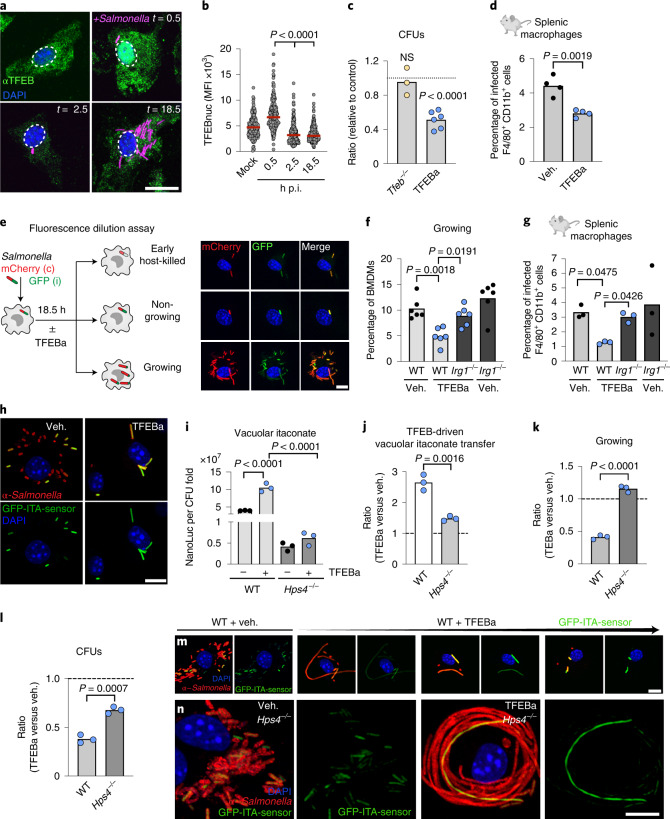
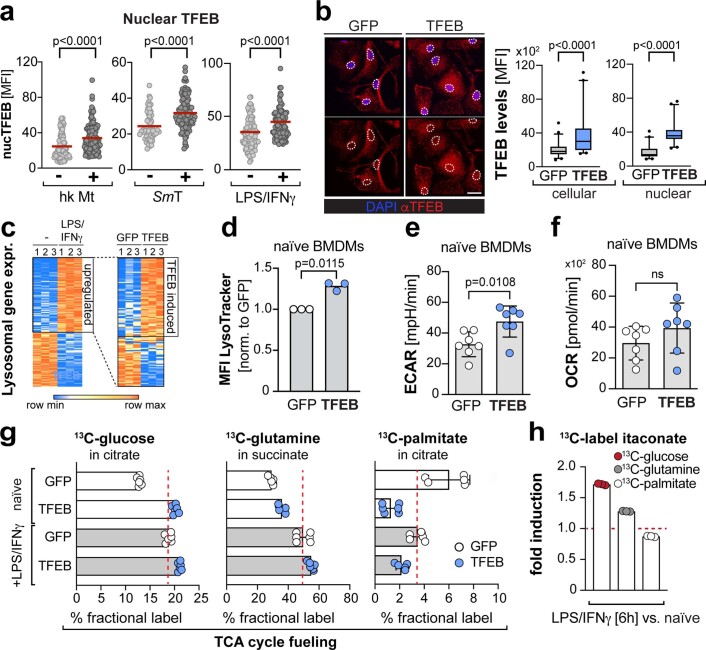
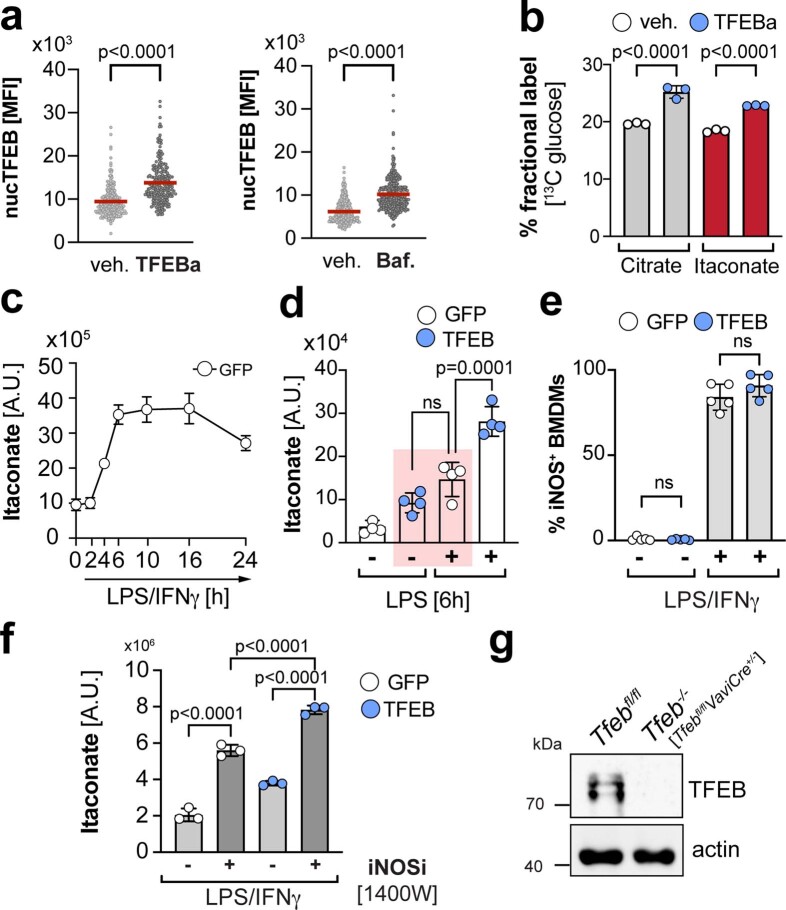
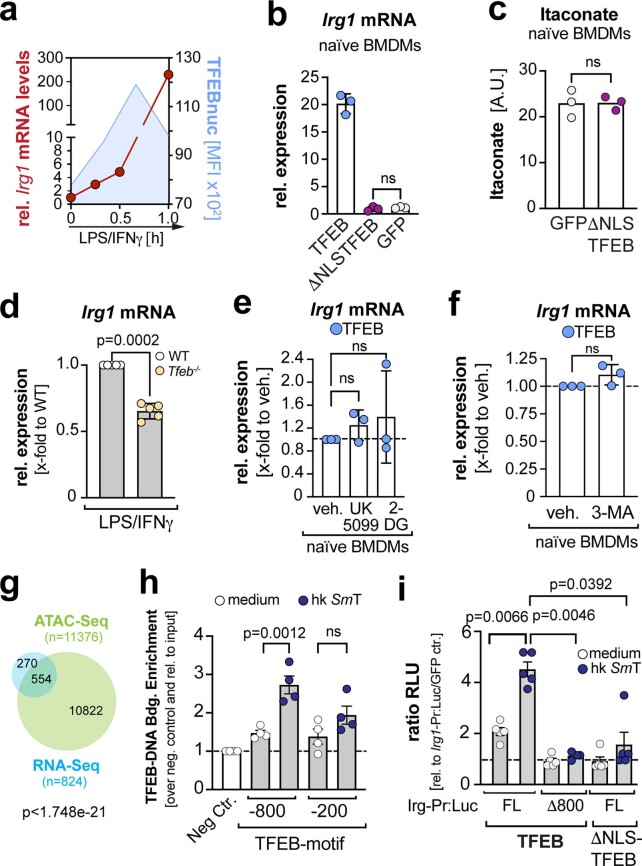
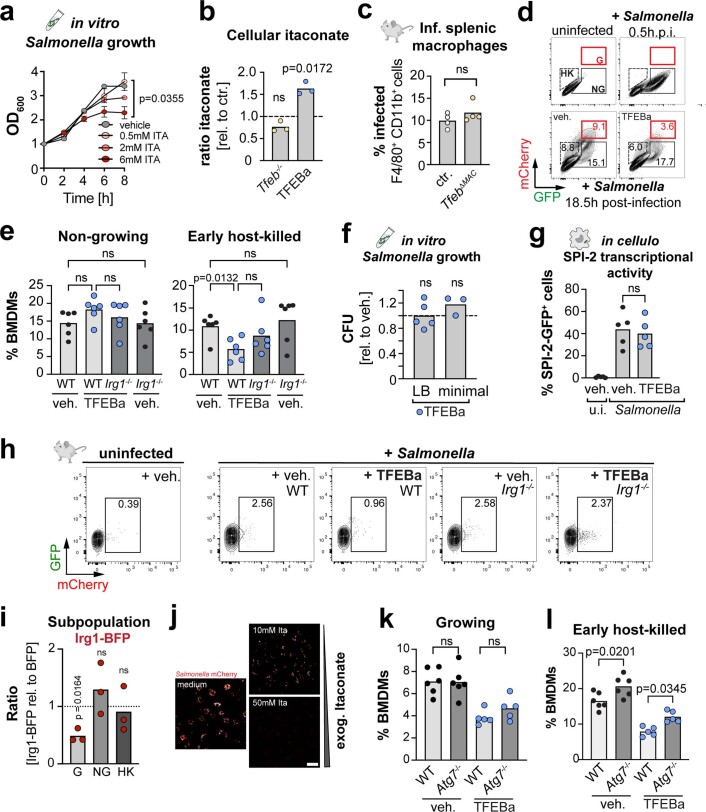
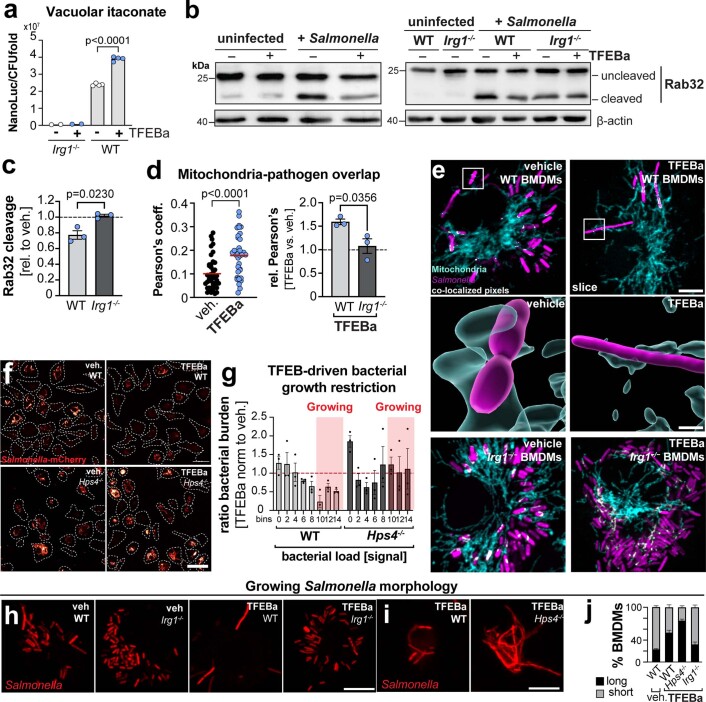
Successful elimination of bacteria in phagocytes occurs in the phago-lysosomal system, but also depends on mitochondrial pathways. Yet, how these two organelle systems communicate is largely unknown. Here we identify the lysosomal biogenesis factor transcription factor EB (TFEB) as regulator for phago-lysosome-mitochondria crosstalk in macrophages. By combining cellular imaging and metabolic profiling, we find that TFEB activation, in response to bacterial stimuli, promotes the transcription of aconitate decarboxylase (Acod1, Irg1) and synthesis of its product itaconate, a mitochondrial metabolite with antimicrobial activity. Activation of the TFEB-Irg1-itaconate signalling axis reduces the survival of the intravacuolar pathogen Salmonella enterica serovar Typhimurium. TFEB-driven itaconate is subsequently transferred via the Irg1-Rab32-BLOC3 system into the Salmonella-containing vacuole, thereby exposing the pathogen to elevated itaconate levels. By activating itaconate production, TFEB selectively restricts proliferating Salmonella, a bacterial subpopulation that normally escapes macrophage control, which contrasts TFEB's role in autophagy-mediated pathogen degradation. Together, our data define a TFEB-driven metabolic pathway between phago-lysosomes and mitochondria that restrains Salmonella Typhimurium burden in macrophages in vitro and in vivo.


Conflict of interest statement

A.B. is a cofounder of CASMA Therapeutics. All other authors declare no competing interests.

Figures

Fig. 1
Fig. 1. TFEB activation drives metabolic gene expression in macrophages.
ac, Images of endogenous TFEB visualized by immunofluorescence in BMDMs treated for 30 min with heat-killed M. tuberculosis (hk Mt, 10 µg ml−1) (a), living S. Typhimurium (SmT, MOI 5) (b) or LPS/IFNγ (15 min) (c). Dotted lines indicate cell nuclei. Scale bars, 10 µm. Images are representative of n = 2 independent experiments. d,e, Analysis of RNA-seq data. d, Top overrepresented biological processes among significantly upregulated genes from RNA-seq analysis of TFEB-GFP-relative to GFP-expressing naïve BMDMs. e, RNA-seq analysis of glucose metabolism and TCA-cycle genes that are significantly differentially expressed between TFEB-GFP- and GFP-expressing BMDMs. Data stem from n = 1 biological replicate with n = 3 technical replicates. fh, Metabolic labelling of BMDMs with 13C-glucose in the presence or absence of LPS/IFNγ for 6 h measured by GC–MS/MS. f, Results of 13C fractional label of TCA-cycle metabolites. g, Quantification of 13C-glucose fractional label lost between citrate and glutamate. h, 13C-glucose label in itaconate and palmitate in naïve TFEB-GFP- and GFP-expressing BMDMs. g,h, Bars show mean ± s.d. of n = 3 independent biological replicates, P values were calculated using unpaired, two-sided Student’s t-test (g) and one-way analysis of variance (ANOVA) with Tukey’s post hoc test (h), NS P > 0.05. glu., glutamate, α-keto., alpha-ketoglutarate, veh., vehicle. Source data
Fig. 2
Fig. 2. TFEB is a novel regulator of itaconate production.
ac, Intracellular itaconate levels quantified by LC–MS on the basis of the area under the curve. a.u., arbitrary units. Itaconate was measured in naïve BMDMs (a) transduced with the indicated constructs or treated for 24 h with 5 mM TFEBa (b) or 100 nM Bafilomycin A1 (Baf) (c). Bars show mean ± s.d. of n = 9 (a) and n = 3 (b,c) independent experiments. P values were calculated using unpaired, two-sided Student’s t-test. For b,c, nuclear TFEB translocation was confirmed by immunofluorescence staining. Images are representative for n = 2 independent experiments. See Extended Data Fig. 2a for quantification. Scale bars, 10 µm. Dotted lines in the images outline nuclei on the basis of DAPI signals. d, Intracellular itaconate levels in naïve and 6 h LPS/IFNγ-treated BMDMs. The red rectangle highlights comparable itaconate levels in naïve TFEB-GFP-expressing and LPS/IFNγ-treated GFP-expressing control BMDMs. Bars show mean ± s.d. of n = 9 independent experiments. P values were calculated using one-way ANOVA with Tukey’s post hoc. NS with P > 0.05. e,f, Intracellular itaconate levels in TFEB-deficient (Tfeb−/−) and control BMDMs treated with heat-killed (e) S. aureus (Sa, 106 particles per ml), M. tuberculosis (Mt, 10 µg ml−1) and Salmonella Typhimurium (SmT, MOI 5) for 10 h or LPS/IFNγ (f) for 6 h. Bar graphs represent mean ± s.d., of n = 3 independent experiments. P values were calculated using two-tailed, one-sample t-test. gi, Endogenous TFEB activation and quantification of intracellular itaconate levels in Souris−/− and Souris+/− BMDMs treated with heat-killed M. tuberculosis (10 µg ml−1). g,h, Images depicting TFEB localization (g) and quantification of nuclear TFEB levels (h) at 1 h post-infection (p.i.) of n = 3 independent experiments. Scale bar, 10 µm. Graph shows a mean of n = 52, 38 (Souris+/ with, without hk Mt) and n = 46, 54 (Souris/ with, without hk Mt) cells examined over n = 3 independent experiments. P values were calculated using one-way ANOVA with Tukey’s post hoc. i, Ratio of intracellular itaconate measured by LC–MS in 24 h heat-killed Mt treated Souris−/− versus Souris+/− BMDMs. Bar graph shows a mean ± s.d. of n = 3 independent experiments. P values were calculated using unpaired, two-sided Student’s t-test. Source data
Fig. 3
Fig. 3. TFEB activation induces transcription of Irg1.
a, Relative Irg1 mRNA expression determined by real-time qPCR in naïve or 6 h LPS/IFNγ-treated TFEB-GFP- or GFP-expressing BMDMs. Bars show mean ± s.d. of n = 4 (left) n = 3 (right) independent experiments. P values were calculated using unpaired, two-sided Student’s t-test. b, Images of endogenous Irg1 visualized by immunofluorescence and treated without or with LPS/IFNγ for 6 h in (left) WT BMDMs expressing GFP- or TFEB-GFP, or (right) Tfeb−/− and control BMDMs. Images are representative of n = 3 independent biological experiments. Scale bar, 10 µm. c, Irg1 mRNA expression in BMDMs treated with 5 mM TFEBa or 100 nM Baf. Line graphs show the mean ± s.e.m. of n = 3 (TFEBa) and n = 5 (Baf) independent experiments. d, Schematic of potential mechanisms of TFEB-driven Irg1 expression. e, Quantification of secreted IFNβ protein from naïve TFEB-GFP and GFP-expressing BMDMs. LPS/IFNγ-treated, GFP-expressing BMDMs served as positive control. Bars show mean ± s.d. of n = 4 independent experiments. f,g, Relative Irg1 mRNA expression in naïve WT, Ifnar1−/− (f) or Irf1−/− (g) BMDMs, expressing TFEB-GFP or GFP. Bars show mean ± s.d. of n = 3 independent experiments. P values were calculated using one-way ANOVA, with Tukey’s post hoc. h, Heatmap depicting differentially accessible regions in GFP- and TFEB-GFP-expressing BMDMs, using a window of ±3 kb from the centre of the peak (CoP). Three clusters are represented denoting the commonly (common) accessible sites and the regions that loose or gain accessibility upon TFEB expression (lost and gained, respectively). i, Representative gene tracks from ATAC-seq data of the Irg1 gene region. Blue boxes indicate significantly gained peaks in TFEB-GFP- relative to GFP-expressing BMDMs. The y axis represents the reads per kilobase of transcript per million of mapped reads. Potential TFEB binding sites, derived from motif analysis are highlighted. Data show n = 1 experiment with n = 2 technical repeats. Source data
Fig. 4
Fig. 4. TFEB-driven itaconate production reduces intracellular Salmonella growth in infected macrophages.
a, Indirect immunofluorescence against endogenous TFEB. Scale bar, 15 µm. b, Quantification of nuclear TFEB levels from a. Graph shows nuclear TFEB mean fluorescence intensity from n = 170 cells examined over n = 3 independent experiments. P values were calculated using one-way ANOVA with Dunnett’s post hoc. c, Ratio of CFUs of Tfeb−/− to WT or TFEBa relative to vehicle-treated BMDMs from n = 3 (Tfeb−/−) or n = 6 (TFEBa) independent experiments. P values were calculated using two-tailed one-sample t-test, NS P > 0.05. d, Percentage of infected splenic macrophages treated with TFEBa or PBS. Bars show mean from n = 4 mice and P values were calculated using unpaired, two-sided Student’s t-test. e, Strategy to identify different Salmonella subpopulations inside macrophages and corresponding images. Scale bar, 10 µm. f, Percentage of cells with growing Salmonella in WT or Irg1−/− BMDMs treated or not with TFEBa and analysed by flow cytometry. Bars show mean from n = 6 independent experiments. P values were calculated using one-way ANOVA with Tukey’s post hoc. h, Percentage of infected splenic macrophages of TFEBa- or PBS-treated WT or Irg1−/− mice. Bars show mean from n = 3 mice. P values were calculated using one-way Welch’s ANOVA, with Dunnett’s post hoc test. h, Images of BMDMs infected with GFP-itaconate sensor-carrying Salmonella, treated or not with TFEBa for 18.5 h. Scale bar, 10 µm, images are representative of n = 4 independent experiments. i,j, Luciferase measurements from NanoLuc-ITA-Salmonella-infected BMDMs (normalized to fold-change CFU) (i) and as ratio of TFEBa- to vehicle-treated BMDMs (j). Graphs show mean of n = 3 independent biological experiments. P values were calculated using one-way ANOVA with Tukey’s post hoc test (i) and unpaired, two-sided Student’s t-test (j). k, Ratio of cells containing growing bacteria in TFEBa and vehicle-treated WT or Hps4−/− BMDMs (based on Extended Data Fig. 5g). Bars show mean of n = 3 independent experiments. P values calculated using unpaired, two-sided Student’s t-test. l, Ratio of CFUs in TFEBa and vehicle-treated WT or Hps4−/− BMDMs. Dashed line indicates vehicle-treated control level. Bars show mean of n = 3 independent experiments. P values were calculated using unpaired, two-sided Student’s t-test. m,n, Images of GFP-ITA-Salmonella-infected WT and Hps4−/− BMDMs, treated or not with TFEBa. Images are representative of n = 3 independent experiments. Scale bars, 10 µm. Source data
Extended Data Fig. 1
Extended Data Fig. 1. TFEB activation induces the expression of lysosomal and metabolic genes.
a, Quantification of nuclear TFEB levels from BMDMs treated or not for 30 min with heat-killed Mycobacterium tuberculosis (hk Mt, 10 µg/mL), living Salmonella Typhimurium (SmT, MOI 5), or LPS/IFNγ (15 min), related to Fig. 1a-c. Quantification represents (a) N = 101, 117 (b) N = 56, 115, (c) N = 109, 99 cells examined over n = 2 independent experiments. Red lines indicate the mean and p-values were determined using unpaired, two-sided Student’s t-test. b, Quantification of cellular and nuclear TFEB induction in the TFEB activation mimic and GFP-expressing control cells, quantified from images of cells immune-stained against endogenous TFEB. Scale bar: 10 µm. Box plots (box: 25–75 percentile, middle line: median, whiskers: 5-95 percentile) of N = 52 (GFP), N = 41 (TFEB) cells examined over of n = 2 independent experiments. P values were calculated using unpaired, two-sided Student’s t-test. c, Heatmaps of lysosomal genes from RNA-seq analysis in: (left panel) naïve versus 24 h LPS/IFNγ treated, GFP-expressing BMDMs; (right panel) naïve BMDMs expressing TFEB-GFP or GFP. d, Quantification of LysoTracker fluorescence in TFEB-GFP- and GFP-expressing BMDMs by flow cytometry. Bars represent mean ± s.d. of n = 3 independent experiments. Pvalues were calculated using two-tailed one-sample t-test. MFI: median fluorescent intensity. e,f, Metabolic measurements from TFEB-GFP- or GFP-expressing BMDMs, showing (e) extracellular acidification rates (ECAR) and (f) oxygen consumption rates (OCR). Bars show mean ± s.d. from n = 7 independent biological replicates. Statistics derived from two-sided, unpaired Student’s t-tests. n.s. for P > 0.05. g,h, TCA cycle fueling determined by metabolic labelling of TFEB-GFP- and GFP-expressing BMDMs with 13C-glucose, or 13C-glutamine, or 13C-palmitate in the presence or absence of LPS/IFNγ. Results are based on GC-MS/MS measurements. (g) Bar graphs present fractional label of 13C-glucose in citrate, 13C-glutamine in succinate, and 13C-palmitate in citrate. Bars show mean ± s.d. from (left and middle panel) n = 6 and (right panel) n = 5 (GFP) and n = 6 (TFEB) biologically independent samples. (h) Itaconate-fueling from 13C-labelled glucose, glutamine and palmitate in 6 h LPS/IFNγ-treated BMDMs relative to naïve BMDMs. Bars show mean ± s.d. from n = 3 biologically independent samples. Source data
Extended Data Fig. 2
Extended Data Fig. 2. TFEB activation induces itaconate synthesis.
a, Quantification of nuclear TFEB levels upon TFEB activation with TFEBa- or Baf-treatment in naïve BMDMs. Related to images in Fig. 2b,c. Graph shows nuclear TFEB levels of N = 240/207 (veh/TFEBa) and N = 326/315 (veh/Baf) individual cells examined over n = 2 independent experiments. P values were calculated using unpaired, two-sided Student’s t-test. b, TCA cycle and itaconate fueling determined by metabolic labelling of TFEBa- and vehicle-treated BMDMs with 13C-glucose. Results are based on GC-MS/MS measurements. Bars show mean ± s.d. of n = 3 biologically independent samples. P values were calculated using one-way ANOVA with Tukey’s post hoc. c, Intracellular itaconate levels measured by LC-MS in BMDMs treated with LPS/IFNy for the indicated time frames. Line graph shows mean ± s.e.m. of n = 5 biologically independent samples d, Intracellular itaconate levels in naïve and 6 h LPS-treated GFP- or TFEB-GFP-expressing BMDMs. Bar graph shows mean ± s.d. of n = 4 biologically independent samples. P-values were calculated using one-way ANOVA with Tukey’s post-hoc. n.s. with P > 0.05 e, iNOS expression determined by flow cytometry, in TFEB- and GFP-expressing BMDMs treated or not with LPS/IFNγ for 24 h. Bars represent mean ± s.d. of n = 3 independent experiments. P values were calculated using one-way ANOVA with Tukey’s post-hoc, n.s. with P > 0.05. f, Itaconate levels measured by LC/MS from 24 h LPS/IFNγ-treated GFP- or TFEB-expressing cells, treated or not with the iNOS inhibitor 1400 W. Bars represent mean ± s.d. of n = 3 biologically independent samples. P values were calculated using one-way ANOVA with Tukey’s post-hoc. g, Western Blot against endogenous TFEB in TFEB-deficient (Tfeb−/−) and respective control BMDMs. Source data
Extended Data Fig. 3
Extended Data Fig. 3. TFEB activation drives Irg1 expression independent of its metabolic targets and autophagy.
a, Temporal correlation of Irg1 mRNA expression from qRT-PCR (red) and nuclear TFEB levels from immunofluorescence imaging (blue) in BMDMs stimulated with LPS/IFNγ. Line curves show mean of n = 1 independent experiment. b, Irg1 mRNA expression in naïve Tfeb−/− BMDMs, expressing TFEB-GFP, GFP or ΔNLS-TFEB-GFP. Graph shows mean ± s.d. of n = 3 independent experiments. P values were calculated using one-way ANOVA with Tukey’s post-hoc, n.s. P > 0.05. c, Itaconate levels measured by LC-MS in GFP- or ΔNLS TFEB-GFP-expressing BMDMs. Bar shows mean of n = 3 independent experiments. P values were calculated using unpaired, two-sided Student’s t-test. n.s. for P > 0.05. d, Irg1 mRNA expression in Tfeb−/− and WT BMDMs treated for 6 h with LPS/IFNγ. Graphs show mean ± s.d. of n = 5 independent experiments. P values were calculated using two-tailed, one-sample t-test. e,f, Irg1 mRNA expression in naïve TFEB-GFP-expressing BMDMs treated with vehicle, (e) 4 µM UK5099, 10 mM 2-DG, or (f) 10 mM 3-MA for 24 h. Graphs show mean ± s.d. of n = 3 independent experiments. P values were calculated using (e) one-way ANOVA with Tukey’s post-hoc and (f) two-tailed, one-sample t-test. n.s. for P > 0.05. g, Venn diagram depicting differentially expressed genes (p ≤ 0.01) from RNA-seq analysis (blue) from Fig. 1d, or genes annotated to differentially accessible chromatin regions from ATAC-seq (green) n = 1 independent experiment with N = 2 replicates and the intersections of these data sets in naïve TFEB-GFP- versus GFP-expressing BMDMs. Significance of overlap was calculated with hypergeometric statistical test. h, ChIP-qPCR of iBMDMs stably expressing human TFEB-GFP treated with or without heat-killed SmT (105 particles / mL) for 90 min. Bars show mean ± s.e.m. from n = 4 independent biological experiments. P values were calculated using one-way ANOVA with Tukey’s post-hoc. n.s. for P > 0.05. i, Mouse embryonic fibroblast expressing the indicated TFEB and Irg1-promoter-Luciferase constructs were incubated with medium or heat-killed SmT (105 particles / mL) for 3 h and fold induction of firefly luciferase levels (RLU) was determined in TFEB/Irg1-promoter vs. GFP/Irg1-promoter expressing cells. Bar shows mean ± s.e.m. of n = 5 independent experiments. Pvalues were calculated using one-way Welch’s ANOVA with Dunnett’s post hoc. n.s. for P > 0.05. Source data
Extended Data Fig. 4
Extended Data Fig. 4. TFEB drives itaconate synthesis in infected macrophages to restrain intracellular Salmonella proliferation.
a, Salmonella growth measured in OD600, in the presence of increasing itaconate concentration. Data show mean ± s.e.m. from n = 3 independent biological experiments. P values of the 8 h time points were calculated using one-way ANOVA with Dunnett’s post-hoc. b, Ratios of cellular itaconate of Tfeb−/− to WT or TFEBa- to vehicle-treated BMDMs. Bars show mean of n = 3 independent biological experiments. P values were calculated using two-tailed one-sample t-test, n.s. P > 0.05. c, Percentage of infected macrophages in spleens of TfebΔMac or control mice, three days after i.p. Salmonella infection. Bar shows mean of n = 4 mice. P values were calculated using unpaired, two-sided Student’s t-test. n.s. with P > 0.05. d,e, Flow cytometry analysis of Salmonella subpopulations upon TFEBa- or vehicle- treatment for 18.5 h in WT or Irg1−/− BMDMs. (e) Quantification of (d). Graphs show mean from n = 6 independent experiments. P values were calculated using one-way ANOVA with Tukey’s post-hoc. n.s. for P > 0.05. f, CFUs of Salmonella grown in vitro in LB or minimal medium for 18.5 h with or without TFEBa. CFUs are shown as ratio of TFEBa- to vehicle-treated control samples. Bar graphs show mean ± s.d. of n = 5 (LB) and n = 3 (minimal) independent experiments. P values were calculated using two-tailed one-sample t-test. n.s. for P > 0.05. Dashed lines indicate respective vehicle-treated control cells. g, SPI-2-activation assayed by flow cytometry. BMDMs infected with Salmonella carrying a SPI-2-GFP-reporter and treated with or without TFEBa. Bar graphs show mean percentage of GFP-positive BMDMs from n = 5 independent biological repeats. P values were calculated using one-way ANOVA with Tukey’s post-hoc, n.s. P > 0.05. h, Flow cytometry of Salmonella-mCherry-containing splenic macrophages of WT or Irg1−/− mice i.p. infected and treated with TFEBa or PBS. Plots are representative of n = 3 mice. i, Ratios of Salmonella subpopulations in Irg1-BFP- relative to BFP-expressing BMDMs. Bars show mean from n = 3 independent experiments. P values were calculated using two-tailed one-sample t-test. n.s. for p > 0.05. j, Bacterial load in Salmonella-infected BMDMs treated with exogenous itaconate for 18.5 h. Images are representative of n = 3 independent experiments. Scale bar: 50 µm. k,l, Percentage of BMDMs containing (k) growing or (l) early host-killed Salmonella in WT and autophagy-deficient Atg7−/− BMDMs, treated with TFEBa or vehicle. Data represent mean of n = 6 (veh) and n = 5 (TFEBa) independent experiments. P values were calculated using one-way ANOVA with Tukey’s post-hoc, n.s. for P > 0.05. Source data
Extended Data Fig. 5
Extended Data Fig. 5. TFEB increases vacuolar itaconate levels by modulating Rab32/BLOC3 transfer system.
a, Vacuolar itaconate levels in WT or Irg1−/− BMDMs infected with Salmonella carrying a NanoLuc-itaconate sensor and treated with TFEBa or vehicle for 18 h. Graphs show mean of n = 4 (WT) independent experiments or n = 2 biologically independent samples (Irg1−/−). P values were calculated using one-way ANOVA with Tukey’s post-hoc b,c, Levels of Rab32 cleavage in WT or Irg1−/− BMDMs infected with Salmonella (SmT) and treated or not with TFEBa. (b) Representative Western Blots and (c) quantification of Rab32 cleavage in infected TFEBa- relative to vehicle-treated WT and Irg1−/− BMDMs. Bars show mean ± s.d. from n = 3 independent experiments. P values were calculated using unpaired, two-sided Students t-test. d,e, Co-localization of mitochondria with growing Salmonella. Data show (d) calculated Pearson’s coefficients and coefficient ratio of TFEBa- to vehicle-treated controls in WT and Irg1−/− BMDMs. Left graph: data present N = 44 (veh,) N = 35 (TFEBa) individual cells examined over n = 3 independent experiments. red line: mean. Right graph: Bars shows mean ± s.d. of n = 3 independent experiments. P values were calculated using two-sided, unpaired Student’s t-test. (e) Representative images from (d). Inserts show 3D-rendered surfaces of mitochondria and Salmonella. Scale bars: 5 µm and insert 1 µm. f,g, Images of bacterial load in mCherry-Salmonella–infected WT and Hps4−/− BMDMs, treated or not with TFEBa. (f) Representative images of n = 3 independent experiments. Scale bar: 40 µm, dashed lines indicate cellular outlines. (g) Frequency distribution of (f) shown as ratio of TFEBa- to vehicle-treated BMDMs. Bars represent mean ± s.e.m. from n = 3 independent experiments. Red box shows bins containing BMDMs with growing Salmonella populations. h,i, Images of BMDMs containing Salmonella with filamented morphology. Specified BMDMs were treated with the TFEBa or vehicle for 18.5 h. j, Analysis of (h,i). Percentage of BMDMs with filamented (long) and short Salmonella. Data show mean ± s.e.m. of n = 5 (Irg1−/−) and n = 3 (Hps4−/−) independent experiments. Source data

References

    1. Settembre C, Fraldi A, Medina DL, Ballabio A. Signals from the lysosome: a control centre for cellular clearance and energy metabolism. Nat. Rev. Mol. Cell Biol. 2013;14:283–296. doi: 10.1038/nrm3565. - DOI - PMC - PubMed
    1. Ballabio A, Bonifacino JS. Lysosomes as dynamic regulators of cell and organismal homeostasis. Nat. Rev. Mol. Cell Biol. 2020;21:101–118. doi: 10.1038/s41580-019-0185-4. - DOI - PubMed
    1. Weiss G, Schaible UE. Macrophage defense mechanisms against intracellular bacteria. Immunol. Rev. 2015;264:182–203. doi: 10.1111/imr.12266. - DOI - PMC - PubMed
    1. Sanjuan MA, Milasta S, Green DR. Toll-like receptor signaling in the lysosomal pathways. Immunol. Rev. 2009;227:203–220. doi: 10.1111/j.1600-065X.2008.00732.x. - DOI - PubMed
    1. Gray MA, et al. Phagocytosis enhances lysosomal and bactericidal properties by activating the transcription factor TFEB. Curr. Biol. 2016;26:1955–1964. doi: 10.1016/j.cub.2016.05.070. - DOI - PMC - PubMed

Publication types

LinkOut - more resources