. 2022 Jul 21;12(1):12023.
doi: 10.1038/s41598-022-15539-2.

Interpreting models interpreting brain dynamics

Affiliations

Interpreting models interpreting brain dynamics

Md Mahfuzur Rahman et al. Sci Rep. .

Abstract

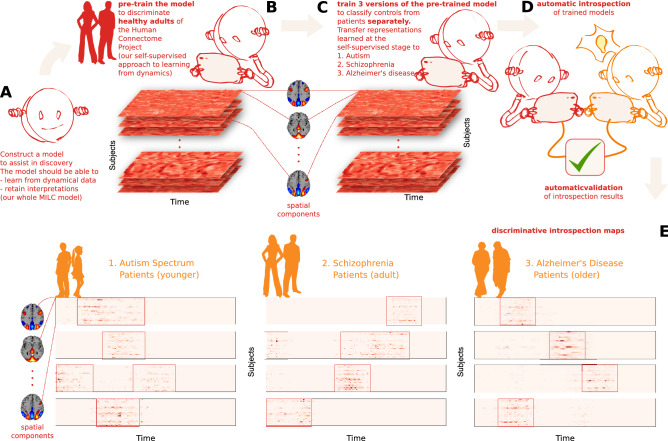
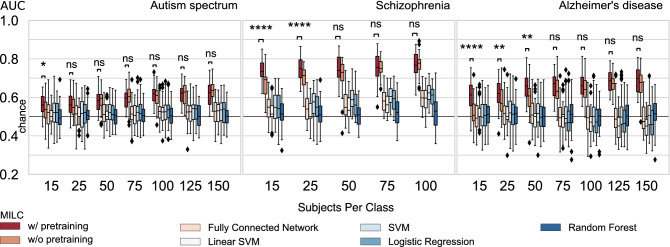
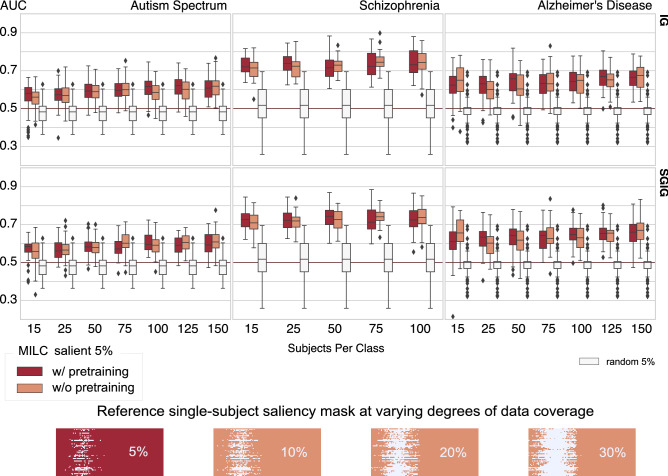
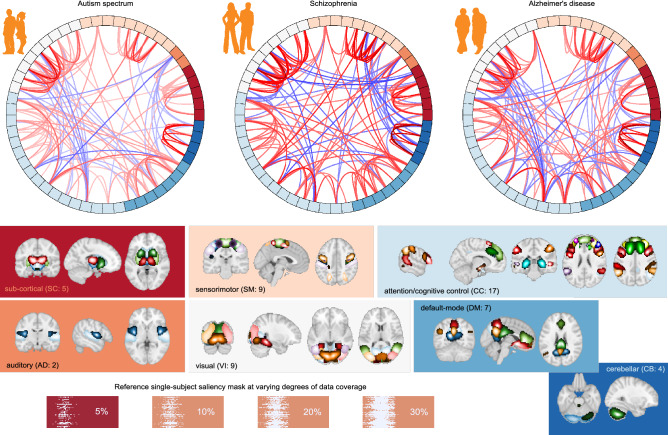
Brain dynamics are highly complex and yet hold the key to understanding brain function and dysfunction. The dynamics captured by resting-state functional magnetic resonance imaging data are noisy, high-dimensional, and not readily interpretable. The typical approach of reducing this data to low-dimensional features and focusing on the most predictive features comes with strong assumptions and can miss essential aspects of the underlying dynamics. In contrast, introspection of discriminatively trained deep learning models may uncover disorder-relevant elements of the signal at the level of individual time points and spatial locations. Yet, the difficulty of reliable training on high-dimensional low sample size datasets and the unclear relevance of the resulting predictive markers prevent the widespread use of deep learning in functional neuroimaging. In this work, we introduce a deep learning framework to learn from high-dimensional dynamical data while maintaining stable, ecologically valid interpretations. Results successfully demonstrate that the proposed framework enables learning the dynamics of resting-state fMRI directly from small data and capturing compact, stable interpretations of features predictive of function and dysfunction.


Conflict of interest statement

The authors declare no competing interests.

Figures

Figure 1
Figure 1
An overview of our approach to model interpretation (created in program Inkscape 1.1.2, http://inkscape.org/release/inkscape-1.1.2). (A) Construct a model for disorder-specific discovery: we divided the entire ICA time courses into multiple sliding windows. Then we fed them into the whole MILC model that learns directly from the disorder signal dynamics and retains interpretations for further introspection. (B) Leverage self-supervised pretraining to distinguish healthy subjects: learned representations assist the model in maintaining its predictive power when downstream training data is limited. (C) Construct a downstream model to discriminate patients from controls for each disorder starting with the pre-trained whole MILC weights: transfer of representations learned during pretraining simplifies convergence and balances overfitting. (D) Introspection of the trained downstream models: we compute saliency maps as a rationale used by the model behind every prediction using interpretability methods to extract meaningful, distinctive parts of the data. Subsequently, the estimated salient aspects of the dynamics go through an automatic validation process. To this end, we use the most salient features to retrain an independent SML model that confirms the salience of the features. This information can then be relayed to a human expert in the relevant field to interpret further and advance knowledge about the disorders. (E) Examples of saliency maps as deemed highly predictive by the models for their predictions in three different discriminative tasks. Please note that the red boxes mark the highly discriminative salient parts of the data.
Figure 2
Figure 2
The main results from the whole MILC architecture and its comparison with standard machine learning models (SML). Apparently, the whole MILC model, in general, can learn from the raw data where traditional SML models fail to maintain their predictive capacity. Moreover, the whole MILC w/ pretraining substantially improves the latent representations as reflected in the improved accuracy compared to the whole MILC w/o pretraining. Specifically, in most small data cases, the whole MILC w/ pretraining outperformed the whole MILC w/o pretraining across the datasets. However, as expected, when we gradually increased the number of subjects during training, the effect of pretraining on the classification performance diminished, and both configurations of whole MILC did equally well. We verified this trend over three datasets that correspond to autism spectrum disorder, schizophrenia, and Alzheimer’s disease. Please note the Wilcoxon rank test results between w/ and w/o pretraining performance of the model as marked by asterisk (*) and “ns” (not significant), where ns:p>5e-2, :1e-2<p5e-2, :1e-3<p1e-2, :1e-4<p1e-3, :p1e-4.
Figure 3
Figure 3
RAR employs SVM to classify the FNCs of the top 5% of the salient input data as estimated by the whole MILC model’s predictions. We used integrated gradients (IG) and smoothgrad integrated gradients (SGIG) to compute feature attributions. It is evident that when an independent classifier (SVM) learned on every subject’s most salient 5% data, the predictive power was significantly higher compared to the same SVM model trained on the randomly chosen same amount of data. In other words, the poor performance with randomly selected data parts indicates that other parts of the data were not exclusively discriminative as the whole MILC estimated salient 5% data parts. We also notice that sample masks over a different percentage of data coverage gradually obscured the localization of the discriminative activity within the data. Though the SVM model gradually became predictive with increased randomly selected data coverage, which we show in Supplementary Information, this performance upgrade was due to the gradual improvement in functional connectivity estimation and not attributable to the disease-specific localized parts within the data. For every disorder (Autism spectrum disorder, Schizophrenia, and Alzheimer’s disease), the higher AUC at this 5% indicates stronger relevance of the salient data parts to the underlying disorders. Furthermore, the RAR results reflect that in most cases, when whole MILC was trained with limited data, the w/ pretraining models estimated feature attributions more accurately than the models w/o pretraining.
Figure 4
Figure 4
Top 10% FNC for patients computed using most 5% of the salient data as thresholded using feature attribution maps (saliency maps) for different disorders (created in programs MNE 1.1.dev0, https://mne.tools/dev/ and Inkscape 1.1.2, http://inkscape.org/release/inkscape-1.1.2). Apart from the high predictive capacity of the salient data, we observed some intriguing differences among these connectograms. The autism spectrum disorder exhibits the lowest between-domain FNC. However, salient data in autism disorder highlights domain changes in specific cerebellum, sensorimotor, and subcortical domains. The model-identified salient data reflects the most widespread pattern for schizophrenia and is consistent with the literature showing cerebellum interaction across multiple domains and sensorimotor changes. The predictive features for Alzheimer’s disease mainly concentrate on visual and cognitive interactions.
Figure 5
Figure 5
(A) Full FNC for patients computed using most 5% of the salient data selected based on feature attribution values for different disorders. (B) Static FNC (i.e., using 100% data) matrices for patients of different disorders. The FNC based on 5% salient data (A) does indeed convey the same focused dynamic information as currently assessed in FNC matrices based on 100% data (B). It is thus apparent that the proposed model can capture the focused information aligned with the current domain knowledge. (C) Pairwise difference of FNC matrices based on 5% salient data. The difference FNC matrices based on focused data indicate that each disorder has a uniquely distinguishable association with brain dynamics.
Figure 6
Figure 6
(A) Examples of the temporal density based on the top 5% values of the saliency maps from patients and controls for each disorder. It is noticeable that the temporal density for schizophrenia and Alzheimer’s patients is more focal in time as reflected in the spikiness, indicating that the discriminative activity for patients occurs predominantly in a shorter time interval. In contrast, for controls, model predictions do not relate to specific time intervals. For autism spectrum disorder, however, the whole MILC model did not capture any temporal adherence to the discriminative activity for patients. That is, the discriminatory events are not focal on shorter time intervals for ASD. (B) The EMD (Earth Mover’s Distance) distributions as a proxy measure for uniformity/spikiness of temporal densities (edited in program Inkscape 0.92.2, http://inkscape.org/release/0.92.2/). We analyzed the EMD measures of patients and controls to investigate the discriminative properties of salient data in terms of the spikiness or uniformity of the temporal densities. The larger EMD measures for schizophrenia and Alzheimer’s patients substantiate that the model found the discriminative activity in shorter focused time intervals. In contrast, for ASD, the equal EMD values for both patients and controls indicate that the temporal density measures do not relate to the discriminative activity for this disorder. We verified these observations with the statistical significance (Wilcoxon rank) test results as marked by asterisk (*) and “ns” (not significant), where ns:p>5e-2, :p1e-4.
Figure 7
Figure 7
The whole MILC architecture—an attention-based top-down recurrent network (created in programs Adobe Illustrator 26.0.3, http://ww.adobe.com/products/illustrator.html and Inkscape 1.1.2, http://inkscape.org/release/inkscape-1.1.2). Precisely, we used an LSTM network with an attention mechanism as a parameter-shared encoder to generate the latent embeddings z for the sliding window at all relevant positions. The top LSTM network (marked as LSTM) used these embeddings (z) to obtain the global representation c for the entire subject. During pretraining, we intended to maximize the mutual information between z and c. In the downstream classification task, we used the global representation c directly as input to a fully connected network for predictions. Based on these predictions, we estimated feature attributions using different interpretability methods. Finally, we evaluated the feature attributions using the RAR method and an SVM model.
Figure 8
Figure 8
End-to-end process of RAR evaluation. For each subject in the dataset, based on the whole MILC class prediction and model parameters, we estimated the feature importance vector e using some interpretability method gi. Later on, we validated these estimates against random feature attributions gR using the RAR method and an SVM model. Through the SVM model’s performance when separately trained with different feature sets, we show that whole MILC model-estimated features were highly predictive compared to a random selection of a similar amount of features. Empirically, we show that ξ(XM|gi)>ξ(XM|gR), where ξ is the performance evaluation function (e.g., area under the curve) and XM refers to the modified dataset constructed based on only retained feature values.

References

    1. Goldberg, D. P. & Huxley, P. Common Mental Disorders: A Bio-social Model. (Tavistock/Routledge, 1992).
    1. Calhoun VD, Miller R, Pearlson G, Adalı T. The chronnectome: Time-varying connectivity networks as the next frontier in fMRI data discovery. Neuron. 2014;84:262–274. doi: 10.1016/j.neuron.2014.10.015. - DOI - PMC - PubMed
    1. Sui J, Jiang R, Bustillo J, Calhoun V. Neuroimaging-based individualized prediction of cognition and behavior for mental disorders and health: Methods and promises. Biol. Psychiatry. 2020;88:818–820. doi: 10.1016/j.biopsych.2020.02.016. - DOI - PMC - PubMed
    1. Hutchison RM, et al. Dynamic functional connectivity: Promise, issues, and interpretations. Neuroimage. 2013;80:360–378. doi: 10.1016/j.neuroimage.2013.05.079. - DOI - PMC - PubMed
    1. Logothetis NK. What we can do and what we cannot do with fMRI. Nature. 2008;453:869–878. doi: 10.1038/nature06976. - DOI - PubMed

Publication types

MeSH terms