. 2022 Oct;18(10):1104-1114.
doi: 10.1038/s41589-022-01062-y. Epub 2022 Jul 21.

Systematic discovery of biomolecular condensate-specific protein phosphorylation

Affiliations

Systematic discovery of biomolecular condensate-specific protein phosphorylation

Sindhuja Sridharan et al. Nat Chem Biol. 2022 Oct.

Abstract

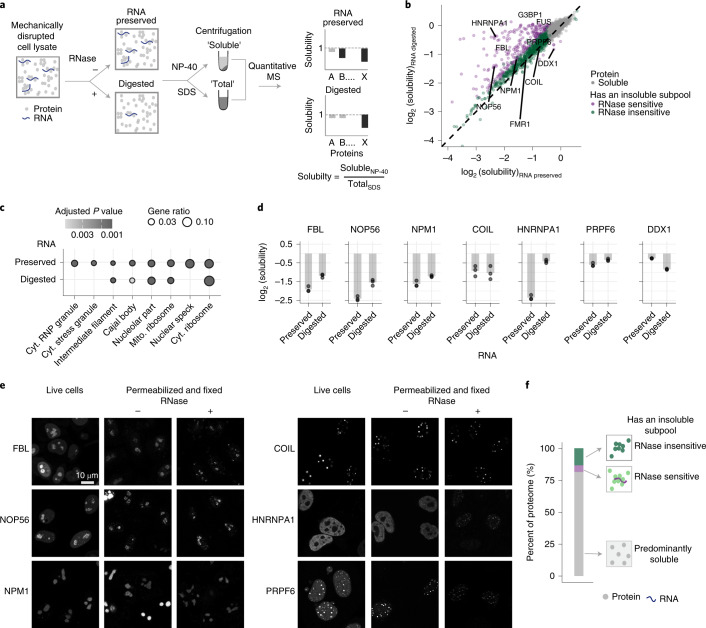
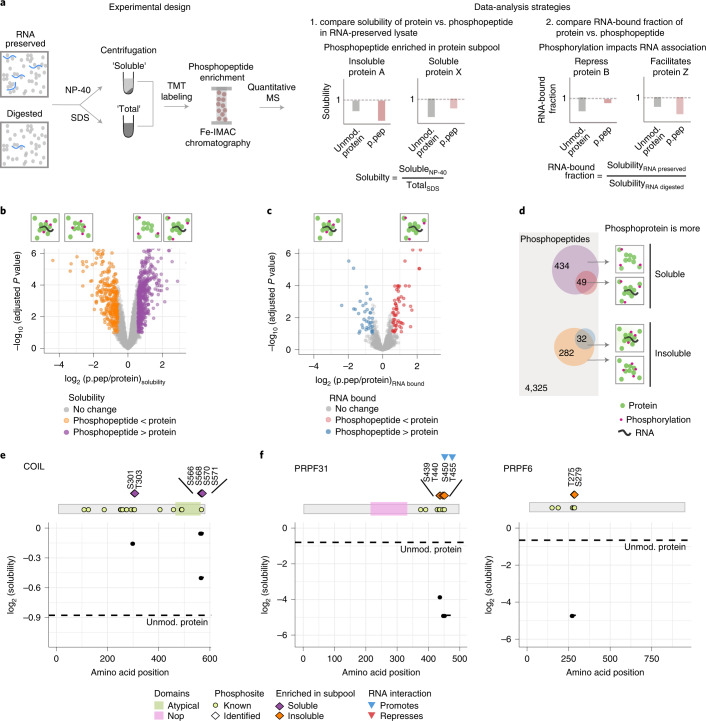
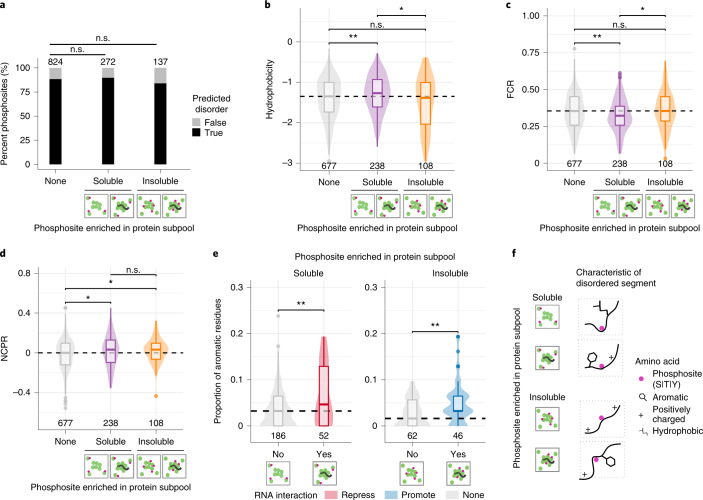
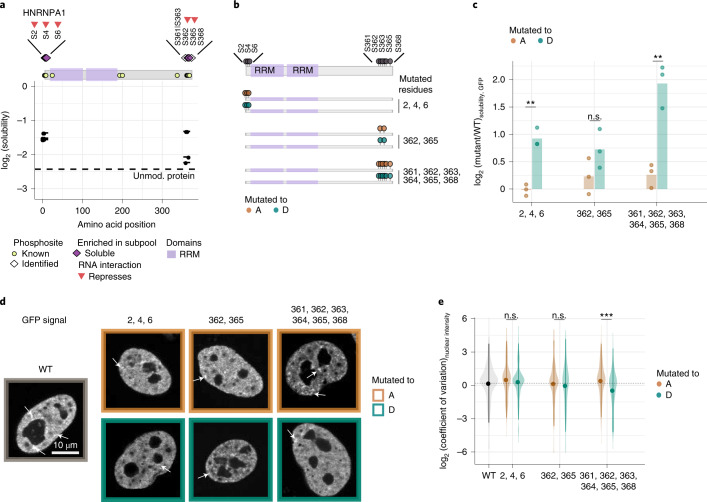
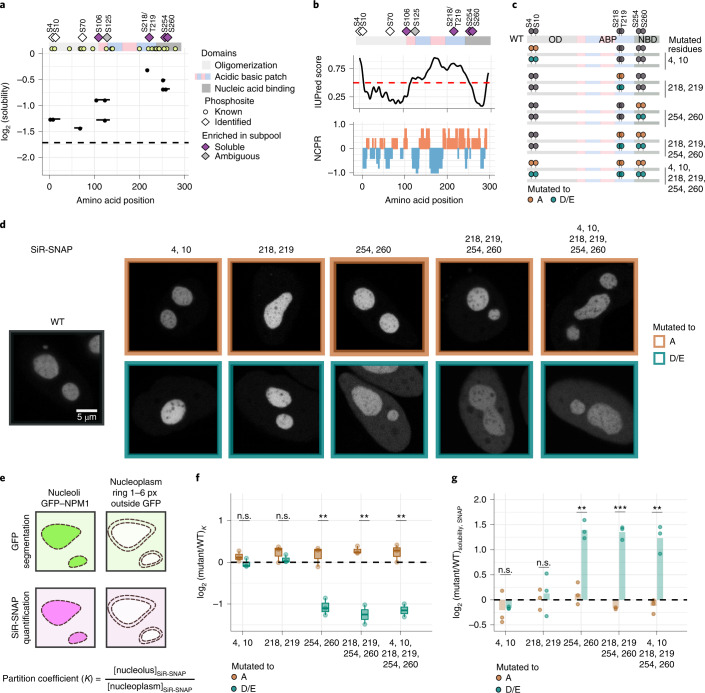
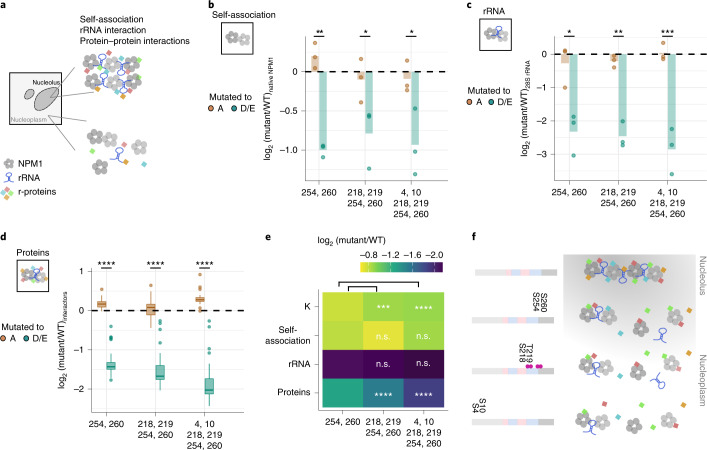
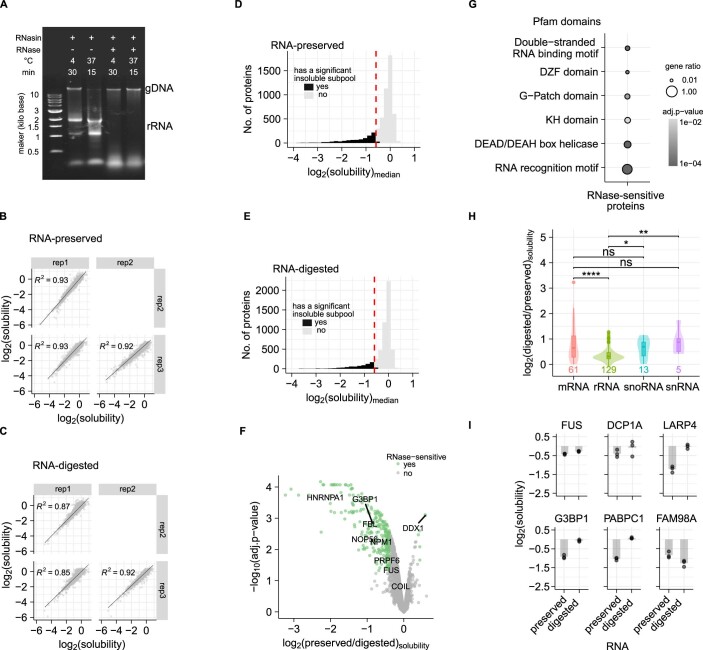
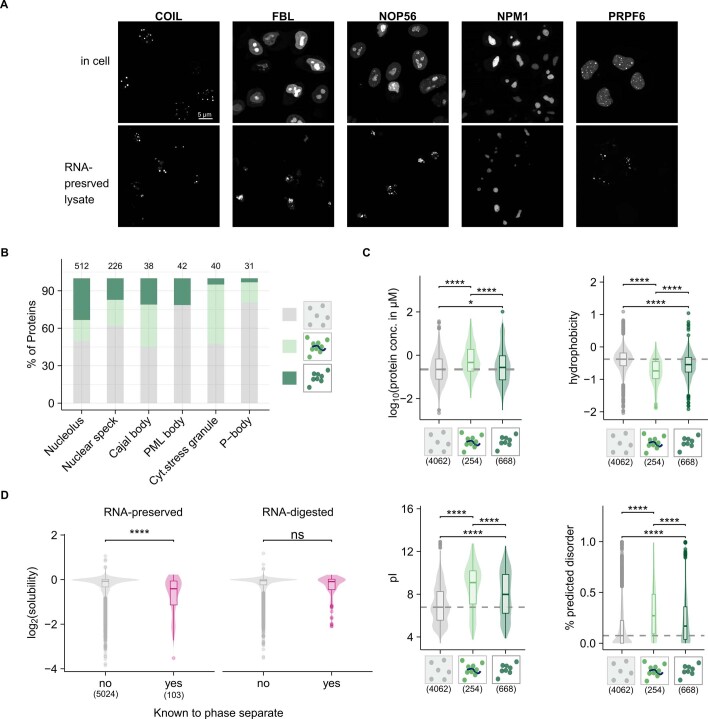
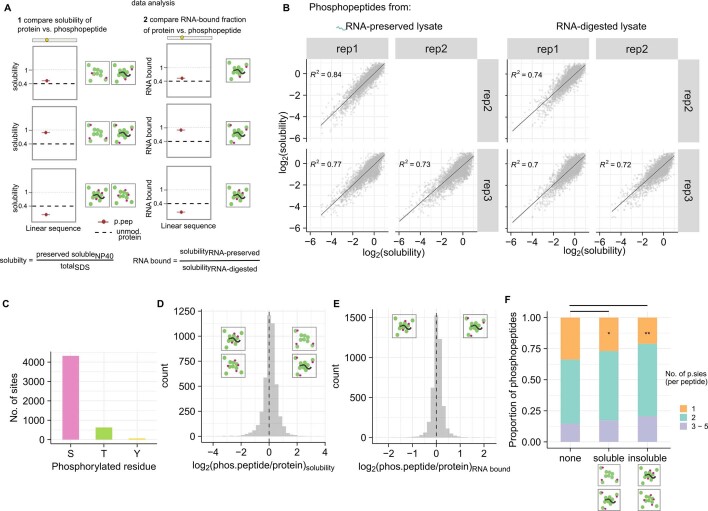
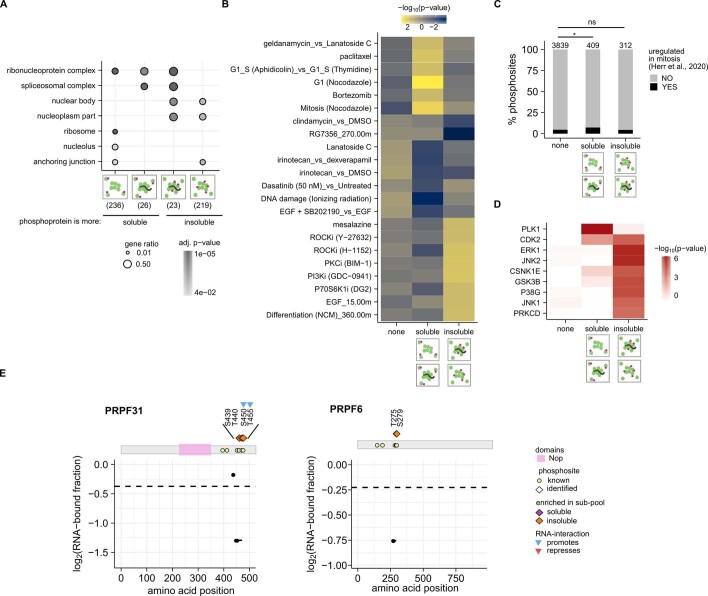
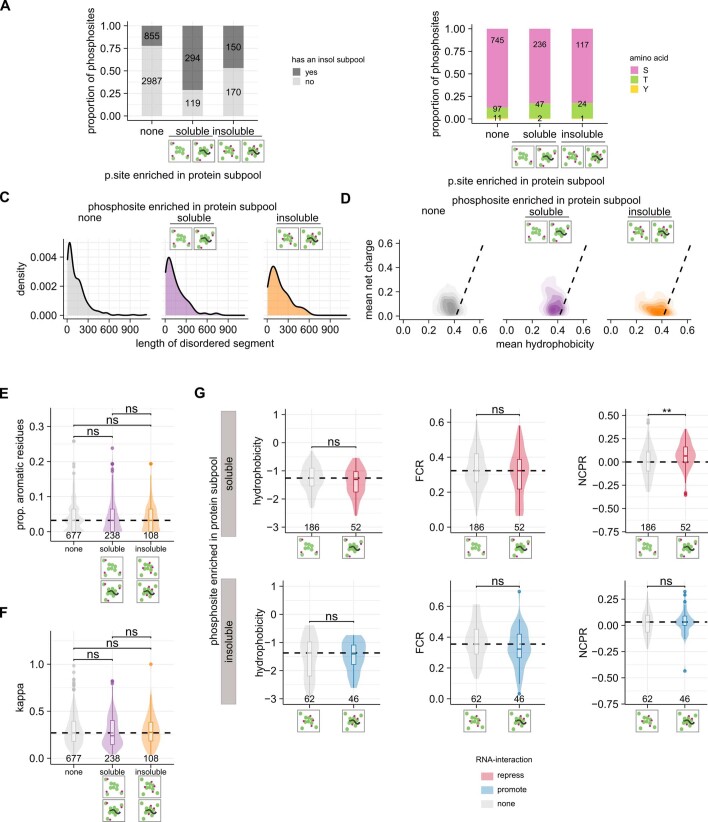
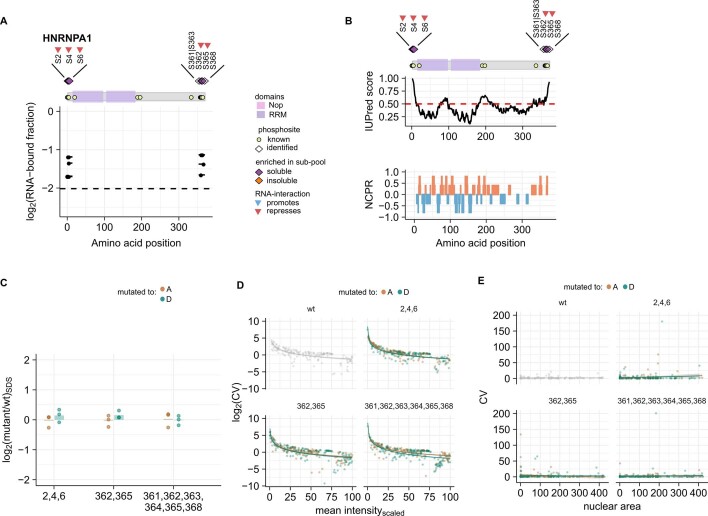
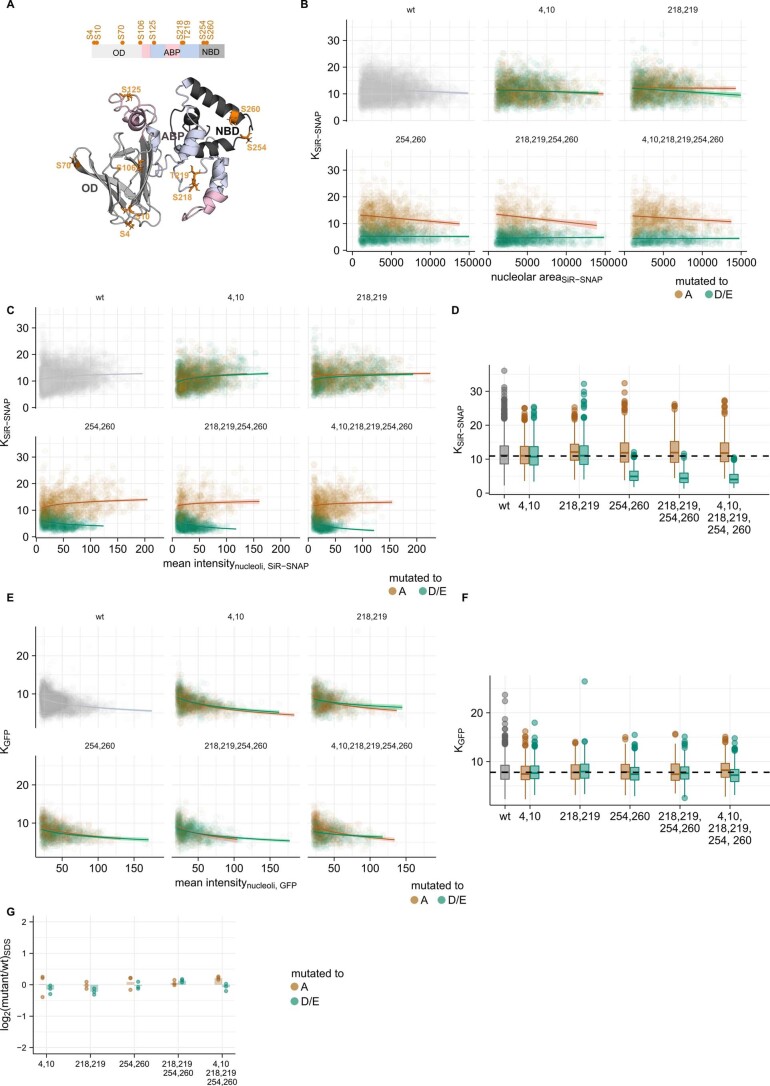
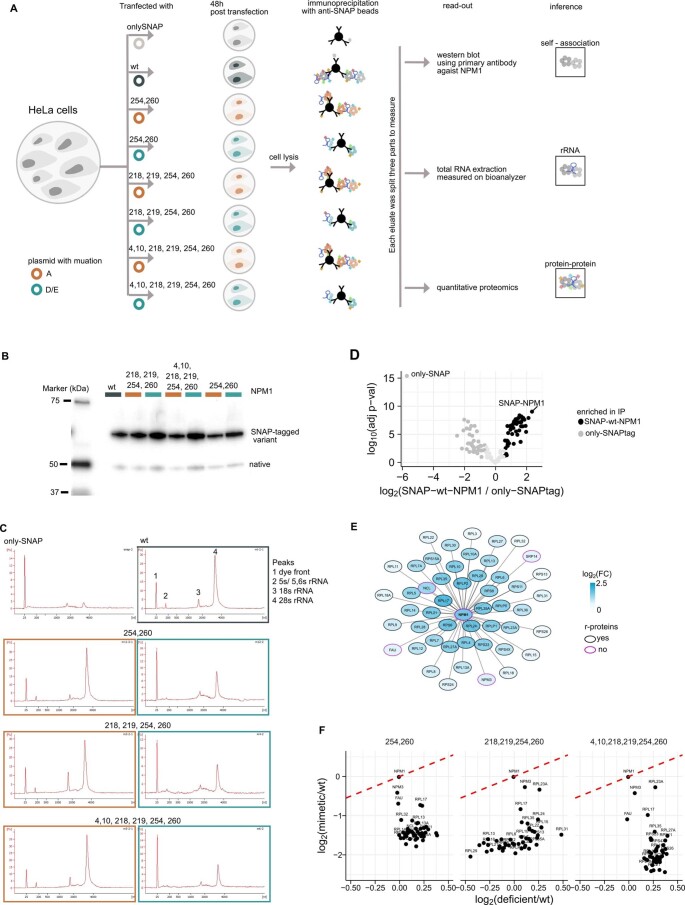
Reversible protein phosphorylation is an important mechanism for regulating (dis)assembly of biomolecular condensates. However, condensate-specific phosphosites remain largely unknown, thereby limiting our understanding of the underlying mechanisms. Here, we combine solubility proteome profiling with phosphoproteomics to quantitatively map several hundred phosphosites enriched in either soluble or condensate-bound protein subpopulations, including a subset of phosphosites modulating protein-RNA interactions. We show that multi-phosphorylation of the C-terminal disordered segment of heteronuclear ribonucleoprotein A1 (HNRNPA1), a key RNA-splicing factor, reduces its ability to locate to nuclear clusters. For nucleophosmin 1 (NPM1), an essential nucleolar protein, we show that phosphorylation of S254 and S260 is crucial for lowering its partitioning to the nucleolus and additional phosphorylation of distal sites enhances its retention in the nucleoplasm. These phosphorylation events decrease RNA and protein interactions of NPM1 to regulate its condensation. Our dataset is a rich resource for systematically uncovering the phosphoregulation of biomolecular condensates.


Conflict of interest statement

M.B. is an employer and shareholder of Cellzome, GlaxoSmithKline. The remaining authors declare no competing interests.

Figures

Fig. 1
Fig. 1. Solubility status of the human proteome.
a, Experimental setup of solubility proteome profiling using RNA-preserved and RNA-digested crude cellular lysate systems. b, Scatterplot comparing the solubility (NP-40/SDS ratio) of proteins in RNA-preserved (x axis) and RNA-digested (y axis) samples in log2 scale. Proteins that maintain a significant insoluble subpopulation (see Methods for statistical significance) in both lysate types are depicted in green and proteins that alter solubility due to cellular RNA digestion are shown in purple. FMR1, fragile X messenger ribonucleoprotein 1; G3BP1, G3BP stress granule assembly factor 1. c, Dot plot showing a subset of over-represented gene ontology cellular compartment terms (q value < 0.05, hypergeometric test, corrected using the Benjamini–Hochberg procedure) among proteins that exhibit low solubility in RNA-preserved and RNA-digested lysates. Cyt., cytosolic; mito., mitochondrial. d, Bar plot representation of solubility (y axis in log2 scale) of FBL, NOP56, NPM1, COIL, HNRNPA1 and PRPF6 in RNA-preserved and RNA-digested (x axis) samples. Dots represent the solubility measurement from three independent biological replicates. Low FCs represent low solubility. e, Confocal microscopy images of HeLa cells overexpressing fusion proteins GFP–FBL, GFP–NOP56, SiR-SNAP–NPM1, GFP–COIL, GFP–HNRNPA1 and GFP–PRPF6 in live cells and in permeabilized (without and with RNase treatment) and fixed cells. f, Bar plot representing different solubility classes of proteins. Proteins are classified as ‘predominantly soluble’ (no significant insoluble subpool was measured) and ‘has an insoluble subpool’, which is either ‘RNase sensitive’ or ‘RNase insensitive’. Source data
Fig. 2
Fig. 2. Mapping phosphorylation sites of distinct protein pools.
a, Schematic representation of the experimental design and data-analysis strategies. Fe-IMAC, Fe3+-immobilized metal ion affinity chromatography; p.pep, phosphopeptide; TMT, tandem mass tag; unmod., unmodified. b, Volcano plot of the differential solubility of phosphopeptides of a protein compared to its unmodified protein in RNA-preserved lysate. Phosphopeptides exhibiting significantly (|log2 (FC)| > 0.5 and adjusted P value obtained from limma analysis (Benjamini–Hochberg) < 0.01) lower (orange) and higher (purple) solubility than the unmodified proteins are shown. c, Volcano plot of the differential RNA-bound fraction of phosphopeptides of a protein compared to its unmodified protein. Phosphopeptides exhibiting significantly (|log2(FC)| > 0.5 and adjusted P value obtained from limma analysis (Benjamini–Hochberg) < 0.01) lower (red) and higher (blue) proportions in the RNA-bound subpool than the unmodified proteins are shown. d, Venn diagram summarizing the overlap in different categories of assigned phosphopeptides. e,f, Visualization of the median solubility profiles (n = 3) of identified phosphopeptides (solid lines, phosphosites as points) and unmodified protein (dashed line) in log2 scale is represented along the linear sequence of the protein (x axis) of COIL (e), PRPF6 and PRPF31 (f). Top, schematic representation of the protein with its domains and known phosphosites from UniProt. Source data
Fig. 3
Fig. 3. Sequence properties of disordered segments surrounding solubility subpopulation-specific phosphosites are distinct.
a, Bar plot showing the proportion of phosphosites localized within the predicted disorder segments of proteins. Significance values were obtained using Fisher’s exact test; n.s., P > 0.05. bd, Comparison of different sequence properties of 31-amino acid segment non-changing, soluble and insoluble subpool-enriched phosphosites (which were disordered based on Uversky classification). b, Hydrophobicity was calculated using the Kyte–Doolittle scale. c, The fraction of charged residues (FCR) was calculated as the sum of the fraction of positively charged (f+) and negatively charged (f) residues. d, Net charge per residue (NCPR) was calculated as the difference between f+ and f. The number of phosphosites in each category is indicated at the bottom of the representation. Significance was calculated using two-sided Wilcoxon signed-rank tests and is represented by *P < 0.05, **P < 0.01 and ***P < 0.001. The box plots display the median and the interquartile range (IQR), with the upper whiskers extending to the largest value ≤1.5 × IQR from the 75th percentile and the lower whiskers extending to the smallest values ≤1.5 × IQR from the 25th percentile. e, Comparison of the proportion of aromatic amino acids in the 31-amino acid segments of phosphosites, which are enriched in either the soluble (right) or insoluble (left) protein subpool and may or may not impact RNA interactions. Significance was calculated using a two-sided Wilcoxon signed-rank test and is represented by *P < 0.05, **P < 0.01 and ***P < 0.001. The box plots display the median and the IQR, with the upper whiskers extending to the largest value ≤1.5 × IQR from the 75th percentile and the lower whiskers extending to the smallest values ≤1.5 × IQR from the 25th percentile. The number of phosphosites in each category is indicated at the bottom of the representation. f, Schematic representation of key sequence properties observed in phosphosites that are enriched in soluble and insoluble subpools of proteins. Source data
Fig. 4
Fig. 4. Multisite phosphorylation of the HNRNPA1 C terminus impacts its solubility.
a, Visualization of the solubility profiles of identified phosphopeptides of HNRNPA1 and unmodified HNRNPA1 protein. Top, schematic representation of the protein with its domains and known phosphosites from UniProt is shown. Median solubility (of three independent measurements, y axis) of phosphopeptides (solid lines with points representing the sites) and unmodified protein (dashed line) in log2 scale is represented along the linear sequence of the protein (x axis). b, Schematic representation of different phosphodeficient (S to A) and phosphomimetic (S to D) mutants of HNRNPA1. These variants were expressed as GFP-tagged fusion proteins. RRM, RNA-recognition motif. c, Bar plot of the solubility (y axis) of GFP-tagged phosphodeficient and phosphomimetic mutants (sites are indicated on the x axis) of HNRNPA1 normalized to that of GFP-tagged WT protein is shown. Points represent the size effect calculated from three independent biological replicates. The variants of HNRNPA1 were expressed as GFP fusion proteins. Hence, the solubility of the tag (GFP) is used as the proxy to infer the solubility of HNRNPA1 variants. Mean from three independent trials are shown and the statistical significance was obtained by comparing the phosphodeficient and phosphomimetic mutant pairs using Student’s t-test (two sided) and is represented by *P < 0.05, **P < 0.01 and ***P < 0.001. d, Representative examples of a HeLa cell line transiently expressing the GFP-tagged HNRNPA1 mutant proteins depicted in b. GFP signal of WT in gray (left), phosphodeficient mutant proteins in brown (top) and phosphomimetic mutant proteins in green (bottom). Single z slices are shown. Scale bar, 10 µm. Examples of nuclear clusters are indicated with arrows. e, Coefficient of variation (s.d. ÷ mean intensity) of the nuclear signal of GFP-tagged WT and variants of HNRNPA1. Violin plot displays the underlying distribution of the coefficient of variation calculated from at least 120 nuclei from two independent experiments. The mean and s.d. are represented as a point and solid lines. Statistical significance was obtained using Student’s t-test (two sided) and is represented by *P < 0.05, **P < 0.01 and ***P < 0.001. Source data
Fig. 5
Fig. 5. Phosphorylation of S254 and S260 are crucial for NPM1 localization.
a, Visualization of the solubility profiles of identified phosphopeptides of NPM1 (solid lines, phosphosites as points) and unmodified NPM1 protein (dashed line). Top, schematic representation of the different protein domains and previously known phosphosites are shown. b, IUPred, prediction of intrinsic disorder (top) and net charge per residue (calculated over a five-amino acid window, bottom) along the linear sequence of NPM1. c, Schematic representation of different phosphodeficient (S|T to A) and phoshomimetic (S to D|T to E) mutants of NPM1. ABP, acidic basic patch; NBP, nucleic acid binding; OD, oligomerization domain. d, Representative examples of a HeLa cell line overexpressing WT GFP-tagged NPM1 from a bacterial artificial chromosome (BAC) and transiently expressing the SNAP-tagged NPM1 mutant proteins depicted in c. SiR-SNAP signal of WT is in dark gray (left), phosphodeficient mutants are in brown (top), and phosphomimetic mutants are in green (bottom). Single z slices are shown. Scale bar, 5 µm. e, Schematic of nucleolus and nucleoplasmic segmentation. WT GFP–NPM1 was used for nucleolus segmentation, and a rim surrounding each nucleolus was used for the nucleoplasmic segmentation. SiR-SNAP signals were quantified. The partition coefficient (K) is the proportion of nucleolar intensity to nucleoplasmic intensity. px, pixels. f, Box plot of relative K values (y axis) of SNAP-tagged NPM1 mutants (x axis) with respect to SNAP-tagged NPM1 WT from at least three independent trials is shown in log2 scale. Dashed lines represent the effect size of SNAP-tagged NPM1 WT (n ≥ 3). Statistical significance was obtained by comparing the phosphodeficient and phosphomimetic mutant pairs using Student’s t-test (two-sided) and is represented by *P < 0.05, **P < 0.01 and ***P < 0.001. The box plots display the median and the IQR, with the upper whiskers extending to the largest value ≤1.5 × IQR from the 75th percentile and the lower whiskers extending to the smallest values ≤1.5 × IQR from the 25th percentile. g, Bar plot of mean protein solubility (y axis, from three independent trials) of SNAP-tagged NPM1 mutants (x axis) with respect to SNAP-tagged NPM1 WT measured using the proteomic assay. Points represent the solubility measured from n = 3 experiments. Statistical significance was obtained by comparing the phosphodeficient and phosphomimetic mutant pairs using Student’s t-test (two-sided) and is represented by *P < 0.05, **P < 0.01 and ***P < 0.001. Source data
Fig. 6
Fig. 6. Phosphorylation impairs both homotypic and heterotypic interactions of NPM1.
a, Schematic representation of the molecular interactions of NPM1 within the nucleolus and the nucleoplasm. b, Comparison of the self-association property (in log2 scale, y axis) of the indicated SNAP-tagged phosphomutants of NPM1 (x axis) normalized to that of SNAP-tagged NPM1 WT. This was measured by assessing the amount of HeLa cell (native) NPM1 associated with heterologously overexpressed SNAP-tagged NPM1 variants following immunoprecipitation (IP) with SNAP-tag as bait. Points represent data from three independent trials and the bar represents the mean value. Significance for each phosphomutant pair was calculated using Student’s t-test (two sided) and is represented by *P < 0.05, **P < 0.01 and ***P < 0.001. c, Comparison of the amount of 28S rRNA (in log2 scale, y axis) associated with the indicated SNAP-tagged phosphomutants of NPM1 (x axis) normalized to that of SNAP-tagged NPM1 WT following IP with SNAP-tag as bait. Points represent data from three independent trial and the bar represents the mean values. Significance for each phosphomutant pair was calculated using Student’s t-test (two sided) and is represented by *P < 0.05, **P < 0.01 and ***P < 0.001. d, Comparison of the relative amounts of NPM1-interacting proteins (in log2 scale, y axis; 44 proteins were classified as NPM1 interactors, including both ribosomal and non-ribosomal proteins) associated with the indicated SNAP-tagged phosphomutants of NPM1 (x axis) in comparison to those associated with SNAP-tagged NPM1 WT following IP with SNAP-tag as bait. Significance for each phosphomutant pair was calculated using Student’s t-test and is represented by *P < 0.05, **P < 0.01, ***P < 0.001 and ****P < 0.0001. The box plots display the median and the IQR, with the upper whiskers extending to the largest value ≤1.5 × IQR from the 75th percentile and the lower whiskers extending to the smallest values ≤1.5 × IQR from the 25th percentile. e, Heatmap showing normalized relative effect sizes of partition coefficient values (K) and amount of native NPM1 (reflects NPM1 self-association), rRNA and protein interactors of NPM1 associated with the indicated phosphomimetic mutants (x axis). Significance levels were obtained with Student’s t-test (two sided) and are represented by *P < 0.05, **P < 0.01, ***P < 0.001 and ****P < 0.0001. f, Schematic representation of the working model of the impact of phosphorylation on NPM1’s propensity to form a biomolecular condensate. Pink dots represent phosphosites, gray circles indicate NPM1, diamond shapes represent r-proteins, and the stem-loop schematic represents rRNA. Source data
Extended Data Fig. 1
Extended Data Fig. 1. Experimental setup and classification of proteins based on solubility.
(a) 1% agarose gel separation of total nucleic acids extracted under selectively preserving and digesting cellular RNA under different conditions. gDNA: genomic DNA, rRNA: ribosomal RNA. (b, c) Scatter plot comparing the reproducibility of protein solubility measurements (in log2 scale) from three independent replicates from (B) RNA-preserved and (C) RNA-digested lysate. (d, e) Histogram of proteome-wide solubility of proteins in (D) RNA-preserved and (E) RNA digested lysate. Proteins that exhibit at least 30% lower abundance in NP40 compared to SDS-extracted lysate at FDR < 1% (Benjamini-Hochberg procedure) was considered to maintain an insoluble subpool in the lysate. (f) Differential solubility of proteins in RNA-preserved and RNA-digested lysate. The y-axis represents -log10(adjusted p-value) (limma, corrected with Benjamini-Hochberg procedure) and the x-axis displays the log2(fold change). Green dots represent proteins that exhibit | log2(fold change) | > 0.5, at FDR < 1%. (g) Dot plot showing the over-represented Pfam protein domain among proteins that exhibit significant difference in solubility in RNA-digested compared to RNA-preserved lysate (q-val < 0.05, hypergeometric test, corrected using Benjamini-Hochberg procedure). (h) Boxplot with violin plot showing the distribution of difference in solution of proteins after RNA digestion (compared to preserving RNA in lysate) among proteins annotated to be binding to mRNA, rRNA, snoRNA and snRNA). Significance calculated using Wilcoxon signed-rank test (two-sided) and represented as ns: not significant, *p < 0.05, **p < 0.01, and ***p < 0.001. The box plots display the median and IQR, with the upper whiskers extending to the largest value ≤1.5 × IQR from 75th percentile and the lower whiskers extending to smallest values ≤1.5 × IQR from 25th percentile (i) Bar plot representation of solubility (y-axis in log2 scale) of FUS, G3BP1, PABPC1, DCP1A, LARP4 and FAM98A in RNA-preserved and RNA-digested (x-axis). Dots represent the solubility measurement from three independent biological replicates. Low fold-changes represent low solubility. Source data
Extended Data Fig. 2
Extended Data Fig. 2. Physiochemical properties of proteins in different solubility subgroups.
(a) Representative confocal images of intact HeLa cells expressing GFP-tagged COIL, FBL, NOP56, NPM1 and PRPF6 and post-lysis using conditions used for proteomics assay. (b) Bar plot representing the proportion of proteins of different solubility classes present among proteins that are annotated to be part of various membrane-less organelles. Gene ontology annotation only based on experimental evidence was used for binning the proteins in different cellular compartments. Number of proteins from each organelle is shown on the top. (c) Distribution of intracellular protein concentration (top left, in log10 scale), hydrophobicity (top right, Kyte Doolittle scale), isoelectric point (pI, bottom left) and %predicted disorder in the sequence (bottom right) of proteins that were classified as ‘predominantly soluble’, and has an insoluble sub-pool that is ‘RNase-sensitive’ or ‘RNase-insensitive’. The box plots display the median and IQR, with the upper whiskers extending to the largest value ≤1.5 × IQR from 75th percentile and the lower whiskers extending to smallest values ≤1.5 × IQR from 25th percentile. Numbers represent the number of proteins in each category. Significance calculated using Wilcoxon signed-rank test (two-sided) and represented as ns: not significant, *p < 0.05, **p < 0.01, and ***p < 0.001. (d) Distribution of solubility (in log2 scale) of proteins that are known to undergo phase separation based on in-vitro experiments (curated list from PhaseDB) in RNA-preserved (left) and RNA-digested (right) lysate. Numbers represent the number of proteins in each category. Significance calculated using Wilcoxon signed-rank test (two-sided) and represented as ns: not significant, *p < 0.05, **p < 0.01, and ***p < 0.001. Source data
Extended Data Fig. 3
Extended Data Fig. 3. Differentially soluble phosphopeptides.
(a) Schematic representation of data analysis and interpretation strategies of combining phosphoproteomics with solubility proteome profiling. (b) Scatter plot comparing the reproducibility of phosphopeptides solubility measurements (in log2 scale) from three independent replicates from RNA-preserved and RNA-digested lysate. (c) Bar plot representation of number of phosphorylated serine (S), threonine (T) and tyrosine (Y) residues identified in this dataset. (d) Histogram showing the difference in solubility of phosphopeptides and their corresponding unmodified proteins (x-axis in log2 scale) in RNA-preserved lysate. (e) Histogram showing the difference in RNA-bound fraction of phosphopeptides and their corresponding unmodified proteins (x-axis in log2 scale). (f) Barplot representing the proportion of single, double and multiple phosphorylation sites containing peptides among differenentially soluble phosphopeptides. Fisher’s exact test was utilized to ascertain the significance. ** p-value < 0.01, * p-value < 0.05. Source data
Extended Data Fig. 4
Extended Data Fig. 4. Regulation and localization of differential phosphosites.
(a) Dot plot of gene ontology cellular compartments over-represented among proteins which have differentially soluble phosphopeptides (q-val < 0.05, hypergeometric test, corrected using Benjamini-Hochberg procedure). (b) Heat map representation of the degree of regulation of phosphosites sub-divided into protein solubility subgroups across different conditions. The up or down regulation of phosphosites was inferred from a large scale collection of previously published phosphoproteomics datasets on various conditions including drug/inhibitor treatment and different cellular states. Cellular conditions in which the phosphosites assigned in this study showed significant change (Z-test, |-log10(p-value)| > 2) in regulation in at least one solubility subgroup are shown. High positive and negative values indicate increased or decreased regulation of phosphosites in the indicated condition. (c) Bar plot representation of the proportion of mitotically upregulated phosphorylation (from Herr et a., 2020) sites among the differentially soluble phosphosites identified from this dataset. Significance estimated using Fisher’s exact test and coded as * p-value < 0.05, ns- not significant. (d) Heat map representation of kinase over-representation analysis based on enrichment of their direct substrates in different protein solubility sub-groups. Kinases enriched in at least one protein solubility sub-group are shown (q-value < 0.15, hypergeometric test corrected with Benjamini-Hochberg procedure). (e) Visualization of the median RNA-bound fraction (n = 3) of identified phosphopeptides and unmodified protein of PRPF6 and PRPF31. Top: schematic representation of the protein with its domains and known phosphosites from Uniprot is shown. Median RNA-bound fraction (of three independent measurements, y-axis) of phosphopeptides (solid lines with points representing the site) and unmodified protein (dotted line) in log2 scale is represented along the linear sequence of the protein (x-axis). Source data
Extended Data Fig. 5
Extended Data Fig. 5. Sequence features of differentially soluble phosphopeptides.
(a) Bar plot representing the proportion of classified phosphosites that correspond to proteins which have a significant insoluble sub-pool. Only phosphosites identified from proteins that maintains a significant insoluble sub-pool are used for subsequent analysis. (b) Number of phosphorylated serine (S), threonine (T) and tyrosine (Y) among classified phosphosites of protein which have a significant insoluble sub-pool. (c) Density plot representing the distribution of predicted disorder segment lengths in proteins with a significant insoluble sub-pool and an identified phosphosite. (d) 2D-density plot of charge vs. hydrophobicity of 31-amino acid segment surrounding the phosphosite (as center residue). Dotted line is the boundary (mean net charge = 2.785 X mean hydrophobicity – 1.151) that is shown to distinguish disordered (left of the line) from folded (right of the line) segments based on Uversky classification. (E) Distribution of proportion of aromatic residues (F|W|Y) and (f) Kappa value of the 31-amino acid segments (which were disordered based on Uversky classification) of different solubility subgroups. The number of phosphosites in each category is indicated at the bottom of the representation. Significance calculated using two-sided Wilcoxon signed-rank test and represented as *p < 0.05, **p < 0.01, and ***p < 0.001. The box plots display the median and IQR, with the upper whiskers extending to the largest value ≤1.5 × IQR from 75th percentile and the lower whiskers extending to smallest values ≤1.5 × IQR from 25th percentile. (g) Distribution of hydrophobicity, net charge per residue (NCPR) and fraction of charged residue (FCR) between phosphosites that may impact protein solubility or affect solubility through alteration of RNA-binding properties of proteins. The number of phosphosites in each category is indicated at the bottom of the representation. Significance calculated using two-sided Wilcoxon signed-rank test and represented as *p < 0.05, **p < 0.01, and ***p < 0.001. The box plots display the median and IQR, with the upper whiskers extending to the largest value ≤1.5 × IQR from 75th percentile and the lower whiskers extending to smallest values ≤1.5 × IQR from 25th percentile. Source data
Extended Data Fig. 6
Extended Data Fig. 6. Phosphoregulation of HNRNPA1.
(a) Visualization of the RNA-bound fraction of identified phosphopeptides and unmodified protein of HNRNPA1. Top: schematic representation of the protein with its domains and known phosphosites from Uniprot is shown. Median RNA-bound fraction (of three independent measurements, y-axis) of phosphopeptides (solid lines with points representing the site) and unmodified protein (dotted line) in log2 scale is represented along the linear sequence of the protein (x-axis). (b) IUpred, prediction of intrinsic disorder (top) and net charge per residue (NCPR, calculated over 5 aa window) along the linear sequence of HNRNPA1. (c) Barplot representing the relative protein abundance (in log2 scale, y-axis) of heterologously expressed GFP-tagged phosphomutants (x-axis) of HNRNPA1 (proxy for intracellular protein expression) compared to the wild type (wt) from three independent biological replicates. (d) Comparison of coefficient of variation (CV, in log2 scale) of intensity with the mean intensity of (segmented-) nucleus (n > 100) from two independent trials. (f) Comparison of coefficient of variation (CV) of intensity with the area of the (segmented-) nucleus (n > 100) from two independent trials. Source data
Extended Data Fig. 7
Extended Data Fig. 7. Localization of NPM1 and its phosphomutants.
(a) Model of NPM1 with the identified phosphosites highlighted in orange. Protein domains: OD- oligomerization domain, ABP- acidic basic patch and NBD- nucleic acid binding domain. (b) Scatter plot of calculated partition coefficient (K) from SiR-SNAP channel (y-axis) and size of individual (segmented-) nucleoli (x-axis) from at least three independent trials per construct. (c) Scatter plot of calculated partition coefficient from SiR-SNAP channel (KSiR-SNAP, y-axis) and mean intensity of SiR-SNAP in nucleoli (proxy for the expression level of SNAP-tagged protein, x-axis) for individual (segmented-) nucleoli from at least three independent trials per construct. (d) Box plot showing the distribution of KSiR-SNAP (partition coefficient calculated from SiR-SNAP channels for NPM1 wildtype (wt) and phosphomutants. The box plots display the median and IQR, with the upper whiskers extending to the largest value ≤1.5 × IQR from 75th percentile and the lower whiskers extending to smallest values ≤1.5 × IQR from 25th percentile. (e) Scatter plot of calculated partition coefficient from GFP channel (KGFP, y-axis) and mean intensity of GFP in nucleoli (proxy for the expression level of GFP-tagged wt-NPM1, x-axis) for individual (segmented-) nucleoli from at least three independent trials per construct. (f) Box plot showing the distribution of KGFP (partition coefficient calculated from GFP channels for NPM1 wildtype (wt) expressed as marker of nucleoli in all experiments. The box plots display the median and IQR, with the upper whiskers extending to the largest value ≤1.5 × IQR from 75th percentile and the lower whiskers extending to smallest values ≤1.5 × IQR from 25th percentile. (g) Barplot representing the relative protein abundance (in log2 scale, y-axis) of heterologously expressed SNAP-tagged phosphomutants (x-axis) of NPM1 compared to the wild type (wt) from three biological replicates. Source data
Extended Data Fig. 8
Extended Data Fig. 8. Phosphoregulation of NPM1 interactions.
(a) Schematic representation of the experimental set-up to capture the interaction of NPM1. (b) Western blot image of the eluate of the IP of different variants of NPM1 using primary antibody against NPM1. Two bands corresponding to heterologous expression (SNAP-tagged, high molecular weight) and native protein (low molecular weight) are observed. Higher amounts of SNAP-tagged phosphomimetic mutants are observed due to higher accessibility (due to higher solubility) to antibody based pull-down. (c) RNA elution profiles from Bioanalyzer showing the fluorescence intensity (in arbitrary units, y-axis) along the elution time (in seconds, x-axis) of NPM1 and its phosphomutants. (d) Differential analysis of proteins associated with SNAP-tagged wild type NPM1 compared to only-SNAP tag. Proteins represented in black (solid circle) are (at least 2-fold higher with an FDR < 0.1, limma analysis, p-value corrected with Benjamini-Hochberg procedure) defined as the specific protein-interactors of NPM1. (e) Protein-protein interactions of NPM1 represented in a network visualization. Each node represents ribosomal proteins (black outline) and non-ribosomal proteins (pink outline) specifically interacting with NPM1. (f) Scatter plot comparing the median fold changes (from n = 3 trials) of the amount of the specific protein interactors of NPM1 associated with phosphodeficient and mimetic versions of NPM1. Source data

References

    1. Banani SF, et al. Compositional control of phase-separated cellular bodies. Cell. 2016;166:651–663. doi: 10.1016/j.cell.2016.06.010. - DOI - PMC - PubMed
    1. Shin Y, Brangwynne CP. Liquid phase condensation in cell physiology and disease. Science. 2017;357:eaaf4382. doi: 10.1126/science.aaf4382. - DOI - PubMed
    1. Banani SF, Lee HO, Hyman AA, Rosen MK. Biomolecular condensates: organizers of cellular biochemistry. Nat. Rev. Mol. Cell Biol. 2017;18:285–298. doi: 10.1038/nrm.2017.7. - DOI - PMC - PubMed
    1. Brangwynne CP, et al. Germline P granules are liquid droplets that localize by controlled dissolution/condensation. Science. 2009;324:1729–1732. doi: 10.1126/science.1172046. - DOI - PubMed
    1. Kato M, et al. Cell-free formation of RNA granules: low complexity sequence domains form dynamic fibers within hydrogels. Cell. 2012;149:753–767. doi: 10.1016/j.cell.2012.04.017. - DOI - PMC - PubMed

Publication types