. 2022 Jul 21;79(8):437.
doi: 10.1007/s00018-022-04463-3.

Polymerogenic neuroserpin causes mitochondrial alterations and activates NFκB but not the UPR in a neuronal model of neurodegeneration FENIB

Affiliations

Polymerogenic neuroserpin causes mitochondrial alterations and activates NFκB but not the UPR in a neuronal model of neurodegeneration FENIB

E D'Acunto et al. Cell Mol Life Sci. .

Abstract

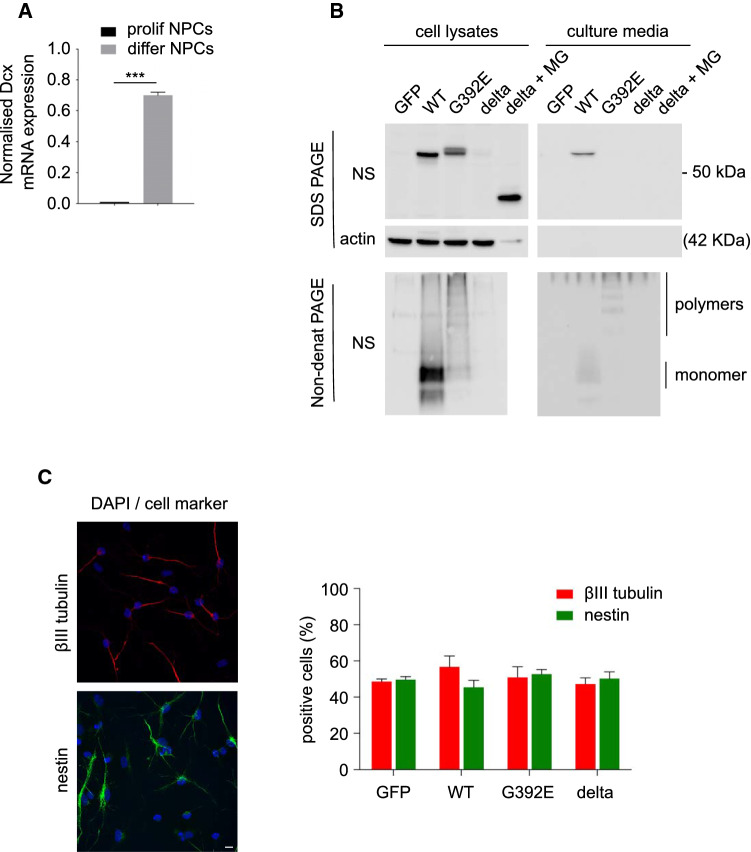
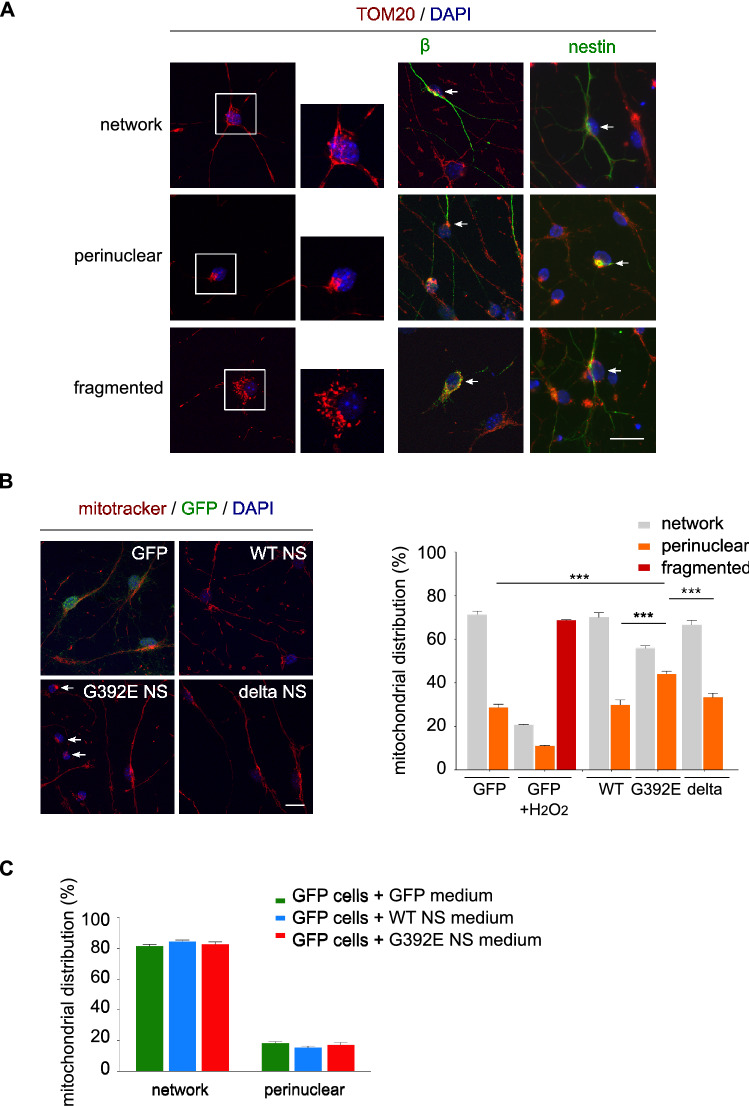
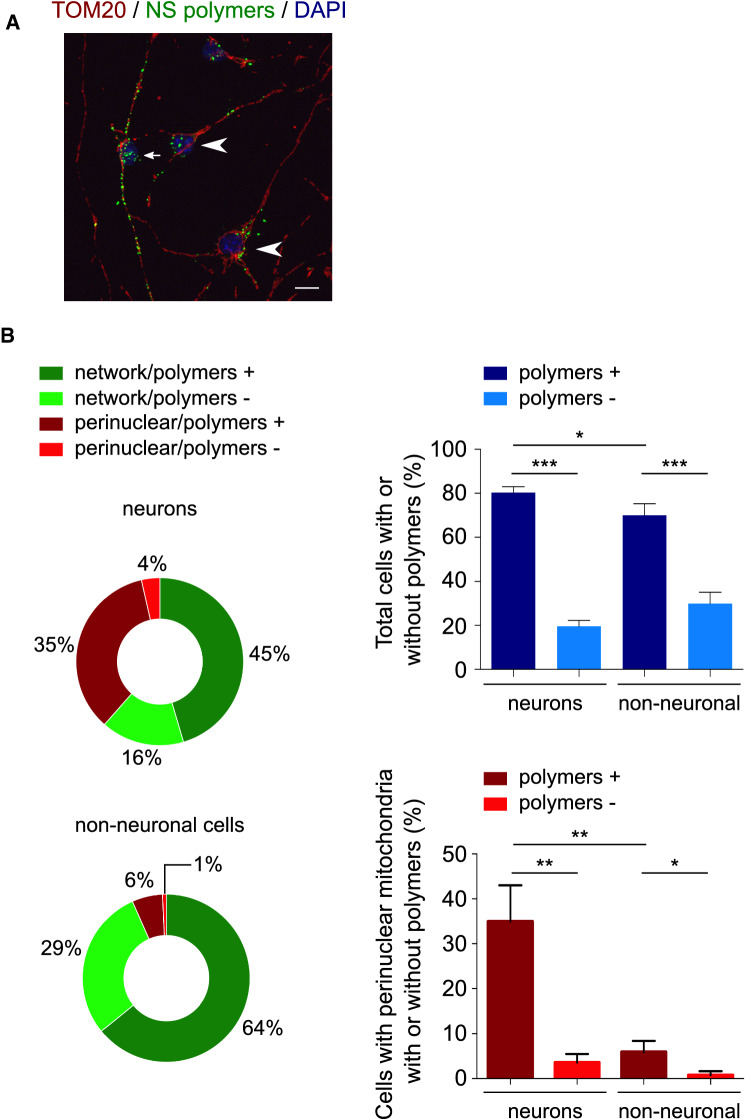
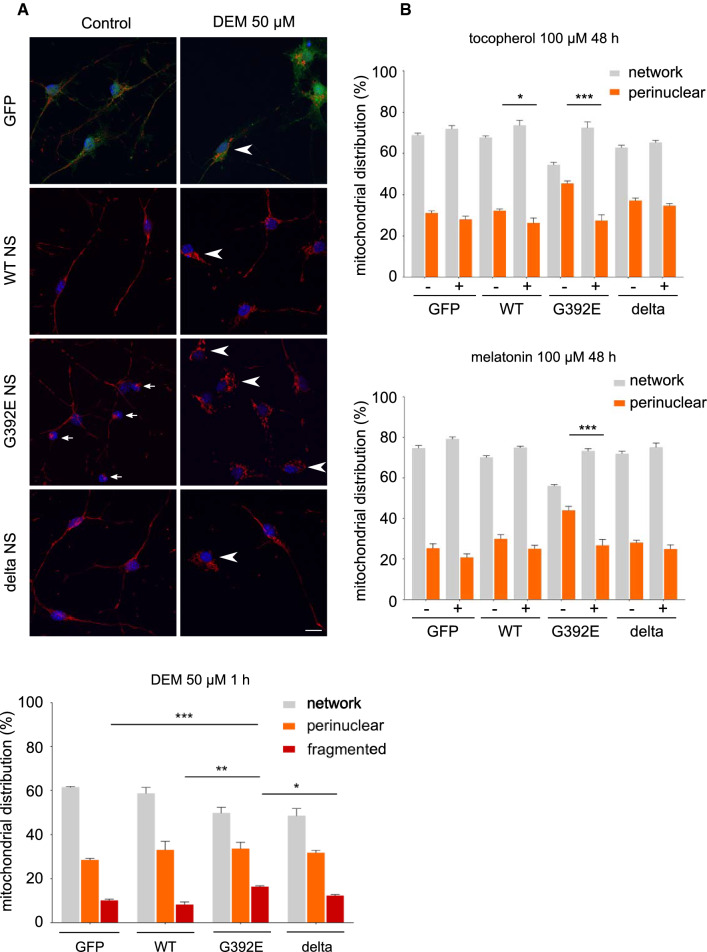
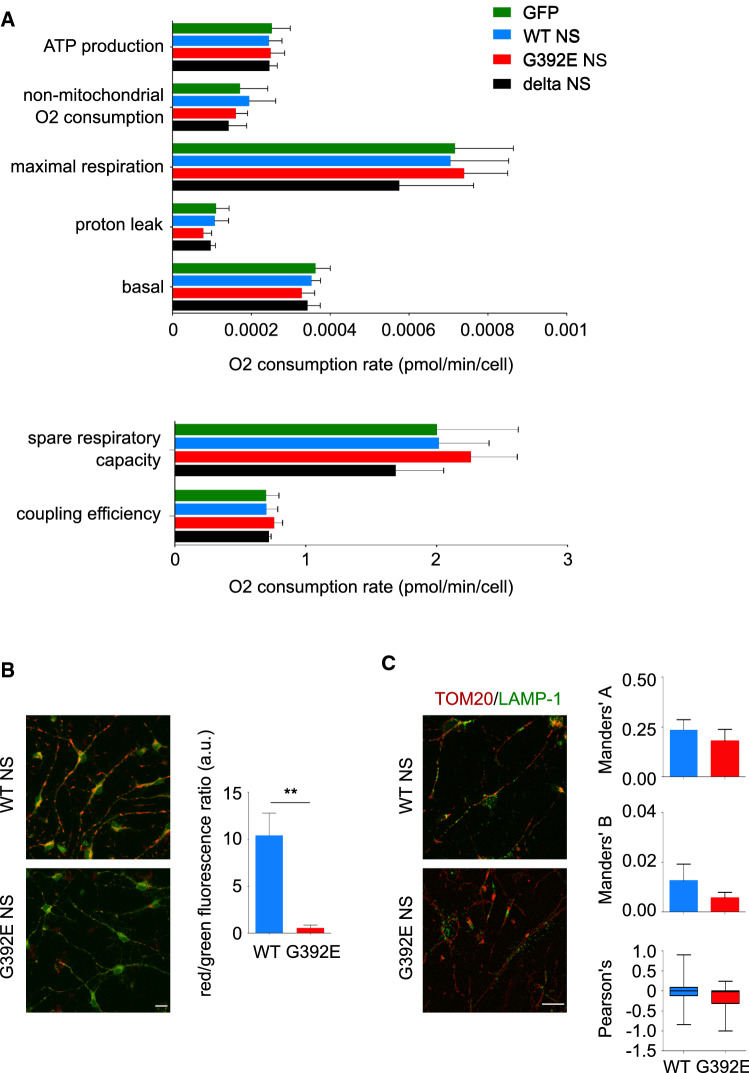
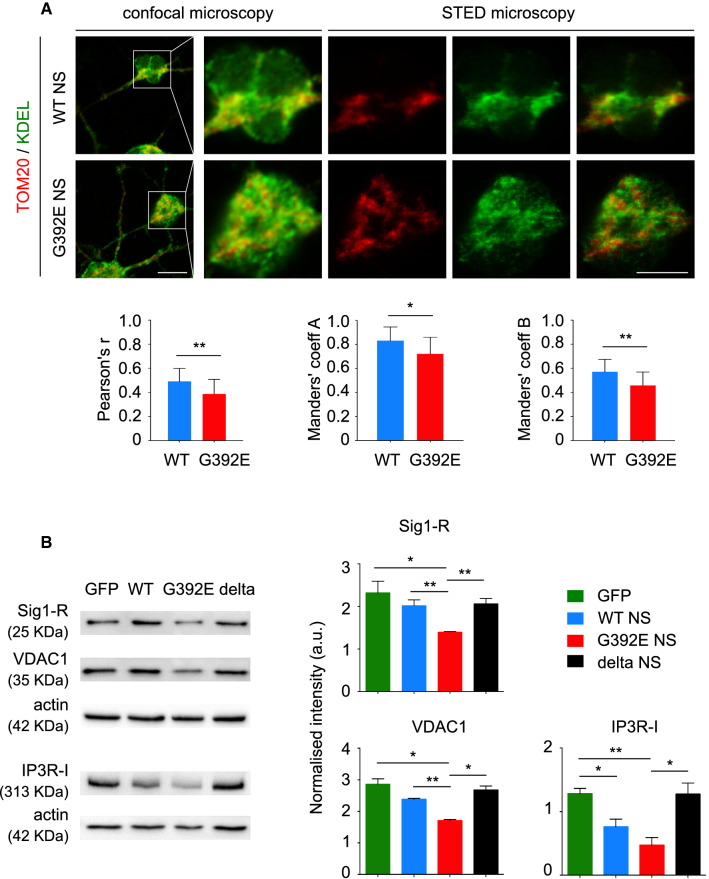
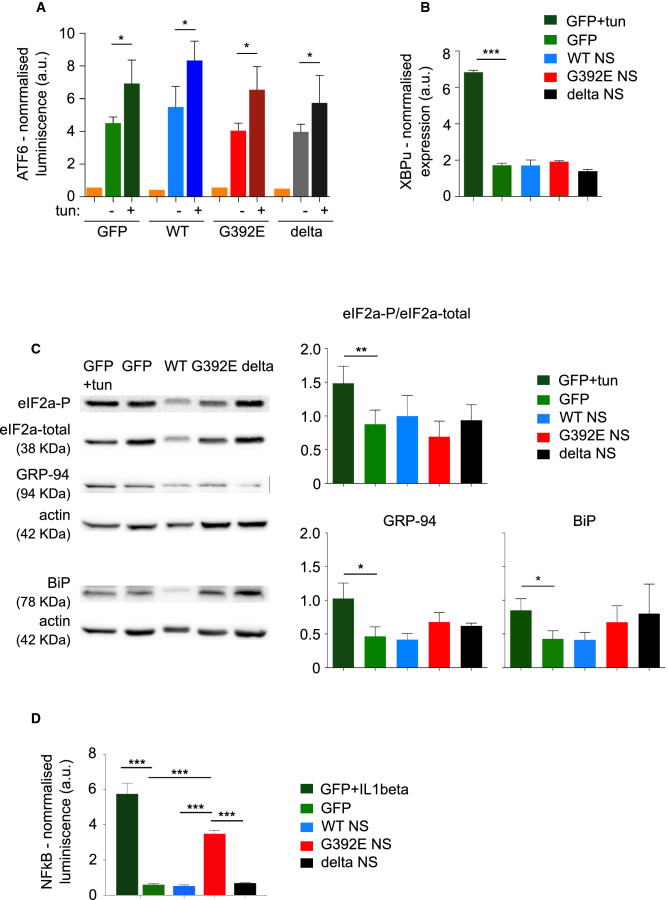
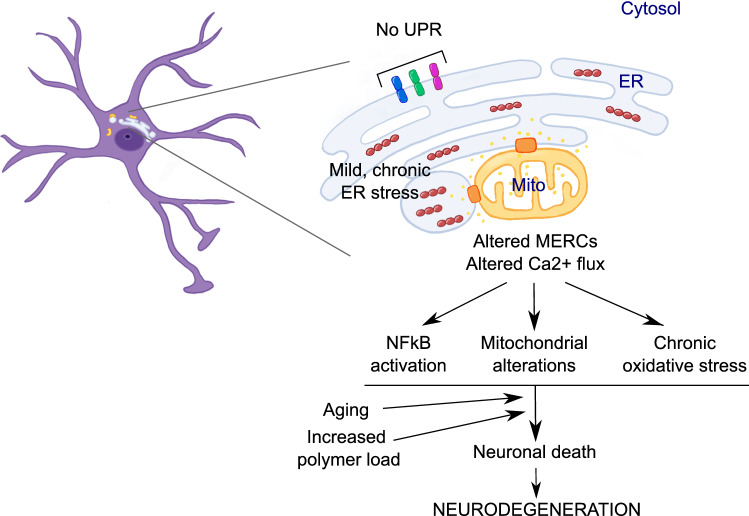
The neurodegenerative condition FENIB (familiar encephalopathy with neuroserpin inclusion bodies) is caused by heterozygous expression of polymerogenic mutant neuroserpin (NS), with polymer deposition within the endoplasmic reticulum (ER) of neurons. We generated transgenic neural progenitor cells (NPCs) from mouse fetal cerebral cortex stably expressing either the control protein GFP or human wild type, polymerogenic G392E or truncated (delta) NS. This cellular model makes it possible to study the toxicity of polymerogenic NS in the appropriated cell type by in vitro differentiation to neurons. Our previous work showed that expression of G392E NS in differentiated NPCs induced an adaptive response through the upregulation of several genes involved in the defence against oxidative stress, and that pharmacological reduction of the antioxidant defences by drug treatments rendered G392E NS neurons more susceptible to apoptosis than control neurons. In this study, we assessed mitochondrial distribution and found a higher percentage of perinuclear localisation in G392E NS neurons, particularly in those containing polymers, a phenotype that was enhanced by glutathione chelation and rescued by antioxidant molecules. Mitochondrial membrane potential and contact sites between mitochondria and the ER were reduced in neurons expressing the G392E mutation. These alterations were associated with a pattern of ER stress that involved the ER overload response but not the unfolded protein response. Our results suggest that intracellular accumulation of NS polymers affects the interaction between the ER and mitochondria, causing mitochondrial alterations that contribute to the neuronal degeneration seen in FENIB patients.

Keywords: ER overload; MERCs; Neural progenitor cells; Neurodegeneration; Neurons; Oxidative stress; Protein conformational disease; Serpin polymers.


Conflict of interest statement

The authors have no relevant financial or non-financial interests to disclose.

Figures

Fig. 1
Fig. 1
Neural progenitor cells differentiate to neurons under chemically defined conditions. A Expression of the neuroblast differentiation gene Dcx in NPCs cultured under proliferating and differentiating conditions, normalised to expression in explants of E13.5 mouse telencephalon. The data are mean ± SEM of 3 independent experiments, t test: ***p ≤ 0.001. B Cell lysates and culture media of stably transfected NPCs expressing GFP or WT, G392E or delta NS, were collected after 6 days of differentiation. Delta NS cells were treated or not with the reversible proteasomal inhibitor MG132 (2 µM for 12 h) to demonstrate expression, since this variant is efficiently degraded by ERAD [13]. Samples were resolved by 10% w/v acrylamide SDS-PAGE (top panels, including culture medium for delta NS ± MG132, which did not show NS reactivity since this variant is not secreted [13]) or 7.5% w/v acrylamide non-denaturing PAGE (bottom panels, delta NS lysate and culture medium were included only without MG132, since this variant does not polymerise [13]) and analysed by western blot with an anti-NS polyclonal antibody. The same SDS-PAGE membrane was probed for ß-actin as a loading control (middle panel). C Immunofluorescence for the neuronal marker ßIII tubulin (red) and the neural progenitor marker nestin (green) and quantification of both types of cells at the end of the 6 days differentiation protocol. Cell nuclei were stained with DAPI (blue), scale bar: 10 µm
Fig. 2
Fig. 2
G392E NS neurons show alterations in mitochondrial distribution that are not due to neuroserpin polymers in the culture medium. A NPCs overexpressing WT NS were differentiated for 6 days and mitochondrial distribution was analysed by immunostaining and confocal microscopy using an anti-TOM20 antibody (red) alone or in combination with the cell identity markers ßIII tubulin (neuronal marker) and nestin (neural progenitor marker) (green). In the bottom row (fragmented), cells were treated with H2O2 to induce mitochondrial fragmentation. Three phenotypes were defined: network (top row), with filamentous mitochondria distributed throughout the cells; perinuclear (middle row), with mitochondria clustered close to the nucleus; and fragmented (bottom row), with small round mitochondria located in the perinuclear region. In all panels, cell nuclei were stained with DAPI (blue) and only the merged images are shown (the separate channels are shown in Suppl. Fig. S1). The arrows point to cells positive to the indicated marker and mitochondrial phenotype. Scale bar: 10 µm. B NPCs overexpressing GFP or WT, G392E or delta NS were differentiated and stained with Mitotracker to quantify the number of neurons for each mitochondrial phenotype. As a positive control, GFP cells were treated with H2O2 that mostly induced mitochondrial fragmentation. Cell nuclei were stained with DAPI (blue). The arrows point to cells with perinuclear mitochondria. Scale bar: 10 µm. The data in the graph (collected in Table 1) are mean ± SEM of 3 independent experiments, with 100 to 250 cells of each type counted in each experiment. The percentage of neurons with perinuclear distribution for G392E NS cells was compared to the other cell lines by t test: ***p ≤ 0.001. C GFP, WT NS and G392E NS NPCs were differentiated for 3 days, after which the culture media were collected and used to treat parallel GFP cultures for the remaining 3 days of differentiation as indicated in the figure. Mitochondrial distribution was assessed by staining with Mitotracker. The data are mean ± SEM of 5 independent experiments, with 100 neurons counted in each repeat
Fig. 3
Fig. 3
Neurons and non-neuronal G392E NS cells contain NS polymers but alterations in mitochondrial distribution are more frequent in neurons. A Immunofluorescence staining of G392E NS cells for NS polymers (anti-polymer mAb 7C6, green) and mitochondria (anti-TOM20, red). The panel shows a neuron (small arrow) and non-neuronal cells (arrowheads) that contain NS polymers. Scale bar: 10 µm. B Quantification of neuronal and non-neuronal G392E NS cells with network or perinuclear mitochondrial distribution and with presence or absence of NS polymers. The ring graphs show the percentages of cells for each phenotype (approximated to the nearest whole number for simplicity), the top histogram compares the percentages of neurons and non-neuronal cells with and without NS polymers, and the bottom histogram compares the percentages of neurons and non-neuronal cells with perinuclear mitochondrial distribution that contain or not NS polymers. The data are mean ± SEM of 3 independent experiments, with 100 to 250 cells of each type counted in each experiment; t test: ***p ≤ 0.001, **p ≤ 0.01, *p ≤ 0.05. These data are collected in Table 2
Fig. 4
Fig. 4
Mitochondrial distribution in differentiated G392E NS neurons can be rescued by antioxidant molecules. A The percentage of neurons with network, perinuclear (small arrows) and fragmented (arrowheads) mitochondrial distribution was evaluated for each cell line after differentiation for 6 days, without and with treatment with DEM (50 µM for 1 h), by staining with Mitotracker and cell counting. Cell nuclei were stained with DAPI (blue). Scale bar: 10 µm. The graph shows the mean ± SEM, n = 3 (100 cells counted per experiment); t test: ***p ≤ 0.001, **p ≤ 0.01, *p ≤ 0.05. B Cells prepared as in A, were treated with 10 µM α-tocopherol (top graph) or 10 µM melatonin (bottom graph) during the last 48 h of differentiation and mitochondrial distribution was analysed in the same way. The data are mean ± SEM, n = 5 (100 cells counted per experiment); t test: ***p ≤ 0.001, *p ≤ 0.05. The data presented in A and B are collected in Table 1
Fig. 5
Fig. 5
G392E NS neurons present a reduction in the potential of the inner mitochondrial membrane in the absence of alterations of the mitochondrial metabolism. A NPCs were differentiated for 6 days and Seahorse analysis was performed by recording the oxygen consumption rate in each culture well, in the presence of pharmacological treatments as described in the Materials and Methods and supplementary Fig. S3. The graphs show the values for mitochondrial metabolic parameters for the four cell lines. The data are mean ± SEM, n = 5, one-way ANOVA showed no statistically significant differences between the four cell lines. B WT and G392E NS cells were differentiated for 6 days and the inner mitochondrial membrane potential was assayed with the JC-1 probe by live cell imaging and quantified as the ratio of red (aggregated JC-1)/green (monomeric JC-1) fluorescence. Scale bar 10 µm. The data are mean ± SEM, n = 3 (at least 100 neurons were analysed in each experiment); t test: **p ≤ 0.01. C WT and G392E NS cells differentiated for 6 days were stained against the mitochondrial protein TOM20 (red) and the endo-lysosomal protein LAMP-1 (green) and neurons were analysed by confocal microscopy; the co-localisation between both markers was quantified by Manders’ overlap coefficients (A green/red; B red/green) and Pearson’s correlation coefficient. Scale bar 10 µm. For both Manders’ coefficients, the data are mean ± SEM, for the Pearson’s coefficient data are median with whiskers from maximum to minimum, n = 3 (12 fields analysed in each experiment)
Fig. 6
Fig. 6
G392E NS neurons show a reduction in mitochondria-associated ER membranes. A NPCs overexpressing WT or G392E NS were differentiated for 6 days, double stained for TOM20 (red) and KDEL (green) and analysed by high resolution (STED) confocal microscopy. The panels show representative images of WT and G392E NS cells, while the graphs show the Pearson’s (left) and the two Manders’ coefficients (coefficient A: overlapping of red over green fluorescence, coefficient B: overlapping of green over red fluorescence). Scale bar 10 µm. The data are mean ± SEM, n = 3 (15–20 neurons analysed per experiment, for a total of 45–60 cells per condition), t test: **p ≤ 0.01, *p ≤ 0.05. B WT and G392E NS cell lysates were resolved by 10% w/v acrylamide SDS-PAGE and analysed by western blot with anti-Sigma1-R (Sig1-R), VDAC1 and IP3R-I antibodies. The same membranes were probed for ß-actin as a loading control. The graphs show the densitometric analysis for each protein normalised to ß-actin. The data are mean ± SEM, n = 3; t test: ***p ≤ 0.001, **p ≤ 0.01, *p ≤ 0.05
Fig. 7
Fig. 7
Differentiated cultures of G392E NS cells show activation of NFκB, but not the UPR. A NPCs overexpressing GFP or WT, G392E or delta NS were co-transfected with a firefly luciferase reporter responsive to the activation of the UPR and a constitutive Renilla luciferase reporter as a transfection control used for normalisation. Cells were left to recover for 1 day and differentiated to neurons for 3 days. For each line, parallel wells were treated or not with tunicamycin (TUN) for 6 h as a positive control for UPR activation. Cells were collected for a dual luciferase assay and parallel wells without luciferase transfection were used as a baseline control (orange bars). B Relative mRNA levels of unspliced XBP1 in cultures expressing GFP or WT, G392E or delta NS after 6 days of differentiation and normalization to expression levels in proliferating GFP cultures. GFP cells treated with tunicamycin for 6 h (GFP + tun) were used as a positive control. C NPCs overexpressing GFP or WT, G392E or delta NS were differentiated to neurons for 6 days and collected for western blot analysis after 10% w/v acrylamide SDS-PAGE, using anti-KDEL for BiP and GRP-94 detection, anti-eIF2α and anti-phosphorylated eIF2a antibodies. The first three panels from the top correspond to the ß-actin loading control underneath them (all performed in the same membrane), while the BiP panel refers to its own ß-actin loading control (both in the same membrane). The graphs show the densitometric quantification for each protein normalised to ß-actin. D Cells were co-transfected and treated as in A except for the use a firefly luciferase reporter for NFκB activation and the use of IL1-ß to generate a positive control for the GFP cell line. All quantitative data are mean ± SEM, n = 3; t test: ***p ≤ 0.001, **p ≤ 0.01, *p ≤ 0.05
Fig. 8
Fig. 8
Proposed mechanism for NS polymer toxicity and neurodegeneration in FENIB. The accumulation of NS polymers (red bead chains) within the ER of neurons causes chronic ER stress that is transmitted to mitochondria (Mito) through MERCs (orange transmembrane complexes) in a Ca2+-dependent manner (Ca2+ ions: small yellow dots). This causes mitochondrial alterations, chronic oxidative stress (which may start at the ER and/or at mitochondria, [51]) and NFκB activation in the absence of UPR signalling (blue, green and fuchsia transmembrane proteins: UPR transducers). Aging and increasing polymer load eventually overcome the neuroprotective responses, causing neuronal death and neurodegeneration

Similar articles

Cited by

References

    1. Lomas DA, Carrell RW. Serpinopathies and the conformational dementias. Nat Rev Genet. 2002;3:759–768. doi: 10.1038/nrg907. - DOI - PubMed
    1. Davis RL, Shrimpton AE, Holohan PD, et al. Familial dementia caused by polymerization of mutant neuroserpin. Nature. 1999;401:376–379. doi: 10.1038/43894. - DOI - PubMed
    1. Davis RL, Shrimpton AE, Carrell RW, et al. Association between conformational mutations in neuroserpin and onset and severity of dementia. Lancet. 2002;359:2242–2247. doi: 10.1016/S0140-6736(02)09293-0. - DOI - PubMed
    1. Gourfinkel-An I, Duyckaerts C, Camuzat A, et al. Clinical and neuropathologic study of a French family with a mutation in the neuroserpin gene. Neurology. 2007;69:79–83. doi: 10.1212/01.wnl.0000265052.99144.b5. - DOI - PubMed
    1. Coutelier M, Andries S, Ghariani S, et al. Neuroserpin mutation causes electrical status epilepticus of slow-wave sleep. Neurology. 2008;71:64–66. doi: 10.1212/01.wnl.0000316306.08751.28. - DOI - PubMed

Supplementary concepts