

Cold exposure induces lipid dynamics and thermogenesis in brown adipose tissue of goats
- PMID: 35864448
- PMCID: PMC9306100
- DOI: 10.1186/s12864-022-08765-5
Cold exposure induces lipid dynamics and thermogenesis in brown adipose tissue of goats
Abstract
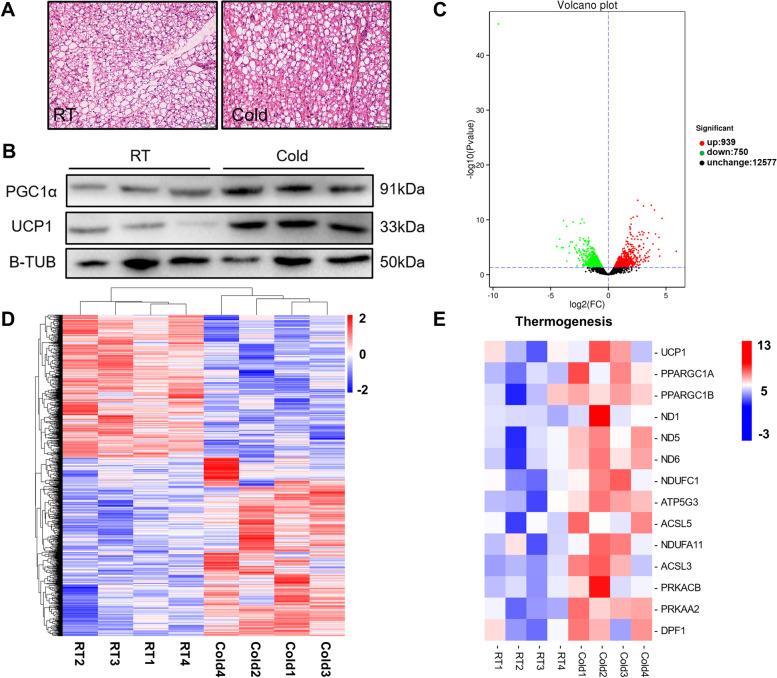
Background: Adaptive thermogenesis by brown adipose tissue (BAT) is important to the maintenance of temperature in newborn mammals. Cold exposure activates gene expression and lipid metabolism to provide energy for BAT thermogenesis. However, knowledge of BAT metabolism in large animals after cold exposure is still limited.
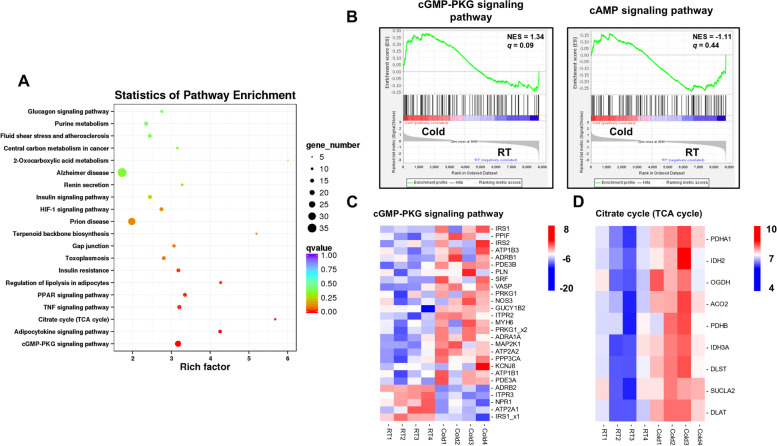
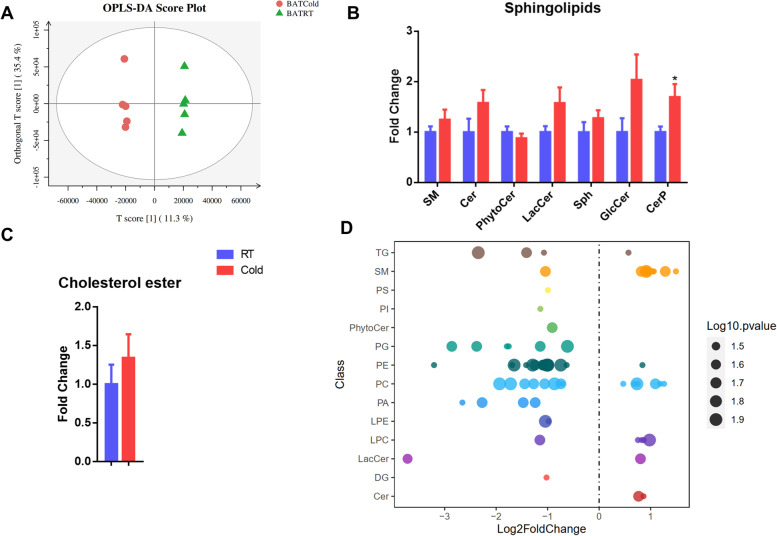
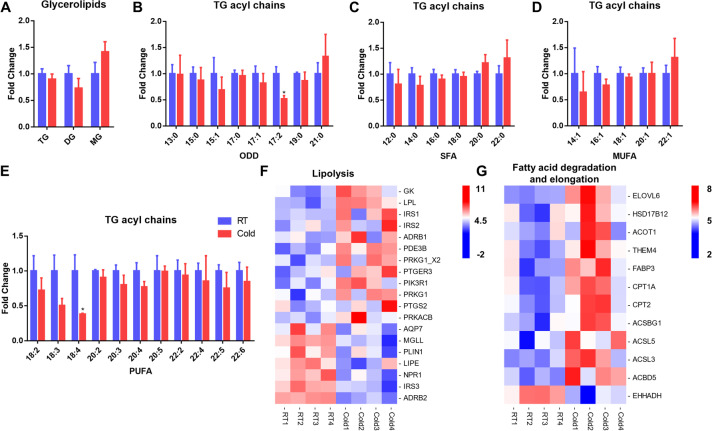
Results: In this study, we found that cold exposure induced expression of BAT thermogenesis genes and increased the protein levels of UCP1 and PGC1α. Pathway analysis showed that cold exposure activated BAT metabolism, which involved in cGMP-PKG, TCA cycle, fatty acid elongation, and degradation pathways. These were accompanied by decreased triglyceride (TG) content and increased phosphatidylcholine (PC) and phosphatidylethanolamine (PE) content in BAT.
Conclusion: These results demonstrate that cold exposure induces metabolites involved in glycerolipids and glycerophospholipids metabolism in BAT. The present study provides evidence for lipid composition associated with adaptive thermogenesis in goat BAT and metabolism pathways regulated by cold exposure.
Keywords: Brown adipose tissue; Cold exposure; Lipid metabolism; RNA-seq; Thermogenesis.
© 2022. The Author(s).
Conflict of interest statement
The authors declare no conflicts of interest.
Figures


Similar articles
-
Maternal L-carnitine supplementation promotes brown adipose tissue thermogenesis of newborn goats after cold exposure.FASEB J. 2022 Aug;36(8):e22461. doi: 10.1096/fj.202200637R. FASEB J. 2022. PMID: 35838582
-
UCP1-dependent and UCP1-independent metabolic changes induced by acute cold exposure in brown adipose tissue of mice.Metabolism. 2020 Dec;113:154396. doi: 10.1016/j.metabol.2020.154396. Epub 2020 Oct 14. Metabolism. 2020. PMID: 33065161
-
Cold-induced lipid dynamics and transcriptional programs in white adipose tissue.BMC Biol. 2019 Sep 17;17(1):74. doi: 10.1186/s12915-019-0693-x. BMC Biol. 2019. PMID: 31530289 Free PMC article.
-
Cold-induced changes in gene expression in brown adipose tissue: implications for the activation of thermogenesis.Biol Pharm Bull. 2008 May;31(5):775-84. doi: 10.1248/bpb.31.775. Biol Pharm Bull. 2008. PMID: 18451493 Review.
-
Thermogenesis and Energy Metabolism in Brown Adipose Tissue in Animals Experiencing Cold Stress.Int J Mol Sci. 2025 Mar 31;26(7):3233. doi: 10.3390/ijms26073233. Int J Mol Sci. 2025. PMID: 40244078 Free PMC article. Review.
Cited by
-
Mass Spectrometry-Based Lipidomics of Brown Adipose Tissue and Plasma of New-Born Lambs Subjected to Short-Term Cold Exposure.Animals (Basel). 2022 Oct 14;12(20):2762. doi: 10.3390/ani12202762. Animals (Basel). 2022. PMID: 36290148 Free PMC article.
-
A Novel LncRNA MSTRG.310246.1 Promotes Differentiation and Thermogenesis in Goat Brown Adipocytes.Genes (Basel). 2023 Mar 30;14(4):833. doi: 10.3390/genes14040833. Genes (Basel). 2023. PMID: 37107590 Free PMC article.
-
RNAseq Analysis of Brown Adipose Tissue and Thyroid of Newborn Lambs Subjected to Short-Term Cold Exposure Reveals Signs of Early Whitening of Adipose Tissue.Metabolites. 2022 Oct 20;12(10):996. doi: 10.3390/metabo12100996. Metabolites. 2022. PMID: 36295898 Free PMC article.
-
Cold Exposure Regulates Hepatic Glycogen and Lipid Metabolism in Newborn Goats.Int J Mol Sci. 2023 Sep 20;24(18):14330. doi: 10.3390/ijms241814330. Int J Mol Sci. 2023. PMID: 37762634 Free PMC article.
-
The Role of Brown Adipose Tissue and Energy Metabolism in Mammalian Thermoregulation during the Perinatal Period.Animals (Basel). 2023 Jul 1;13(13):2173. doi: 10.3390/ani13132173. Animals (Basel). 2023. PMID: 37443971 Free PMC article. Review.
References
-
- Basse AL, Dixen K, Yadav R, Tygesen MP, Qvortrup K, Kristiansen K, Quistorff B, Gupta R, Wang J, Hansen JB. Global gene expression profiling of brown to white adipose tissue transformation in sheep reveals novel transcriptional components linked to adipose remodeling. BMC Genomics. 2015;16:215. doi: 10.1186/s12864-015-1405-8. - DOI - PMC - PubMed
MeSH terms
Substances
LinkOut - more resources
Full Text Sources
Miscellaneous
