

Geospatial analysis of cesarean section in Iran (2016-2020): exploring clustered patterns and measuring spatial interactions of available health services
- PMID: 35864462
- PMCID: PMC9302231
- DOI: 10.1186/s12884-022-04856-z
Geospatial analysis of cesarean section in Iran (2016-2020): exploring clustered patterns and measuring spatial interactions of available health services
Abstract
Background: The lives of babies and mothers are at risk due to the uneven distribution of healthcare facilities required for emergency cesarean sections (CS). However, CS without medical indications might cause complications for mothers and babies, which is a global health problem. Identifying spatiotemporal variations of CS rates in each geographical area could provide helpful information to understand the status of using CS services.
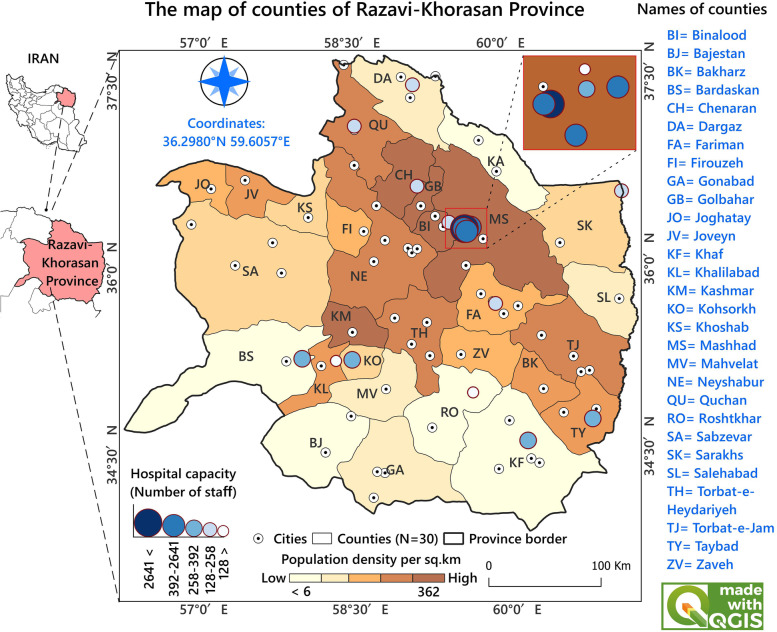
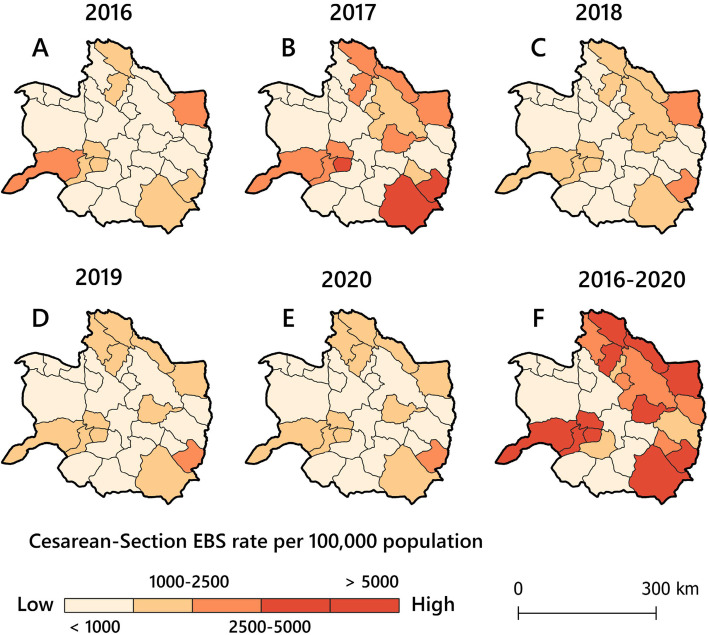
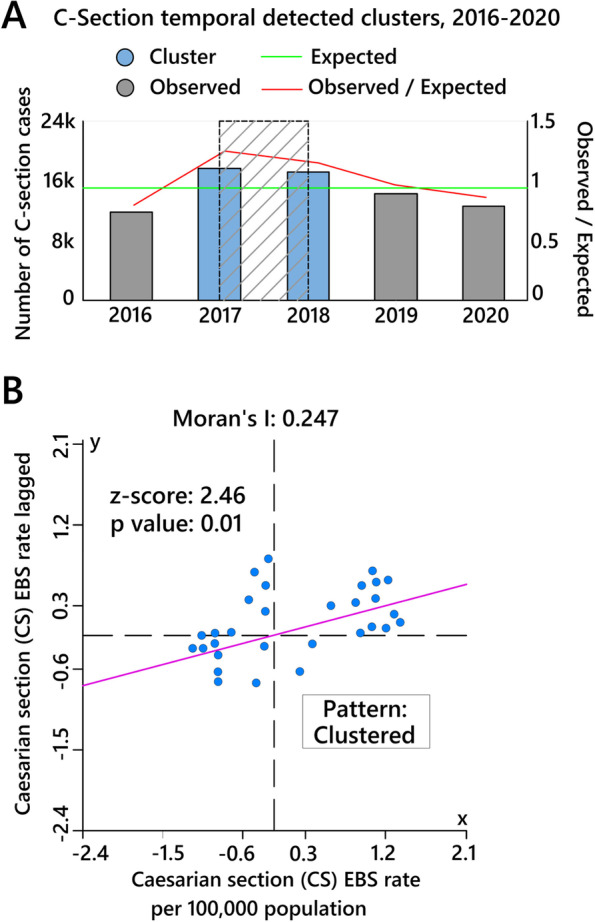
Methods: This cross-sectional study explored spatiotemporal patterns of CS in northeast Iran from 2016 to 2020. Space-time scan statistics and spatial interaction analysis were conducted using geographical information systems to visualize and explore patterns of CS services.
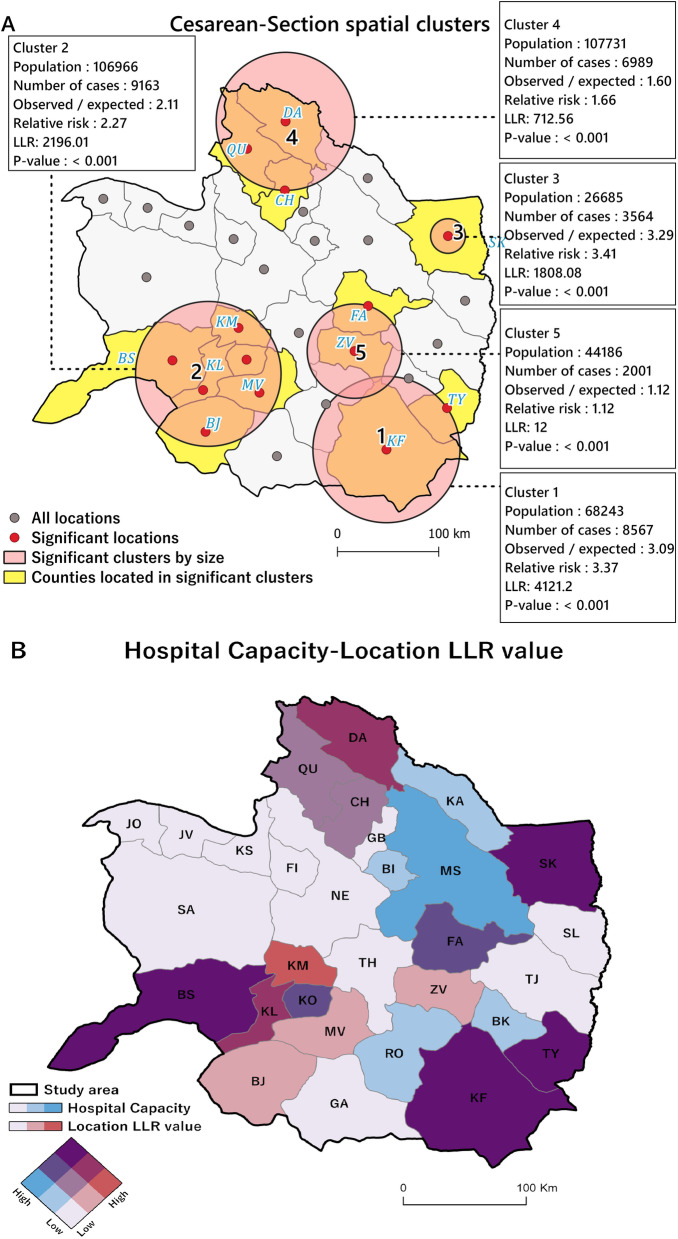
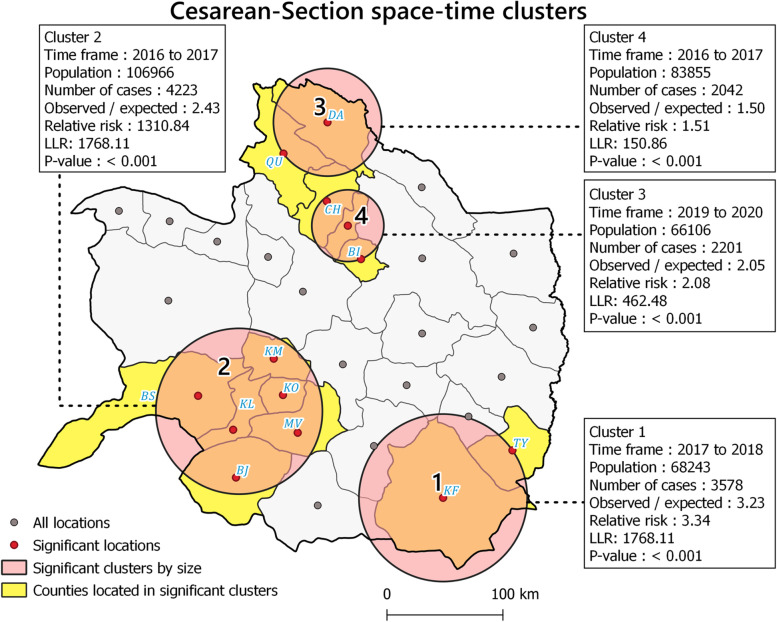
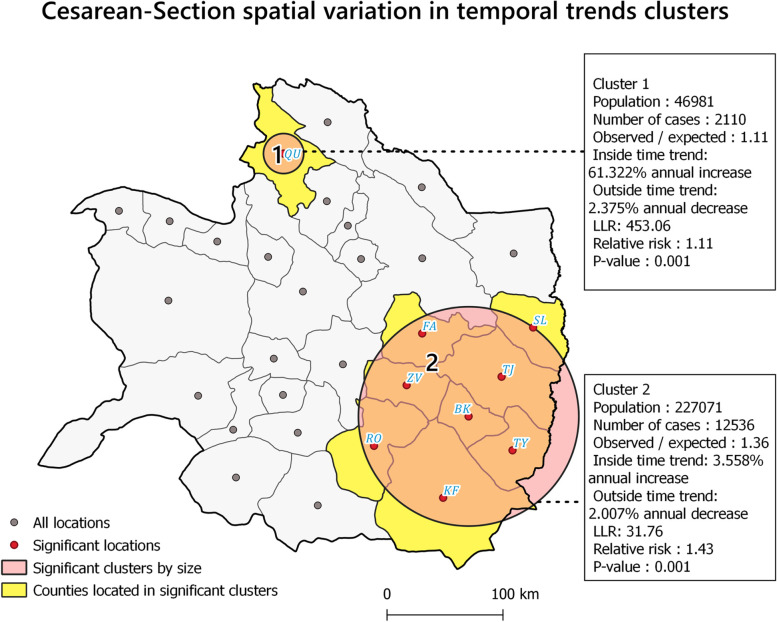
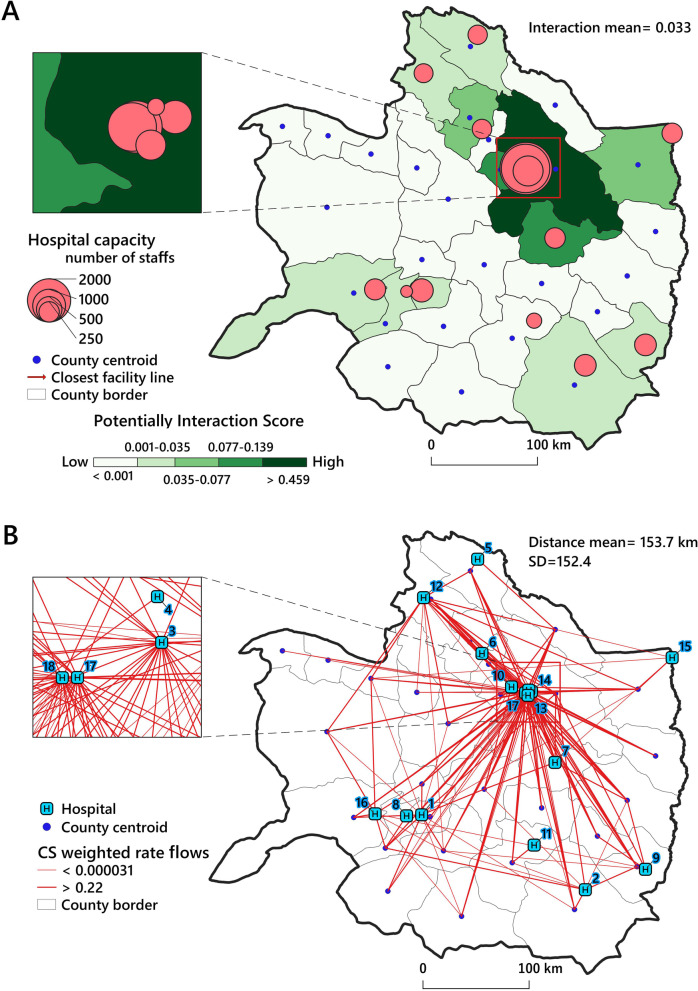
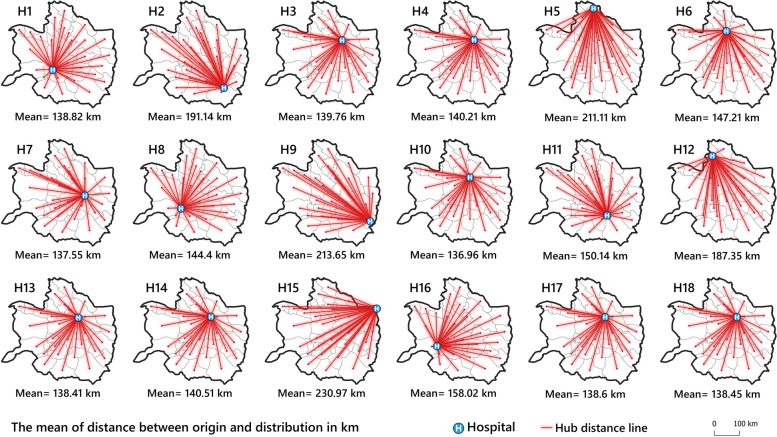
Results: The temporal analysis identified 2017 and 2018 as the statistically significant high clustered times in terms of CS rate. Five purely spatial clusters were identified that were distributed heterogeneously in the study region and included 14 counties. The spatiotemporal analysis identified four clusters that included 13 counties as high-rate areas in different periods. According to spatial interaction analysis, there was a solid spatial concentration of hospital facilities in the political center of the study area. Moreover, a high degree of inequity was observed in spatial accessibility to CS hospitals in the study area.
Conclusions: CS Spatiotemporal clusters in the study area reveal that CS use in different counties among women of childbearing age is significantly different in terms of location and time. This difference might be studied in future research to identify any overutilization of CS or lack of appropriate CS in clustered counties, as both put women at risk. Hospital capacity and distance from population centers to hospitals might play an essential role in CS rate variations and spatial interactions among people and CS facilities. As a result, some healthcare strategies, e.g., building new hospitals and empowering the existing local hospitals to perform CS in areas out of service, might be developed to decline spatial inequity.
Keywords: Cesarean section; Geographical information systems; Spatial epidemiology; Spatial interaction; Spatiotemporal analysis.
© 2022. The Author(s).
Conflict of interest statement
The authors declare that they have no competing interests.
Figures
References
-
- Maternal mortality. Available from: https://www.who.int/news-room/fact-sheets/detail/maternal-mortality. [Cited 2022 Apr 14].
-
- Konlan KD, Baku EK, Japiong M, Dodam Konlan K, Amoah RM. Reasons for women’s choice of elective caesarian section in Duayaw Nkwanta Hospital. J Pregnancy. 2019;2019. 10.1155/2019/2320743. Available from: https://pubmed.ncbi.nlm.nih.gov/31360548/. - PMC - PubMed
-
- Atuheire EB, Opio DN, Kadobera D, Ario AR, Matovu JKB, Harris J, et al. Spatial and temporal trends of cesarean deliveries in Uganda: 2012–2016. BMC Pregnancy Childbirth. 2019;19(1):1–8. 10.1186/S12884-019-2279-6/FIGURES/2. Available from: https://bmcpregnancychildbirth.biomedcentral.com/articles/10.1186/s12884.... - DOI - PMC - PubMed
MeSH terms
Grants and funding
LinkOut - more resources
Full Text Sources
Medical
