. 2022 Jul 21;20(1):165.
doi: 10.1186/s12915-022-01362-8.

Dynamic enhancer transcription associates with reprogramming of immune genes during pattern triggered immunity in Arabidopsis

Affiliations

Dynamic enhancer transcription associates with reprogramming of immune genes during pattern triggered immunity in Arabidopsis

Ying Zhang et al. BMC Biol. .

Abstract

Background: Enhancers are cis-regulatory elements present in eukaryote genomes, which constitute indispensable determinants of gene regulation by governing the spatiotemporal and quantitative expression dynamics of target genes, and are involved in multiple life processes, for instance during development and disease states. The importance of enhancer activity has additionally been highlighted for immune responses in animals and plants; however, the dynamics of enhancer activities and molecular functions in plant innate immunity are largely unknown. Here, we investigated the involvement of distal enhancers in early innate immunity in Arabidopsis thaliana.

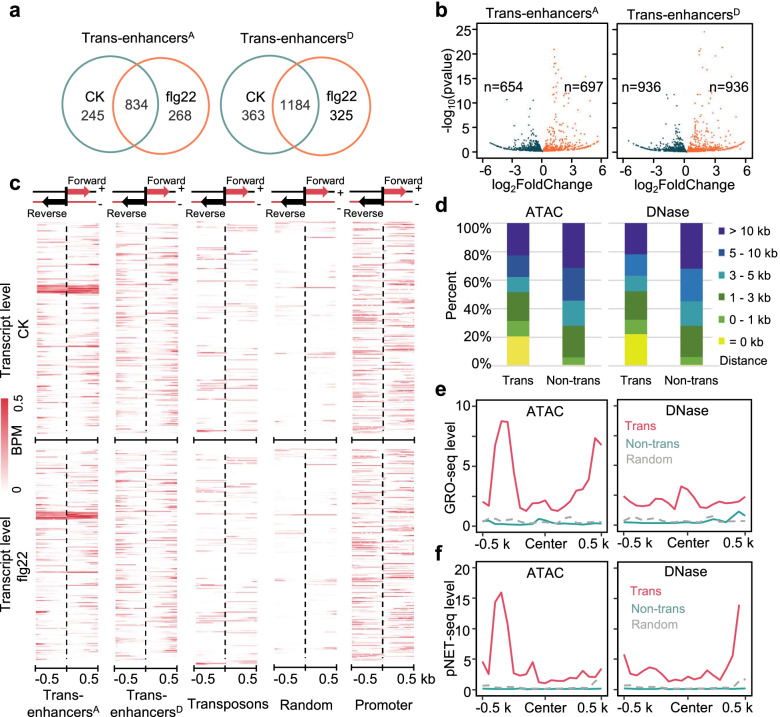
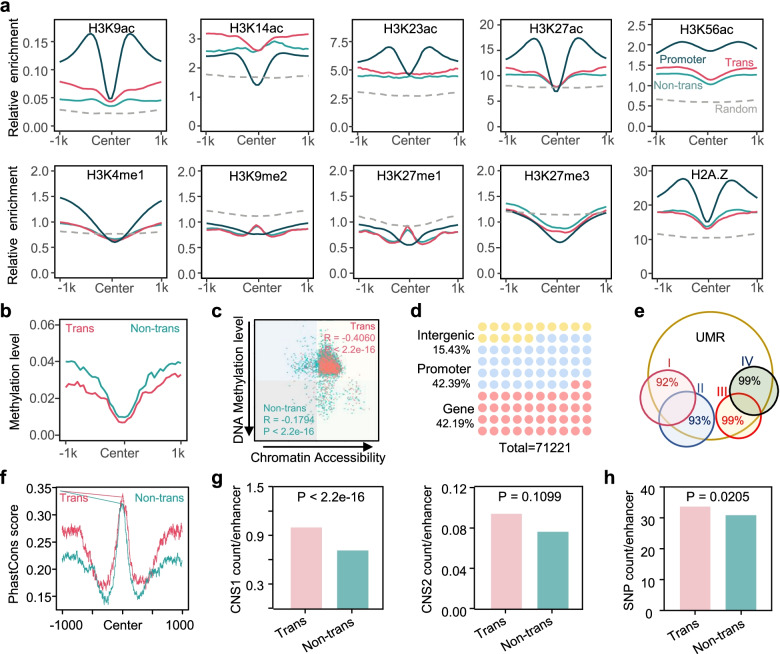
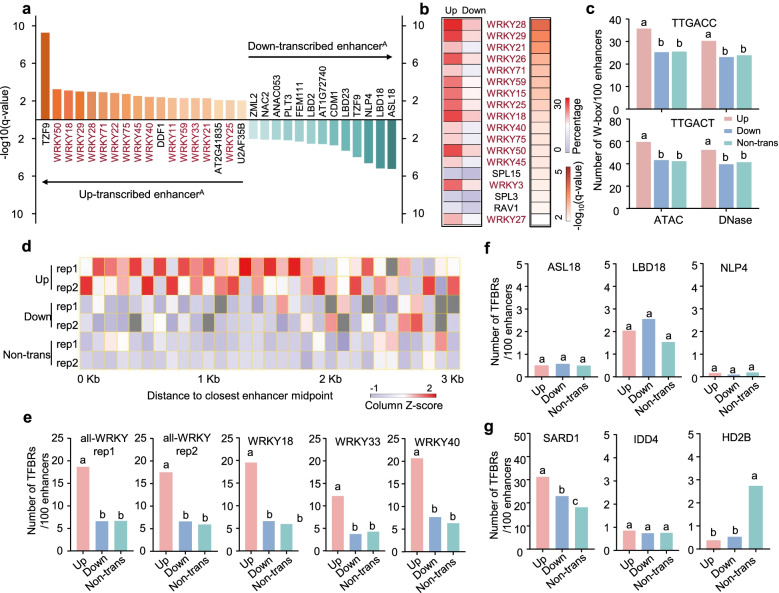
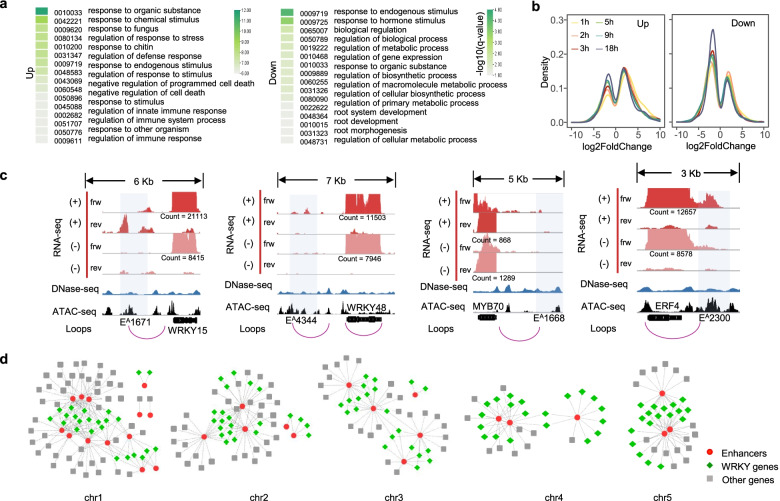
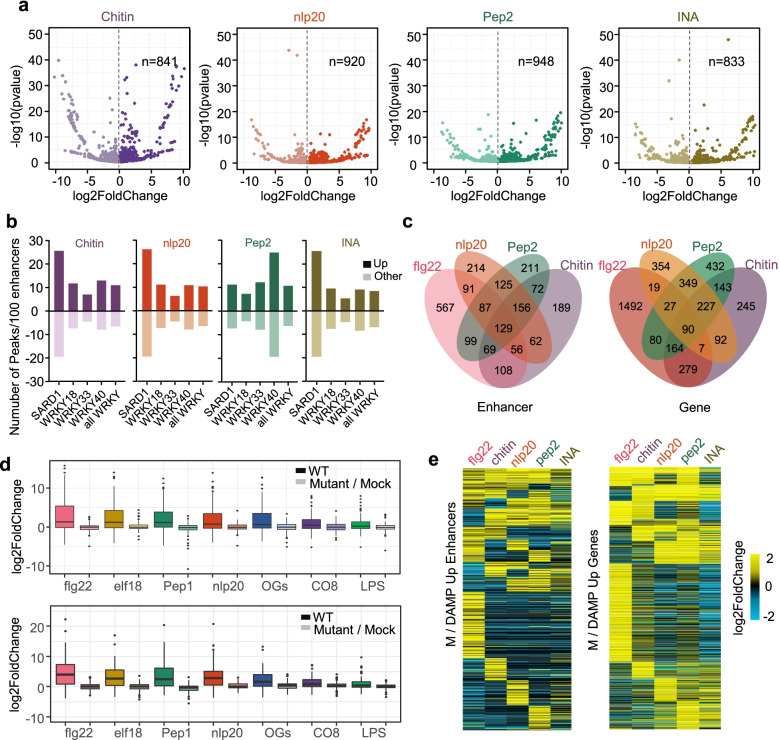
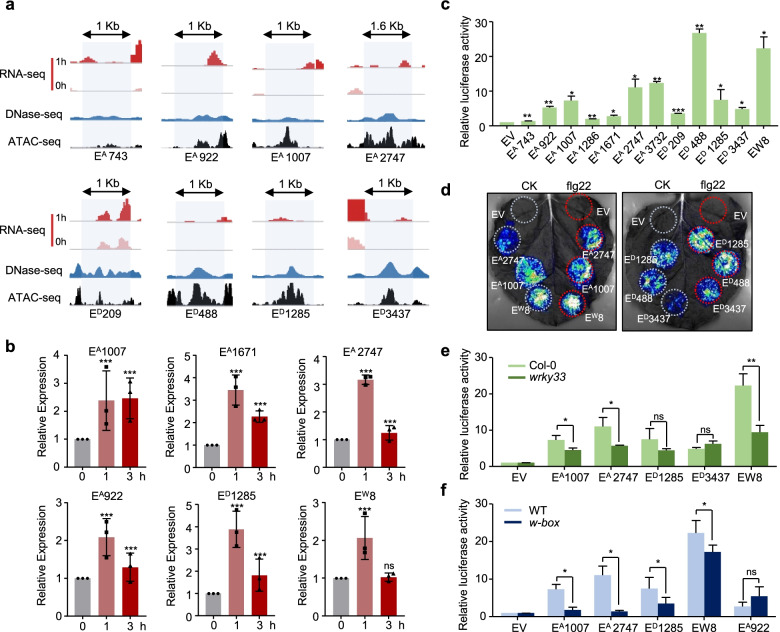
Results: A group of putative distal enhancers producing low-abundance transcripts either unidirectionally or bidirectionally are identified. We show that enhancer transcripts are dynamically modulated in plant immunity triggered by microbe-associated molecular patterns and are strongly correlated with open chromatin, low levels of methylated DNA, and increases in RNA polymerase II targeting and acetylated histone marks. Dynamic enhancer transcription is correlated with target early immune gene expression patterns. Cis motifs that are bound by immune-related transcription factors, such as WRKYs and SARD1, are highly enriched within upregulated enhancers. Moreover, a subset of core pattern-induced enhancers are upregulated by multiple patterns from diverse pathogens. The expression dynamics of putative immunity-related enhancers and the importance of WRKY binding motifs for enhancer function were also validated.

Conclusions: Our study demonstrates the general occurrence of enhancer transcription in plants and provides novel information on the distal regulatory landscape during early plant innate immunity, providing new insights into immune gene regulation and ultimately improving the mechanistic understanding of the plant immune system.

Keywords: Cis-regulatory elements; Enhancer RNAs; Enhancers; Plant innate immunity; Transcriptional regulation.


Conflict of interest statement

The authors declare that they have no competing interests.

Figures

Fig. 1
Fig. 1
Distal enhancer transcription were responsive to flg22 treatment in Arabidopsis. a Numbers of transcribed distal enhancer before and after flg22 signaling activation. Trans-enhancersA, ATAC-seq-based transcribed enhancers; Trans-enhancersD, DNase-seq-based transcribed enhancers. b Volcano Plots show differentially expressed transcribed enhancersA and transcribed enhancersD upon flg22 treatment. The numbers of up (x-axis > 0, warm orange) and down (x-axis < 0, blackish green) transcribed enhancers are shown, respectively. c Heatmaps of transcript levels at transcribed enhancers, transposons, promoters (proximal ATAC-seq peaks), and random sequences. Transcript level with and without flg22 treatment were calculated at and around (±0.5 kb) the sequence candidates. The color scales are in BPM for transcript level. d Distribution of the mean distance from enhancers to the nearest RNA Pol II peaks. e, f Distribution of the signals (BPM scale) derived from GRO-seq (e) and pNET-seq (f) at transcribed enhancers, nontranscribed enhancers, and random sequences. Left and right panels represent ATAC-seq-based enhancers and DNase-seq-based enhancers, respectively
Fig. 2
Fig. 2
Transcribed enhancers represent a more active and conserved class of distal cis-regulatory elements. a Distribution of different histone modifications and the histone variant H2A.Z at transcribed enhancers, nontranscribed enhancers, promoter (proximal ATAC-seq peaks), and random sequences. b DNA methylation level (mC, weighted average) profiles around transcribed and nontranscribed enhancers. c Correlation between DNA methylation level (mC, weighted average) and chromatin accessibility of all transcribed enhancers is represented graphically by a scatterplot. d Distribution of the unmethylated regions (UMRs) in Arabidopsis genomic regions. The total number of UMRs and genome proportion of each part are shown. e Overlap of the total length of enhancers relative to UMRs. The percentage of enhancers overlapping with the UMRs was listed. I, transcribed enhancersA; II, nontranscribed enhancersA; III, transcribed enhancersD; IV, non-transcribed enhancersD. f Conversation analysis of transcribed and non-transcribed enhancers by PhastCons. g, h Mean count of conserved noncoding sequences (CNSs) (g) and single-nucleotide polymorphisms (SNPs) (h) per one hundred transcribed or non-transcribed enhancers. Significant differences among groups were analyzed using the one-tailed Student’s t test
Fig. 3
Fig. 3
WRKY family transcription factors are enriched in up-transcribed enhancers. a Significant enrichment (P-value < 0.05) of transcription factors binding motifs in transcribed enhancersA relative to that in non-transcribed enhancersA. b Significant enrichment (P-value < 0.05) of TF binding motifs in upregulated enhancersA relative to that in downregulated enhancersA. The percentage of sequences in the target group versus the background group are displayed to the left of the genes. Enrichment P-values are listed to the right of the genes as −log10 transformed values. c, e–g Average number of W-box motif (TTGACC/T) (c) and ChIP-seq peaks of transcription factors (e–g) in up- or downregulated enhancers, and non-transcribed enhancers. WRKYs binding regions with flg22 treatment for 2 h (e); other differentially enriched TFs binding regions (ASL18, mock; LBD18, mock; NLP4, mock) (f); and other immune TFs binding regions (HD2B, 30 min after flg22 treatment; IDD4, 1 h after flg22 treatment; SARD1, 24 h after Pseudomonas syringae pv. maculicola (P.s.m.) ES4326 treatment) (g). Different letters denote significant differences by the one-way ANOVA test (P-value < 0.05). d Distribution of distances of peaks for ChIP-seq using the anti-all-WRKY antibody at control condition to the nearest enhancer midpoint
Fig. 4
Fig. 4
Induction of immune responsive genes are related with the upregulated transcribed enhancers. a Enrichment of the closest genes of upregulated enhancers (left panel) and of downregulated enhancers (right panel) with GO terms. b Frequency distribution of difference in gene expression, which were from the closest genes of upregulated (left panel) and of downregulated enhancers (right panel), post flg22 treatment compared with mock water treatment. c Representative example of immune genes interacted with upregulated enhancers in the loops. Pale blue bars indicate eRNA transcription regions. Plus and minus signs indicate Arabidopsis seedlings treated with flg22 and those that were mock-treated, respectively. The raw read counts of each gene are shown. Frw, forward strand; rev, reverse strand. d Integrated gene regulatory networks (iGRNs) among upregulated enhancersA, WRKY transcription factors and regulatory genes
Fig. 5
Fig. 5
Regulated transcribed enhancers show common characteristic and specificity during multiple PTI signaling. a Volcano Plots shown significant differential expressed transcribed enhancers identified upon the treatments of different immune elicitors. The number of upregulated enhancers is shown. b Average number of WRKYs and SARD1 binding regions in upregulated enhancers (bright color) and downregulated enhancers (light color). c Venn plots showing the overlap number of upregulated enhancers (left panel) and upregulated genes (right panel) that identified upon different patterns treatments. d Box plots of sum of fold change in expression (log2 scale) of core pattern-induced enhancers (CPIEs) (upper panel) and core pattern-induced genes (CPIGs) (lower panel), each pattern treatment in long time series (5, 10, 30, 90, and 180 min) in Col-0 wild-type (WT) and cognate receptor mutant. Note that wak1 mutants are not viable, and thus the OG treatment was paired with a mock water treatment. e Heatmaps of fold change in expression (log2 scale) of 4 patterns co-regulating upregulated enhancers (left) and upregulated genes (right) in each elicitor treatments
Fig. 6
Fig. 6
Validation of the expression dynamic and activation of predicted PTI upregulated enhancers. a Genome browser view of candidate transcribed enhancers. Pale blue bars indicate eRNA transcription regions. b eRNA induction level of candidate transcribed enhancers upon flg22 treatment was verified by RT-qPCR. Ten-day-old seedlings were treated with 100 nM flg22 for 1 and 3 h. The data are shown as mean ± SD from three independent repeats. Different letters indicate significant differences by the one-way ANOVA test (P < 0.05). c The activation in transcriptional regulation of candidate transcribed enhancers in transient expression assays. Arabidopsis protoplasts were infiltrated with constructs of pGL3B_Enhancer-mini35s::LUC. The y-axis represents the fold enrichment of luciferase signals of each construct compared to the control construct containing the mini 35S promoter. d The flg22 treatment increased activity of candidate enhancers. N. benthamiana leaf transiently transformed using Agrobacteria bacterial containing different constructs. Color scale represents the luminescent signal intensity measured by cps (counts per second). e WRKY33 is required for the activity of candidate PTI enhancers. Transient expression assays showing the function in promoting reporter gene expression of candidate enhancers in WT and wrky33 mutant. f The activity of candidate enhancer rely one W-box binding motif. Relative function of wild-type form enhancer and cognate w-box mutants were monitored in Arabidopsis protoplasts. Data are presented in c, e, f as the mean with standard error form six independent biological replicates. The P-values were based on a one-tailed Student’s t test (*P < 0.05, **P < 0.01; ns, no significance)

Similar articles

Cited by

References

    1. Ong CT, Corces VG. Enhancer function: new insights into the regulation of tissue-specific gene expression. Nat Rev Genet. 2011. 10.1038/nrg2957. - PMC - PubMed
    1. Long HK, Prescott SL, Wysocka J. Ever-changing landscapes: transcriptional enhancers in development and evolution. Cell. 2016. 10.1016/j.cell.2016.09.018. - PMC - PubMed
    1. Consortium EP. An integrated encyclopedia of DNA elements in the human genome. Nature. 2012. 10.1038/nature11247. - PMC - PubMed
    1. Parker SC, Stitzel ML, Taylor DL, Orozco JM, Erdos MR, Akiyama JA, et al. chromatin stretch enhancer states drive cell-specific gene regulation and harbor human disease risk variants. Proc Natl Acad Sci U S A. 2013. 10.1073/pnas.1317023110. - PMC - PubMed
    1. Zhu B, Zhang W, Zhang T, Liu B, Jiang J. Genome-wide prediction and validation of intergenic enhancers in Arabidopsis using open chromatin signatures. Plant Cell. 2015. 10.1105/tpc.15.00537. - PMC - PubMed

Publication types