

Determinants of accident and emergency attendances and emergency admissions in infants: birth cohort study
- PMID: 35864495
- PMCID: PMC9302562
- DOI: 10.1186/s12913-022-08319-1
Determinants of accident and emergency attendances and emergency admissions in infants: birth cohort study
Abstract
Background: There is limited understanding of the drivers of increasing infant accident and emergency (A&E) attendances and emergency hospital admissions across England. We examine variations in use of emergency hospital services among infants by local areas in England and investigate the extent to which infant and socio-economic factors explain these variations.
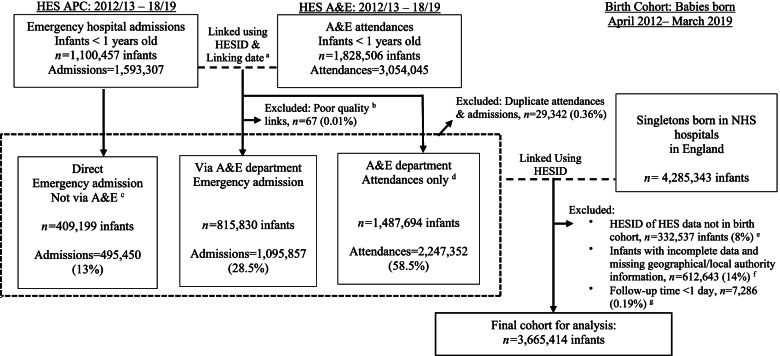
Methods: Birth cohort study using linked administrative Hospital Episode Statistics data in England. Singleton live births between 1-April-2012 and 31-March-2019 were followed up for 1 year; from 1-April-2013 (from the discharge date of their birth admission) until their first birthday, death or 31-March-2019. Mixed effects negative binomial models were used to calculate incidence rate ratios for A&E attendances and emergency admissions and mixed effects logistic regression models estimated odds ratio of conversion (the proportion of infants subsequently admitted after attending A&E). Models were adjusted for individual-level factors and included a random effect for local authority (LA).
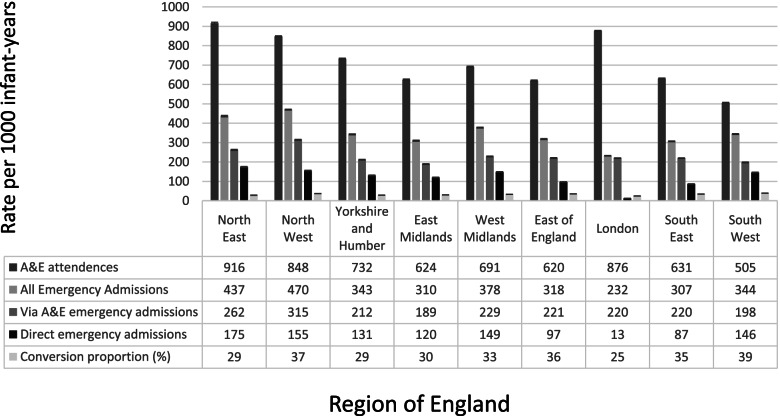
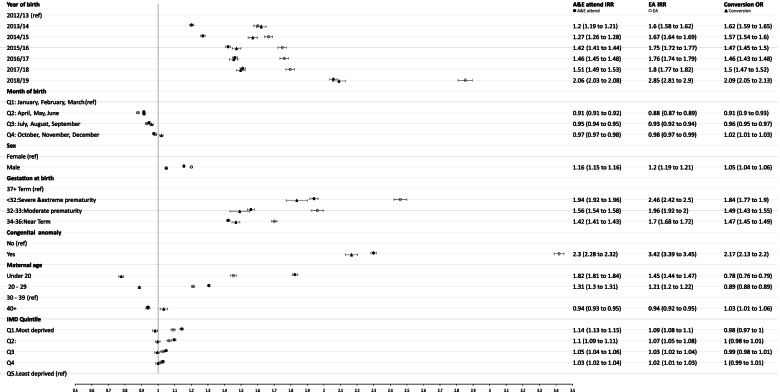
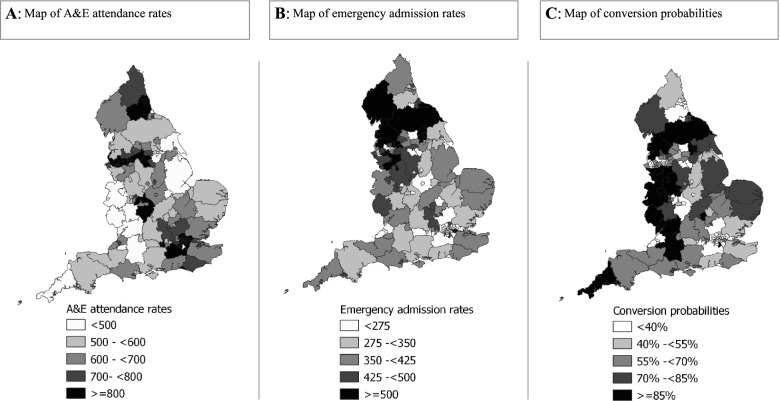
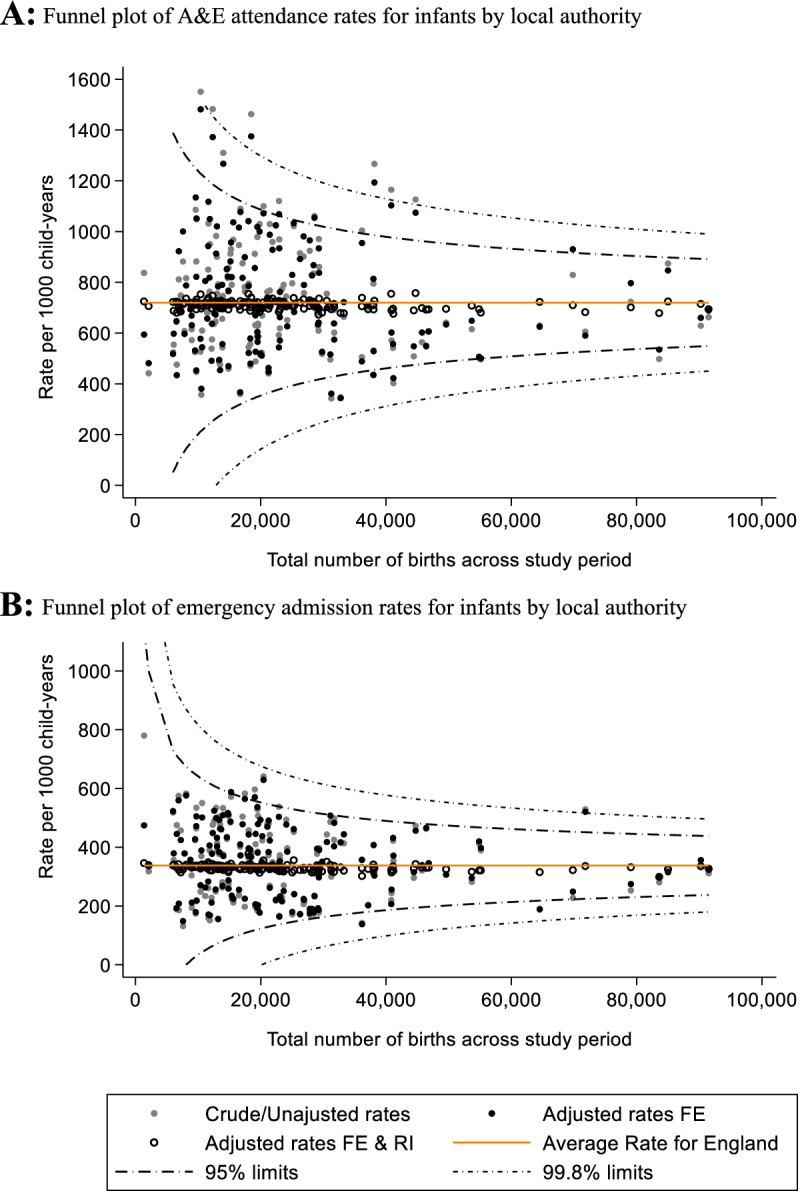
Results: The cohort comprised 3,665,414 births in 150 English LAs. Rates of A&E attendances and emergency admissions were highest amongst: infants born < 32 weeks gestation; with presence of congenital anomaly; and to mothers < 20-years-old. Area-level deprivation was positively associated with A&E attendance rates, but not associated with conversion probability. A&E attendance rates were highest in the North East (916 per 1000 child-years, 95%CI: 911 to 921) and London (876 per 1000, 95%CI: 874 to 879), yet London had the lowest emergency admission rates (232 per 1000, 95%CI: 231 to 234) and conversion probability (25% vs 39% in South West). Adjusting for individual-level factors did not significantly affect variability in A&E attendance and emergency admission rates by local authority.
Conclusions: Drivers of A&E attendances and emergency admissions include individual-level factors such being born premature, with congenital anomaly and from socio-economically disadvantaged young parent families. Support for such vulnerable infants and families should be provided alongside preventative health care in primary and community care settings. The impact of these services requires further investigation. Substantial geographical variations in rates were not explained by individual-level factors. This suggests more detailed understanding of local and underlying service-level factors would provide targets for further research on mechanisms and policy priority.
Keywords: Emergency admissions; Emergency care; Hospital episode statistics; Infant health; Local authority; Variations.
© 2022. The Author(s).
Conflict of interest statement
The authors have declared that no competing interests exist.
Figures
References
-
- Kossarova L, Cheung R, Hargreaves D, Keeble E. Admissions of inequality: emergency hospital use for children and young people London: Nuffield Trust2017 [Available from: https://www.nuffieldtrust.org.uk/files/2017-12/nt-admissions-of-inequali....
-
- Keeble E, Kossarova L. Focus on: Emergency hospital care for children and young people 2017 [Available from: http://allcatsrgrey.org.uk/wp/download/health_services/urgent_and_emerge....
-
- Keeble E, Fisher E. Briefing: Can variation help to explain the rise in emergency admissions for children aged under five up to 2018/19? 2020 [Available from: https://www.nuffieldtrust.org.uk/files/2021-01/under-5-s-summary-report-....
-
- Johnson L, Cornish R, Boyd A, Macleod J. Socio-demographic patterns in hospital admissions and accident and emergency attendances among young people using linkage to NHS Hospital Episode Statistics: results from the Avon Longitudinal Study of Parents and Children. BMC health services research. 2019;19(1):134. doi: 10.1186/s12913-019-3922-7. - DOI - PMC - PubMed
MeSH terms
Grants and funding
LinkOut - more resources
Full Text Sources
Miscellaneous
