. 2022 Jul 22;21(1):151.
doi: 10.1186/s12943-022-01622-9.

E3 ubiquitin ligase MAGI3 degrades c-Myc and acts as a predictor for chemotherapy response in colorectal cancer

Affiliations

E3 ubiquitin ligase MAGI3 degrades c-Myc and acts as a predictor for chemotherapy response in colorectal cancer

Haibo Wang et al. Mol Cancer. .

Abstract

Background: Recurrence and chemoresistance constitute the leading cause of death in colorectal cancer (CRC). Thus, it is of great significance to clarify the underlying mechanisms and identify predictors for tailoring adjuvant chemotherapy to improve the outcome of CRC.

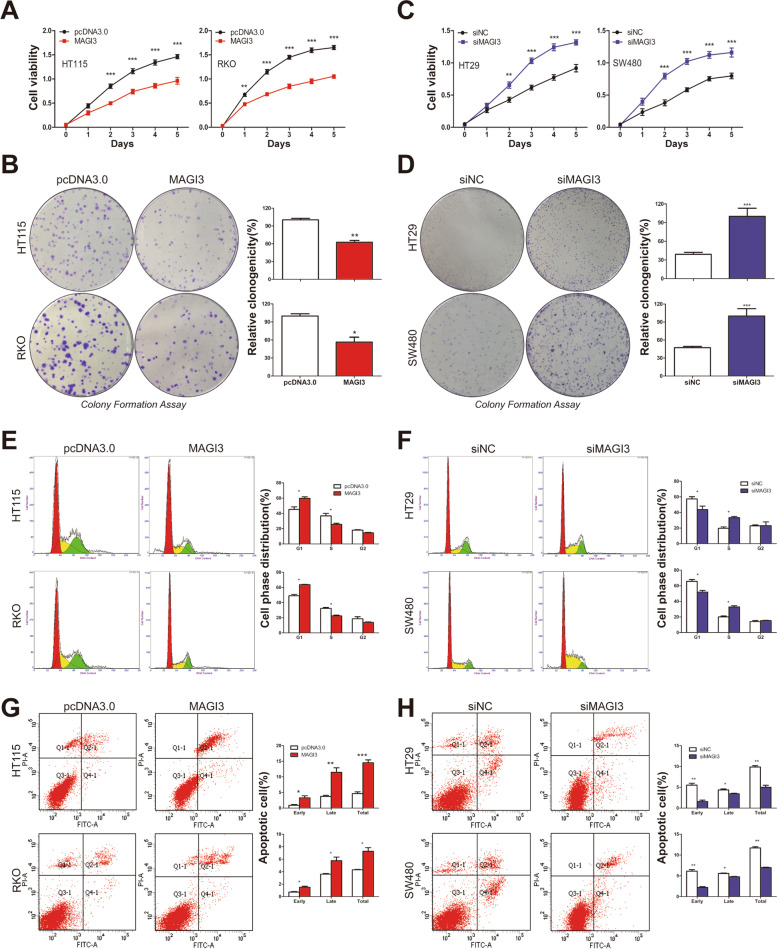
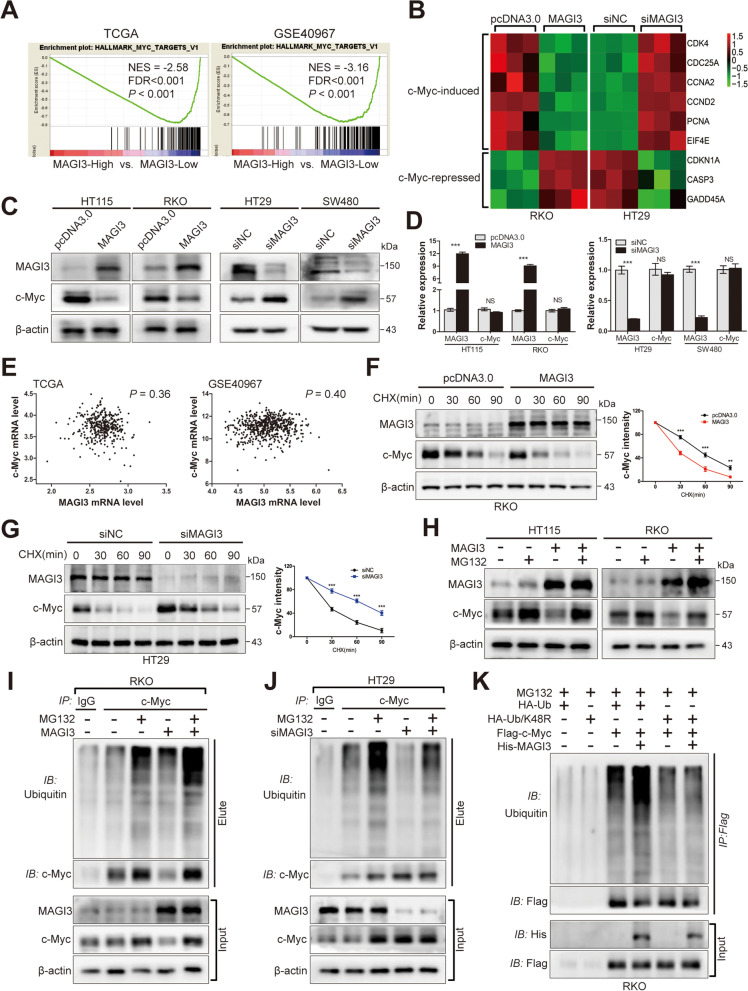
Methods: By screening differentially expressed genes (DEGs), constructing random forest classification and ranking the importance of DEGs, we identified membrane associated guanylate kinase, WW and PDZ domain containing 3 (MAGI3) as an important gene in CRC recurrence. Immunohistochemical and western blot assays were employed to further detect MAGI3 expression in CRC tissues and cell lines. Cell counting kit-8, plate colony formation, flow cytometry, sub-cutaneous injection and azoxymethane plus dextran sulfate sodium induced mice CRC assays were employed to explore the effects of MAGI3 on proliferation, growth, cell cycle, apoptosis, xenograft formation and chemotherapy resistance of CRC. The underlying molecular mechanisms were further investigated through gene set enrichment analysis, quantitative real-time PCR, western blot, co-immunoprecipitation, ubiquitination, GST fusion protein pull-down and immunohistochemical staining assays.

Results: Our results showed that dysregulated low level of MAGI3 was correlated with recurrence and poor prognosis of CRC. MAGI3 was identified as a novel substrate-binding subunit of SKP1-Cullin E3 ligase to recognize c-Myc, and process c-Myc ubiquitination and degradation. Expression of MAGI3 in CRC cells inhibited cell growth, promoted apoptosis and chemosensitivity to fluoropyrimidine-based chemotherapy by suppressing activation of c-Myc in vitro and in vivo. In clinic, the stage II/III CRC patients with MAGI3-high had a significantly good recurrence-free survival (~ 80%, 5-year), and were not necessary for further adjuvant chemotherapy. The patients with MAGI3-medium had a robustly good response rate or recurrence-free survival with fluoropyrimidine-based chemotherapy, and were recommended to undergo fluoropyrimidine-based adjuvant chemotherapy.

Conclusions: MAGI3 is a novel E3 ubiquitin ligase by degradation of c-Myc to regulate CRC development and may act as a potential predictor of adjuvant chemotherapy for CRC patients.

Keywords: Colorectal cancer; Fluoropyrimidine-based systemic chemotherapy; MAGI3; PDZ; Recurrence; c-Myc.


Conflict of interest statement

The authors have declared that no competing interest exists.

Figures

Fig. 1
Fig. 1
MAGI3 expression is downregulated in CRC of primary and recurrence tissues. a, DEGs correlated with CRC carcinogenesis and recurrence. DEGs of tumor vs. adjacent noncancerous tissues, and recurrence vs. non-recurrence tumors in CRC patients from TCGA and GSE40967 were displayed by the volcano plot. The horizontal gray line represented P = 0.01. The vertical gray lines showed 1.5-fold changes in gene expression. Red dots represented upregulated genes and blue dots represented downregulated genes. b, MAGI3 was one of 17 DEGs identified in 2 independent datasets. The UpSetVenny diagram showed the 17 overlapped DEGs, and the importance of MAGI3 ranked the top one in these DEGs by random forest classifier models analysis. c, The protein level of MAGI3 was also robustly reduced in CRC and recurrence specimens. Representative images of MAGI3 IHC staining in adjacent tissues (top), non-recurrence tumors (middle) and recurrence tumors (bottom) of CRC. Scale bars: 50 μm. Right panels are × 2 magnification of the dashed areas on the left. Dot plot showing the corresponding quantification of MAGI3 H-score. Data were presented as the mean ± SEM, and statistical significance was calculated by Mann–Whitney test. ***P < 0.001. d, patients with low MAGI3 protein had a worse OS and RFS. Kaplan–Meier curves showing comparison of the OS (left) and RFS (right) between MAGI3-low and -high expression groups of CRC patients (P < 0.01, calculated by log-rank test). e, MAGI3 was a potential predictor of postoperative recurrence in CRC patients. The receiver operating characteristic curve with serum carcinoembryonic antigen value (left) and MAGI3 in CRC specimens H-score (right)
Fig. 2
Fig. 2
MAGI3 inhibits cell growth and induces cell cycle arrest and apoptosis in CRC cells. a and b, Overexpression of MAGI3 significantly inhibited CRC cell proliferation. Cell proliferation of HT115 or RKO cells, transfected with MAGI3 or pcDNA3.0, were assessed by CCK-8 (a) or colony formation assays (b). c and d, Knockdown of MAGI3 expression significantly enhanced CRC cell proliferation. Cell proliferation of HT29 or SW480 cells, transfected with siMAGI3 or siNC, were assessed by CCK-8 (c) or colony formation assays (d). e and f, MAGI3 induced cell cycle arrest. Flow cytometry assay showed that overexpression of MAGI3 induced cell cycle arrest at G1–S transition (e) and knockdown of MAGI3 promoted cell cycle progression (f). g and h, MAGI3 induced cell apoptosis. Flow cytometry assay showed that overexpression of MAGI3 induced CRC cell apoptosis (g) and knockdown of MAGI3 reduced CRC cell apoptosis (h). Q2-1 shows the late apoptotic cells and Q4-1 shows the early apoptotic cells. Data were presented as the mean ± SEM, 2-way repeated-measures ANOVA with Bonferroni post-test (a and c), 2-tailed, unpaired t test (b, d, eh) were used to determine statistical significance. *P < 0.05, **P < 0.01, and ***P < 0.001. These experiments (a-h) were repeated three times independently
Fig. 3
Fig. 3
MAGI3 regulates c-Myc activation through degradation of c-Myc by the ubiquitin pathway. a, Enrichment plots of GSEA showed that the gene signatures of c-Myc targets were significantly enriched in low MAGI3 expression CRC specimens. b, MAGI3 inhibited c-Myc transcriptional target genes expression. Heatmap of c-Myc target genes expression modulated by MAGI3 in RKO or HT29 cells (three independent experiments). c, Overexpression of MAGI3 decreased, whereas knockdown of MAGI3 increased the protein levels of c-Myc. c-Myc protein levels were detected by western blot in HT115 or RKO cells over-expressed MAGI3 (left), and in HT29 or SW480 cells silenced MAGI3 (right). d, MAGI3 had no detectable effect on the c-Myc expression at mRNA level. qPCR analysis of the c-Myc mRNA expression in RKO or HT29 cells with the indicated MAGI3 modulation, three independent experiments, data were presented as the mean ± SEM, a 2-tailed, unpaired t test was used to determine statistical significance. ***P < 0.001, NS, no significance. e, MAGI3 and c-Myc had no correlation (by Pearson’s) at transcriptional level in CRC specimens from TCGA (left, n = 375) and GSE40967 (right, n = 566). f and g, Overexpression of MAGI3 decreased, whereas knockdown of MAGI3 prolonged the half-life of c-Myc. The effect of MAGI3 on the half-life of c-Myc were detected by western blot in CRC cells treated with CHX. The protein half-life curves were obtained by quantifying three independent experiments (right). h, MAGI3 regulated c-Myc turn over through proteasome pathway. The levels of c-Myc protein were detected by western blot in CRC cells transfected with MAGI3 and treated with MG132 (10 μM) for 6 h before harvesting. i and j, Overexpression of MAGI3 promoted, whereas knockdown of MAGI3 inhibited c-Myc ubiquitin. Ubiquitination assays of c-Myc in lysates from RKO or HT29 cells with the indicated MAGI3 manipulation. k, MAGI3 regulated c-Myc ubiquitin in Lys48-linked poly-ubiquitination. Ubiquitination assays of c-Myc in RKO cells transfected with HA-Ub or HA-Ub/K48R
Fig. 4
Fig. 4
MAGI3 is a substrate-binding subunit of SKP1-Cullin E3 ligase to recognize c-Myc. a and b, MAGI3 was interacted with c-Myc. a, The cell lysates of CRC cells were immunopreciptated with anti-c-Myc antibodies, and MAGI3 was determined in the Co-IP by western blot. b, The reciprocal Co-IP was performed to detected the association of MAGI3 with c-Myc in HEK293 cells. c, The fifth PDZ domain of MAGI3 directly bound with the c-Myc. The individual His-PDZ domains of MAGI3 were pulled down with GST-c-Myc fusion proteins. The schematic representation of five PDZ domains of MAGI3 (bottom). d, The PBM in c-Myc was essential for the interaction of c-Myc with MAGI3. His-PDZ5 domain of MAGI3 was pulled with GST-c-Myc wild-type (GST-c-Myc-wt) or its deletion of PBM (GST-c-Myc-Δct). e, The interaction of MAGI3 with c-Myc was essential for MAGI3 regulation of c-Myc ubiquitination. Ubiquitination of c-Myc-wt or c-Myc-∆ct in RKO cells with the indicated MAGI3 manipulation were detected. Cells were treated with MG132 (10 μM) before harvesting. f, SKP1 is required for c-Myc ubiquitination and degradation caused by MAGI3 overexpression. Ubiquitination of c-Myc in RKO cell was detected after SKP1 and F-box proteins were silenced with the indicated siRNAs. g, MAGI3 interacted with c-Myc, SKP1 and CUL1 in RKO cell. The cell lysates of RKO-MAGI3 cell were immunopreciptated with anti-MAGI3 antibodies, and c-Myc, SKP1 and CUL1 were determined in CoIP complex by western blot. h, The second PDZ domain of MAGI3 directly bound with SKP1. The individual His-PDZ domains of MAGI3 were pulled with GST-SKP1 fusion proteins. i, Schematic representation showing the proposed mechanism of MAGI3 in the regulation of c-Myc ubiquitination and degradation. As a mediator, MAGI3 links c-Myc with SKP1, promotes the ubiquitination of c-Myc and its degradation through proteasome pathway
Fig. 5
Fig. 5
Suppression of CRC progression in vitro and in vivo by MAGI3 is dependent on c-Myc. a, To overexpression c-Myc in CRC-MAGI3 cells by exogenous transfection of c-Myc. c-Myc was overexpressed in HT115-MAGI3 or RKO-MAGI3 cells by transfected with c-Myc constructs. b, MAGI3 had less effect on the CRC cells proliferation when c-Myc protein levels were overexpressed. Cell viability of HT115 and RKO cells by CCK-8 assay. ***P < 0.001 vs. pcDNA3.0 + Vector; ###P < 0.001 vs. MAGI3 + Vector. c, Overexpressed c-Myc effectively restricted MAGI3-inhibition of colony formation of CRC cells. d, MAGI3 overexpression inhibited the growth of RKO xenografts in nude mice. Representative images of tumors from the implanted mice (left). The volume and weight of tumors were significantly decreased in MAGI3 overexpressed RKO xenograft tumors (middle and right). e, MAGI3 overexpression correlated with the reduced the expression of c-Myc in RKO xenografts. Representative IHC staining of MAGI3 and c-Myc in xenografted tumor. Scale bars: 50 μm. Dot plot (right) showed the corresponding quantification of MAGI3 or c-Myc H-score. f, Protein levels of MAGI3 were reduced coordinately with c-Myc increase in AOM/DSS induced CRC. Images of AOM/DSS induced CRC (top). The protein levels of MAGI3 and c-Myc in colorectal tumor (T) and matched surrounding tissues (S) were detected by western blot (bottom). Data were presented as the mean ± SEM. Statistical significance was determined by 2-way ANOVA with Bonferroni post-tests (b and d-middle), 2-tailed, unpaired t test (c and d-right) and Mann–Whitney test (e). *P < 0.05, **P < 0.01, ***P < 0.001
Fig. 6
Fig. 6
MAGI3 is negatively associated with c-Myc in CRC specimens and multiple carcinomas. a, The negative correlation of MAGI3 and c-Myc protein levels in clinical CRC specimens. Representative IHC staining of MAGI3 and c-Myc in 108 cases of CRC samples. Scale bars: 50 μm. Right panels are × 2 magnification of the dashed areas on the left. b, Pearson correlation analysis between MAGI3 and c-Myc in 108 cases of CRC samples. c, MAGI3 level negatively correlated with c-Myc activation in CRC patients. MAGI3 expression level was measured by RNA-Seq in 375 CRC samples from TCGA. Gene signature of c-Myc activation was defined as gene sets, DANG REGULATED BY MYC UP (the gene signature of c-Myc positive activation) and DANG REGULATED BY MYC DN (the gene signature of c-Myc negative activation) from the Molecular Signatures Database. The First Principal Component (PC1) of the c-Myc positive signature was negatively correlated with MAGI3 expression (left); while the PC1 of c-Myc negative signature was positively correlated with MAGI3 expression (right) (Pearson correlation). d, Enrichment plots of GSEA showed that the gene signatures of c-Myc positive activation were significantly enriched in low MAGI3 expression groups in esophageal squamous cell carcinoma (ESCA), head and neck squamous cell carcinoma (HNSC), kidney renal clear cell carcinoma (KIRC), lung adenocarcinoma (LUAD), lung squamous cell carcinoma (LUSC) and thyroid carcinoma (THCA)
Fig. 7
Fig. 7
Loss of MAGI3 reduces sensitivity of chemotherapy by upregulation of c-Myc activation in CRC patients. a and b, Overexpression of MAGI3 increased, whereas knockdown of MAGI3 reduced CRC cells chemosensitivity to 5-FU or OXA. CRC cells with MAGI3 overexpressed (a) or knocked down (b) were treated with 5-FU or OXA in different concentrations for 48 h, and the cells viability were measured by CCK-8 assays (three independent experiments). c, The result of chi-square test showed that the patients with high MAGI3 mRNA level had high response ratio to chemotherapy. d, Scatter plots of MAGI3 mRNA expression in patients with NR and R. e and f, Enrichment plots of GSEA showed that the gene signatures of cell proliferation (e), c-Myc positive activation (f, left) were enriched in NR group and c-Myc negative regulated pathway (f, right) was enriched in R group. g, Scatter plots of c-Myc mRNA expression in patients with NR and R. h, KM survival curve indicated that among the patients from TCGA without adjuvant chemotherapy, those with high MAGI3 mRNA level had a better RFS than those with medium/low MAGI3 (log-rank test). i, The fisher exact test showed that among the patients receiving adjuvant chemotherapy, those with relatively medium MAGI3 mRNA level (602 ~ 486) had significantly high response rate to fluoropyrimidine-based chemotherapy than those with relatively low MAGI3 (388 ~ 196). j, KM survival curve showed that among the patients from Shanxi Medical University without adjuvant chemotherapy, those with high MAGI3 protein level (H-score ≥ 8) had a better RFS than those with medium/low MAGI3 (H-score < 8). k, KM survival curve showed that among the patients receiving adjuvant chemotherapy, those with medium MAGI3 protein (H-score 4 ~ 8) had a better RFS than the patients with low MAGI3 (H-score 1 ~ 3). Data were presented as the mean ± SEM, 2-way repeated-measures ANOVA with Bonferroni post-test (a and b), the chi-square test (c), nonparametric Mann–Whitney test (d and g), fisher exact test with 1-sided (i) were used to determine statistical significance. *P < 0.05, **P < 0.01, ***P < 0.001 and NS, no significance

Similar articles

Cited by

References

    1. Bray F, Ferlay J, Soerjomataram I, Siegel RL, Torre LA, Jemal A. Global cancer statistics 2018: GLOBOCAN estimates of incidence and mortality worldwide for 36 cancers in 185 countries. CA Cancer J Clin. 2018;68:394–424. - PubMed
    1. Johnston PG, Stage II. Colorectal cancer: to treat or not to treat. Oncologist. 2005;10:332–334. doi: 10.1634/theoncologist.10-5-332. - DOI - PubMed
    1. Al BBI, Schrag D, Somerfield MR, Cohen AM, Figueredo AT, Flynn PJ, Krzyzanowska MK, Maroun J, McAllister P, Cutsem EV, et al. American society of clinical oncology recommendations on adjuvant chemotherapy for stage ii colon cancer. J Clin Oncol. 2004;22:3408–3419. doi: 10.1200/JCO.2004.05.063. - DOI - PubMed
    1. Messersmith WA. Systemic management of colorectal cancer. J Natl Compr Canc Ne. 2017;15:699–702. doi: 10.6004/jnccn.2017.0077. - DOI - PubMed
    1. Bockelman C, Engelmann BE, Kaprio T, Hansen TF, Glimelius B. Risk of recurrence in patients with colon cancer stage II and III: a systematic review and meta-analysis of recent literature. Acta Oncol. 2015;54:5–16. doi: 10.3109/0284186X.2014.975839. - DOI - PubMed

Publication types

MeSH terms

Substances