. 2022 Jul 21;41(1):228.
doi: 10.1186/s13046-022-02438-7.

Dysregulation and prometastatic function of glycosyltransferase C1GALT1 modulated by cHP1BP3/ miR-1-3p axis in bladder cancer

Affiliations

Dysregulation and prometastatic function of glycosyltransferase C1GALT1 modulated by cHP1BP3/ miR-1-3p axis in bladder cancer

Zengqi Tan et al. J Exp Clin Cancer Res. .

Abstract

Background: Abnormal glycosylation in a variety of cancer types is involved in tumor progression and chemoresistance. Glycosyltransferase C1GALT1, the key enzyme in conversion of Tn antigen to T antigen, is involved in both physiological and pathological conditions. However, the mechanisms of C1GALT1 in enhancing oncogenic phenotypes and its regulatory effects via non-coding RNA are unclear.

Methods: Abnormal expression of C1GALT1 and its products T antigen in human bladder cancer (BLCA) were evaluated with BLCA tissue, plasma samples and cell lines. Effects of C1GALT1 on migratory ability and proliferation were assessed in YTS-1 cells by transwell, CCK8 and colony formation assay in vitro and by mouse subcutaneous xenograft and trans-splenic metastasis models in vivo. Dysregulated circular RNAs (circRNAs) and microRNAs (miRNAs) were profiled in 3 pairs of bladder cancer tissues by RNA-seq. Effects of miR-1-3p and cHP1BP3 (circRNA derived from HP1BP3) on modulating C1GALT1 expression were investigated by target prediction program, correlation analysis and luciferase reporter assay. Functional roles of miR-1-3p and cHP1BP3 on migratory ability and proliferation in BLCA were also investigated by in vitro and in vivo experiments. Additionally, glycoproteomic analysis was employed to identify the target glycoproteins of C1GALT1.

Results: In this study, we demonstrated upregulation of C1GALT1 and its product T antigen in BLCA. C1GALT1 silencing suppressed migratory ability and proliferation of BLCA YTS-1 cells in vitro and in vivo. Subsets of circRNAs and miRNAs were dysregulated in BLCA tissues. miR-1-3p, which is reduced in BLCA tissues, inhibited transcription of C1GALT1 by binding directly to its 3'-untranslated region (3'-UTR). miR-1-3p overexpression resulted in decreased migratory ability and proliferation of YTS-1 cells. cHP1BP3 was upregulated in BLCA tissues, and served as an miR-1-3p "sponge". cHP1BP3 was shown to modulate migratory ability, proliferation, and colony formation of YTS-1 cells, and displayed tumor-suppressing activity in BLCA. Target glycoproteins of C1GALT1, including integrins and MUC16, were identified.

Conclusions: This study reveals the pro-metastatic and proliferative function of upregulated glycosyltransferase C1GLAT1, and provides preliminary data on mechanisms underlying dysregulation of C1GALT1 via miR-1-3p / cHP1BP3 axis in BLCA.

Keywords: Bladder cancer; C1GALT1; cHP1BP3; circRNA; miR-1-3p.


Conflict of interest statement

The authors declare no conflict of interest, or competing financial interest.

Figures
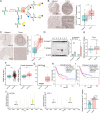
Fig. 1
Fig. 1
Expression of C1GALT1 and T antigen in BLCA. A T antigen production by C1GALT1. B, C Differential C1GALT1 expression (B) and T antigen levels (C) in BLCA, by TMA analysis. Representative immunohistochemical results for paired clinical tissues are shown. ***, p < 0.001. D Representative western and lectin blotting results for C1GALT1 and T antigen levels in BLCA (T) and adjacent normal (A) tissues. *p < 0.05; ***, p < 0.001. E T antigen levels in BLCA patient sera, by ELISA. *, p < 0.05. F mRNA expression of C1GALT1 in paired and unpaired BLCA and adjacent normal tissues in TCGA database. **, p < 0.01. G mRNA expression of C1GALT1 in BLCA patients from GSE27448 series. **, p < 0.01. H, I Overall (H) and disease-free survival (I) of dichotomized C1GALT1 mRNA expression in BLCA patients in TCGA database, using GEPIA platform. J Left: representative ESI-MS/MS spectra of O-glycan structures in HCV29 and YTS-1 cells. Right: relative abundance of T-antigen in normal epithelial bladder cells HUC-1 and HCV-29 vs. in bladder cancer cells KK47, T24 and YTS-1
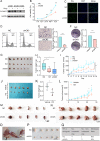
Fig. 2
Fig. 2
Effects of C1GALT1 on malignant behavior of BLCA cells. A C1GALT1 expression in C1GALT1-silenced YTS-1 cells (termed shC#1–3) with/without Doxy treatment. B-D Proliferation of C1GALT1-silenced YTS-1 vs. control cells by CCK8 (B) and Edu assay (C, D). ***, p < 0.001. E, F Migratory ability (E) and colony formation (F) of C1GALT1-silenced YTS-1 vs. control cells. ***, p < 0.001. G-I Tumor size (G), weight (H), and volume (I) for mice injected with C1GALT1-silenced, ITZ-treated, and control YTS-1 cells (n = 7). *, p < 0.05; **, p < 0.01; ***, p < 0.001. J-L Tumor size (J), weight (K) and volume (L) for PDXs with/without ITZ treatment. M, N Microphotographs of splenic (M) and liver metastatic tumors (N). O A popliteal lymphatic metastasis model was established by inoculating the foot pads of nude mice with YTS-1 cells. P, Q Size of LNs (P) and metastasis ratios (Q) of popliteal lymphatic metastasis mouse model
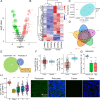
Fig. 3
Fig. 3
Identification of miRNAs in BLCA tissues by RNA-seq analysis. A Volcano plot of expression patterns of identified miRNAs in three pairs of BLCA tissues. -log10 (p-value) is plotted against log2 (fold change: BLCA vs. adjacent normal tissues) using cutoffs of fold change > 2, fold change < 0.5, and p-value < 0.05. Green, downregulation; red, upregulation. B Expression pattern of DemiRs identified in three pairs of BLCA tissues. Rows: miRNAs; columns: tissues. Red, upregulation; blue, downregulation. C PCA plot of DEmiRs. Green dots, BLCA tissues; red dots, adjacent normal tissues. D Venn diagram of predicted C1GALT1-targeting miRNAs by TargetScan, PITA, PicTar, miRanda, and miRmap. E Venn diagram of identified downregulated miRNAs and predicted C1GALT1-targeting miRNAs. F miR-1-3p and miR-152-3p expression in BLCA patients, from TCGA database. ***, p < 0.001. G miR-1-3p expression in low- and high-grade BLCA patients from GSE40355 series. ***, p < 0.001. H miR-1-3p expression in BLCA patients with stages I-IV, from TCGA database. ***, p < 0.001. I FISH analysis of miR-1-3p in BLCA and adjacent normal tissues. Nuclei were stained with DAPI, and miR-1-3p was stained with FITC-labeled probe
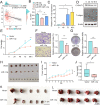
Fig. 4
Fig. 4
Effects of miR-1-3p on malignant behavior of BLCA cells. A Correlation analysis of miR-1-3p and C1GALT1 mRNA expression in BLCA patients, from TCGA database. B Confirmation of miR-1-3p-binding sites on 3′-UTR of C1GALT1 detected by luciferase reporter assay. Control miRNA or miR-1-3p mimics were co-transfected with luciferase reporters containing wild-type or mutated 3′-UTRs. **, p < 0.01. C, D miR-1-3p (C), C1GALT1 expression, and T antigen levels (D) in miR-1-3p-overexpressing YTS-1 cells with Doxy treatment. *, p < 0.05. E-G Proliferation (E), migratory ability (F), and colony formation (G) of miR-1-3p-overexpressing YTS-1 vs. control cells. ***, p < 0.001. H-J Tumor size (H), volume (I), and weight (J) at wk. 3 after s.c. injection of miR-1-3p-overexpressing YTS-1 cells (n = 7). *, p < 0.05; **, p < 0.01. K, L Microphotographs of splenic (K) and liver metastatic tumors (L)
Fig. 5
Fig. 5
Identification of circRNAs in BLCA tissues by RNA-seq analysis. A Overlap of circRNAs identified in this study and in circBank. B Genomic origin or identified circRNAs in BLCA tissues. C Length distribution of exonic circRNAs. D Heatmap of DEcircRs in three pairs of BLCA tissues. Rows: circRNAs; columns: tissues. Red, upregulation; blue, downregulation. E PCA plot of DEcircRs. Green dots, BLCA tissues; red dots, adjacent normal tissues. F Representative PCR confirmation of predicted circRNA backsplice junctions using divergent primers and host genes for circRNA, and convergent primers for cDNA and genomic DNA. G Confirmation of circRNA (cHP1BP3) backsplice junctions by Sanger sequencing. H RNase R resistance of circRNAs and GAPDH mRNA. ***, p < 0.001
Fig. 6
Fig. 6
Effects of cHP1BP3 on malignant behavior of BLCA cells. A Venn diagram of predicted circRNAs acting as miR-1-3p sponges, from miRanda, RNAhybrid, and TargetScan databases. B Venn diagram of identified upregulated circRNAs and predicted circRNAs acting as miR-1-3p sponges. C RT-qPCR analysis of circRNA levels in streptavidin-captured fractions from YTS-1 cell lysates following transfection with 3′-end biotinylated miR-1-3p or control RNA (NC). **, p < 0.01. D Confirmation by luciferase reporter assay of miR-1-3p-binding sites on circRNAs. Control miRNA or miR-1-3p mimics were co-transfected with luciferase reporters containing predicted miR-1-3p binding sites. *, p < 0.05; **, p < 0.01; ***, p < 0.001. E Luciferase activity of luciferase-cHP1BP3 or its mutant in HEK293 cells following co-transfection with miR-1-3p. ***, p < 0.001. F Stability of cHP1BP3 following 24 h transcription blocking by actinomycin D (ActD) treatment, by RT-qPCR analysis. G Expression of cHP1BP3 amplified with random hexamer or oligo (dT)18 primers, by RT-qPCR. **, p < 0.01. H cHP1BP3 expression in BLCA and adjacent normal tissues. I-K Proliferation (I), migratory ability (J), and colony formation (K) of cHP1BP3-silenced YTS-1 vs. control cells. *, p < 0.05; **, p < 0.01; ***, p < 0.001. L-N Tumor size (L), volume (M), and weight (N) at wk. 3 after s.c. injection of cHP1PB3-silenced YTS-1 cells (n = 7). **, p < 0.01; ***, p < 0.001. O, P Microphotographs of splenic (O) and liver metastatic tumors (P)
Fig. 7
Fig. 7
Identification of T antigen-bearing glycoproteins. A Glycoproteomic analysis by combination of PNA enrichment and LC-MS/MS (schematic). B PCA plot of identified glycoproteins. Green dots, C1GALT1-silenced YTS-1 cells; red dots, control cells. C GO enrichment analysis of identified glycoproteins. D Protein-protein interaction network of glycoproteins, by Cytoscape software program. E Heatmap showing expression patterns of glycoproteins identified in C1GALT1-silenced and parental YTS-1 cells. Red, upregulation; blue, downregulation. *, p < 0.05; **, p < 0.01; ***, p < 0.001; ns, not significant. F MUC16 expression and T antigen levels on MUC16 in control and C1GALT1-silenced YTS-1 cells. G MUC16 expression in control and C1GALT1-silenced YTS-1 cells treated with CHX. H MUC16 expression in MUC16-silenced YTS-1 cells by siRNA. I, J Proliferation (I) and migratory ability (J) of MUC16-silenced YTS-1 vs. control cells
Fig. 8
Fig. 8
Proposed prometastatic function of C1GALT1 and its modulation by cHP1BP3/ miR-1-3p axis (schematic)

Similar articles

Cited by

References

    1. Varki A. Evolutionary forces shaping the Golgi glycosylation machinery: why cell surface glycans are universal to living cells. Cold Spring Harb Perspect Biol. 2011;3(6):a005462. doi: 10.1101/cshperspect.a005462. - DOI - PMC - PubMed
    1. Tran DT, Ten Hagen KG. Mucin-type O-glycosylation during development. J Biol Chem. 2013;288(10):6921–6929. doi: 10.1074/jbc.R112.418558. - DOI - PMC - PubMed
    1. Giovannone N, Antonopoulos A, Liang J, Geddes Sweeney J, Kudelka MR, King SL, et al. Human B cell differentiation is characterized by progressive remodeling of O-linked glycans. Front Immunol. 2018;9:2857. doi: 10.3389/fimmu.2018.02857. - DOI - PMC - PubMed
    1. Cornelissen LA, Van Vliet SJ. A bitter sweet symphony: immune responses to altered O-glycan epitopes in cancer. Biomolecules. 2016;6(2):26. doi: 10.3390/biom6020026. - DOI - PMC - PubMed
    1. Jiang Y, Liu Z, Xu F, Dong X, Cheng Y, Hu Y, et al. Aberrant O-glycosylation contributes to tumorigenesis in human colorectal cancer. J Cell Mol Med. 2018;22(10):4875–4885. doi: 10.1111/jcmm.13752. - DOI - PMC - PubMed