. 2022 Jul 4;18(11):4372-4387.
doi: 10.7150/ijbs.72397. eCollection 2022.

DNMT3B-mediated FAM111B methylation promotes papillary thyroid tumor glycolysis, growth and metastasis

Affiliations

DNMT3B-mediated FAM111B methylation promotes papillary thyroid tumor glycolysis, growth and metastasis

Xiang Zhu et al. Int J Biol Sci. .

Abstract

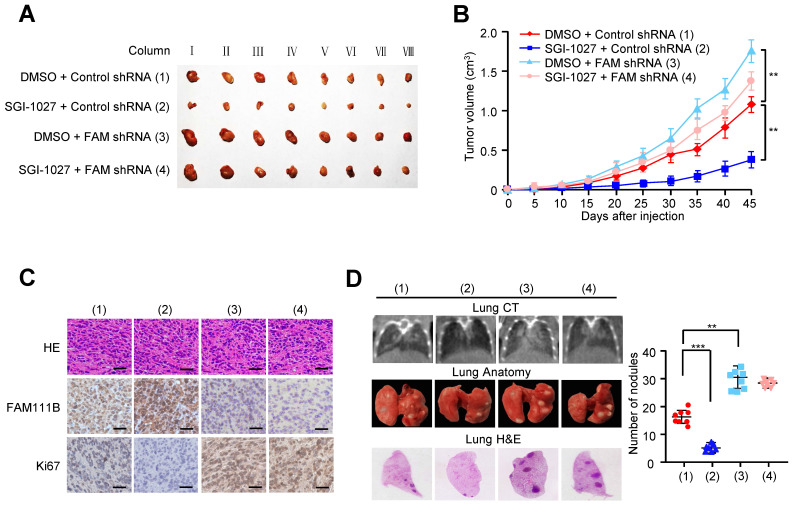
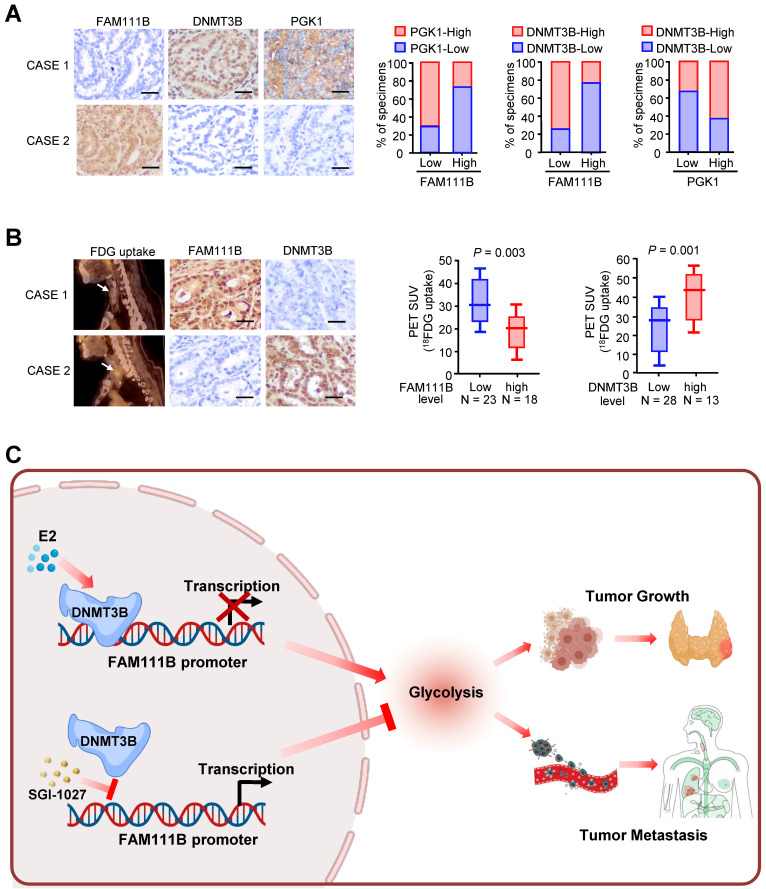
Over the past decades, the incidence of thyroid cancer (TC) rapidly increased all over the world, with the papillary thyroid cancer (PTC) accounting for the vast majority of TC cases. It is crucial to investigate novel diagnostic and therapeutic targets for PTC and explore more detailed molecular mechanisms in the carcinogenesis and progression of PTC. Based on the TCGA and GEO databases, FAM111B is downregulated in PTC tissues and predicts better prognosis in PTC patients. FAM111B suppresses the growth, migration, invasion and glycolysis of PTC both in vitro and in vivo. Furthermore, estrogen inhibits FAM111B expression by DNMT3B methylation via enhancing the recruitment of DNMT3B to FAM111B promoter. DNMT3B-mediated FAM111B methylation accelerates the growth, migration, invasion and glycolysis of PTC cells. In clinical TC patient specimens, the expression of FAM111B is inversely correlated with the expressions of DNMT3B and the glycolytic gene PGK1. Besides, the expression of FAM111B is inversely correlated while DNMT3B is positively correlated with glucose uptake in PTC patients. Our work established E2/DNMT3B/FAM111B as a crucial axis in regulating the growth and progression of PTC. Suppression of DNMT3B or promotion of FAM111B will be potential promising strategies in the estrogen induced PTC.

Keywords: DNMT3B; Estrogen; FAM111B; Glycolysis; Papillary thyroid cancer.


Conflict of interest statement

Competing Interests: The authors have declared that no competing interest exists.

Figures

Figure 1
Figure 1
FAM111B is selected as one of the most significantly expressed genes in PTC tissues and predicts better prognosis in PTC patients. (A) Flow chart displaying the screening strategy for crucial genes in PTC. (B) DEGs between normal and tumor tissues from GSE151179 dataset shown in the volcano plot. Downregulated and upregulated genes were displayed in green and red, respectively. Values were demonstrated as log2 of tag counts. A total of 25192 genes, of which 1992 were upregulated and 1768 were down-regulated genes displayed in the pie chart. All statistically significant DEGs were demonstrated in the hierarchical cluster analysis diagram. (C) Paired GSE151179 and THCA DEGs expression analyzed as in (B). (D) Paired THCA expression analyzed as in (B). (E) Venn analysis of the DEGs according to the strategy. The DEGs in each screening strategy were represented as three circles, and the intersection of the results was represented as the middle part. (F) The difference in OS between patients with high and low expression of FAM111B in PTC from TCGA database by Kaplan Meier analysis. Censored samples were represented by marks on graph lines.
Figure 2
Figure 2
FAM111B suppresses PTC growth, migration and invasion in vitro and in vivo. (A, B) TPC-1 cells and B-CPAP cells were transfected with control siRNA, FAM111B siRNAs or FAM111B siRNAs plus FAM111B. Western blot analysis was used to detect the expression level of FAM111B protein. The cell proliferation was determined by the CCK-8 assay at 450 nm (OD450) with a microplate reader. (C, D) Representative images indicates the colonies in plates (upper panels). The histogram indicates the colony number. (E, F) Wound healing assay of TPC-1 cells and B-CPAP cells transfected as in (A, B). Representative histograms indicate relative cell migration. (G, H) Transwell assays of TPC-1 cells and B-CPAP cells transfected as in (A, B). Representative histograms indicate relative cell invasion. All values displayed are mean ± SD and have been duplicated 3 times with similar results (A-H). *p < 0.05 and **p < 0.01 versus corresponding Control siRNA. (I) TPC-1 cells stably infected with lentivirus carrying the indicated constructs were injected into nude mice (n = 7 per group) as indicated. After 45 days, mice were sacrificed to harvest tumors. At the indicated times, tumors were measured (mean ± SD, n = 7), and the growth curve was plotted. The representative immunoblot indicates the FAM111B expression and the histogram displays the production of lactate. (J) TPC-1 cells expressing the indicated constructs were injected through the tail vein to build a PTC cell metastasis model in nude mice (n = 8 per group). Lung CT scan of groups were performed and representative metastatic foci of lungs were subjected to anatomical and histological analyses. *p < 0.05 and **p < 0.01 vs. control shRNA group. Scale bar, 50 μm.
Figure 3
Figure 3
FAM111B inhibits glycolysis in PTC cells in vitro and in vivo. (A) GSEA plot showing that FAM111B expression is positively correlated with Warburg effect signaling in the TCGA THCA dataset. (B) Correlation between FAM111B and glycolysis genes in PTC patients of TCGA was valued. (C) The mRNA expression of glycolytic genes (PFKP, HK2, GAPDH, ALDOA, ENO1, PFKL, PGM1, PKM, LDHA, PGK1, PGAM1, PGM2, PFKM) in TPC-1 cells with control siRNA or FAM111B siRNAs or FAM111B siRNAs plus FAM-R. (D, E) TPC-1 and B-CPAP cells were transfected with control siRNA or FAM111B siRNAs or FAM111B siRNAs plus FAM-R respectively. Glucose uptake, lactate production and ATP production were measured. Typical immunoblot indicates the expression of FAM111B. (F, G) TPC-1 cells (F) and B-CPAP cells (G) were transfected as in (D), and the extracellular acidification rate (ECAR) and oxygen consumption rate (OCR) were then evaluated. The arrows indicate the time of adding glucose, oligomycin, 2-DG, oligomycin, FCCP and rotenone and antimycin A (Rot/AA). All values shown are mean ± S.D. of triplicate measurements and have been repeated 3 times with similar results (d-g). *p < 0.05, **p < 0.01, ***p < 0.001 vs. Control siRNA group. (H)18F-FDG PET scan performed before sacrifice of mice in each group (n = 6 per group). The activity of tumor to blood was measured in each group. **p < 0.01 versus Control shRNA group.
Figure 4
Figure 4
Estrogen inhibits FAM111B expression by DNMT3B methylation via enhancing the recruitment of DNMT3B to FAM111B promoter. (A) Western blot analysis of TPC-1 and B-CPAP cells with E2 at different times (0 h, 0.5 h, 2 h, 6 h) were performed. The representative immunoblot shows the expression of FAM111B. Lower panels show the relative levels of FAM111B protein density. (B) Schematic of the CpG islands in the FAM111B promoter. Input sequence: red region; CpG islands: blue region; cg02404739: the CG sites in the FAM111B CpG islands, identified using the TCGA dataset. (C) The relationship between cg02404739 methylation levels and FAM111B expression was assessed using Spearman's rank correlation analysis. Symbols represent individual samples. (D) Kaplan-Meier analysis of the correlation between the cg02404739 levels and overall survival of PTC patients with high (n = 203) and low (n = 303) cg02404739 expression in the TCGA cohort. (E) ChIP analysis of DNA methylases occupancy on the FAM111B promoter or upstream of the promoter in TPC-1 cells treated with E2 or not. **p < 0.01 versus E2 absent group. (F) Immunoblot analysis of FAM111B protein levels in the TPC-1 cells transfected with DNMT3B siRNAs or treated with SGI-1027. Upper panels show the relative levels of FAM111B protein density. (G) qRT-PCR analysis of FAM111B mRNA and immunoblot analysis of FAM111B protein in the TPC-1 cells transfected with DNMT3B siRNAs or treated with or without SGI-1027 exposed to E2 or not. Lower panels show the relative levels of FAM111B protein density. The triplicate measurement results were repeated 3 times and the results were similar. *p < 0.05, **p < 0.01, ***p < 0.001 versus the corresponding control group.
Figure 5
Figure 5
Methylation of FAM111B by DNMT3B promotes the growth, migration, invasion and glycolysis of PTC. (A) TPC-1 cells were transfected with Control siRNA or FAM111B siRNAs and treated with SGI-1027 or not. The proliferation of the cells was detected by CCK-8 assay. The representative immunoblot displays FAM111B protein level. Left panels show the relative levels of FAM111B protein density. (B) Colony formation assay of TPC-1 cells transfected and treated as in (A). Representative images show colonies on plates (upper panels). Histograms display colony number (B). (C, D) Wound healing (C) and transwell (D) assays of TPC-1 cells transfected and treated as in (A). Representative histograms show the relative cell migration and invasion. (E) TPC-1 cells were transfected and treated as in (A), and glucose uptake, the production of lactate and ATP were determined. Representative immunoblot reveals the protein expression of FAM111B. Lower panels show the relative levels of FAM111B protein density. (F, G) TPC-1 cells were transfected and treated as in (A), and extracellular acidification rate (ECAR) (F) and oxygen consumption rate (OCR) (G) were then measured. Scale bar, 25 μm. All values shown are mean ± S.D. of triplicate measurements and have been repeated 3 times with similar results (A-G). *p < 0.05, **p < 0.01, ***p < 0.001 vs. DMSO + Control siRNA.
Figure 6
Figure 6
Methylation of FAM111B promotes the growth and lung metastasis of PTC in vivo. (A, B) TPC-1 cells firmly infected with the lentivirus carrying the indicated constructs were injected subcutaneously into nude mice (n = 8 per group). The tumor volume was evaluated every 5 days and the growth curve was plotted (B). (C) Representative IHC staining of FAM111B, Ki67 and H&E images of tumors resected from (A). Scale bar, 50 µm. (D) TPC-1 cells expressing the constructs were injected through the tail vein to build a PTC cell metastasis model in nude mice (n = 8 per group). Lung CT scan of groups were performed and representative metastatic foci of lungs were subjected to anatomical and histological analyses. **p < 0.01, ***p < 0.001 versus the corresponding control.
Figure 7
Figure 7
Correlations between DNMT3B, FAM111B and glycolytic gene expression and association of FAM111B and DNMT3B with glucose uptake in patients with thyroid cancer. (A) Representative IHC staining for FAM111B, DNMT3B and PGK1 in PTC patients. Scale bar, 50 μm. Right panel showing the percentage of specimens with low or high PGK1 and DNMT3B expressions in the low or high FAM111B expression groups. CASE 1 and CASE 2 refer to two representative samples categorized by low and high FAM111B expression. (B) The correlation of glucose uptake in TC patients with different expressions of FAM111B and DNMT3B using the Mann Whitney U test. CASE 1 and CASE 2 refer to two representative samples categorized by low and high FDG uptake. Scale bar, 50 μm. (C) Graphical abstract underlying the role of the DNMT3B/FAM111B axis in regulating PTC growth and lung metastasis.

Similar articles

Cited by

References

    1. Kim J, Gosnell JE, Roman SA. et al. Geographic influences in the global rise of thyroid cancer. Endocrinology. 2020;16:17–29. - PubMed
    1. Prete A, Borges de Souza P, Censi S. et al. Update on Fundamental Mechanisms of Thyroid Cancer. Front Endocrinol (Lausanne) 2020;11:102. - PMC - PubMed
    1. Jendrzejewski J, Thomas A, Liyanarachchi S. et al. PTCSC3 Is Involved in Papillary Thyroid Carcinoma Development by Modulating S100A4 Gene Expression. J Clin Endocrinol Metab. 2015;100:E1370–7. - PMC - PubMed
    1. Doubi A, Al-Qannass A, Al-Angari SS. et al. Trends in thyroid carcinoma among thyroidectomy patients: a 12-year multicenter study. Ann Saudi Med. 2019;39:345–349. - PMC - PubMed
    1. Lu Y, Li J, Li J. Estrogen and thyroid diseases: an update. Minerva Med. 2016;107:239–44. - PubMed

Publication types