

Combining Single-Cell and Transcriptomic Data Revealed the Prognostic Significance of Glycolysis in Pancreatic Cancer
- PMID: 35865013
- PMCID: PMC9294390
- DOI: 10.3389/fgene.2022.903783
Combining Single-Cell and Transcriptomic Data Revealed the Prognostic Significance of Glycolysis in Pancreatic Cancer
Abstract
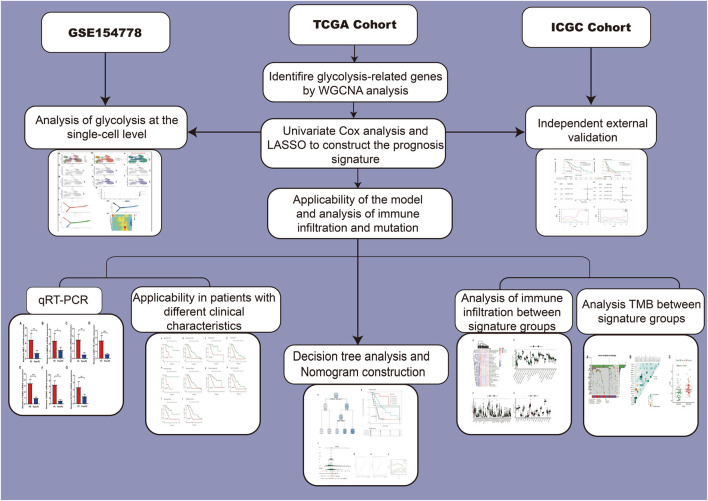
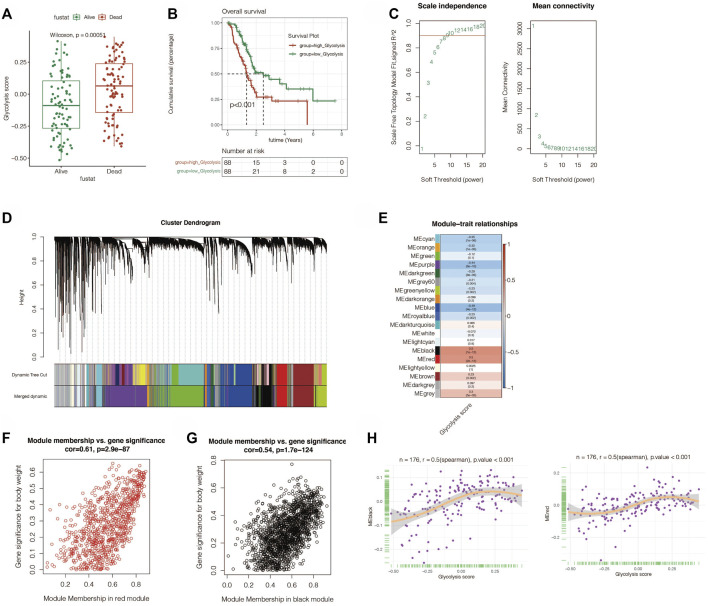
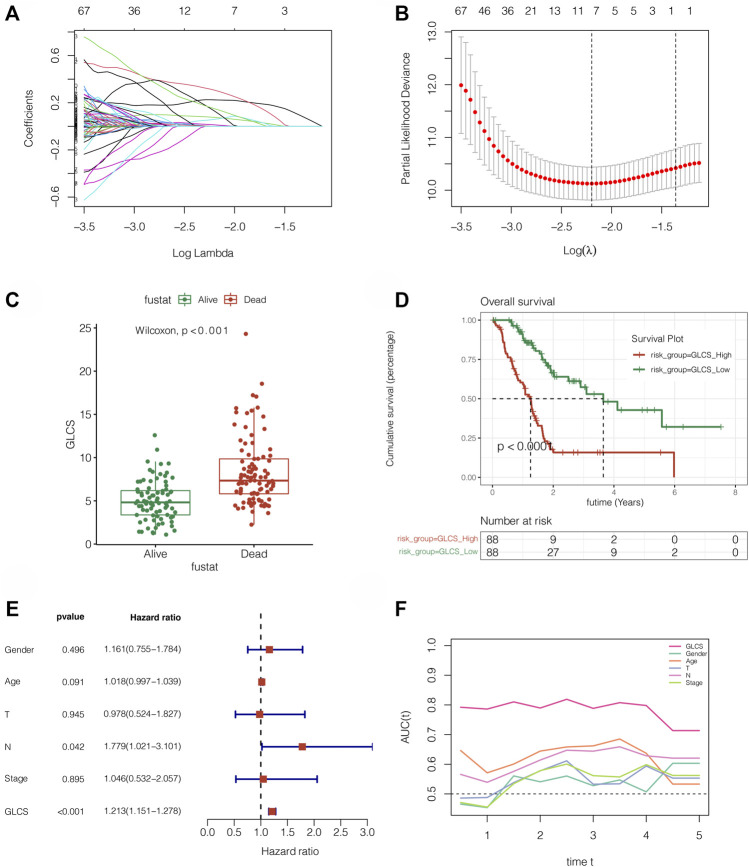
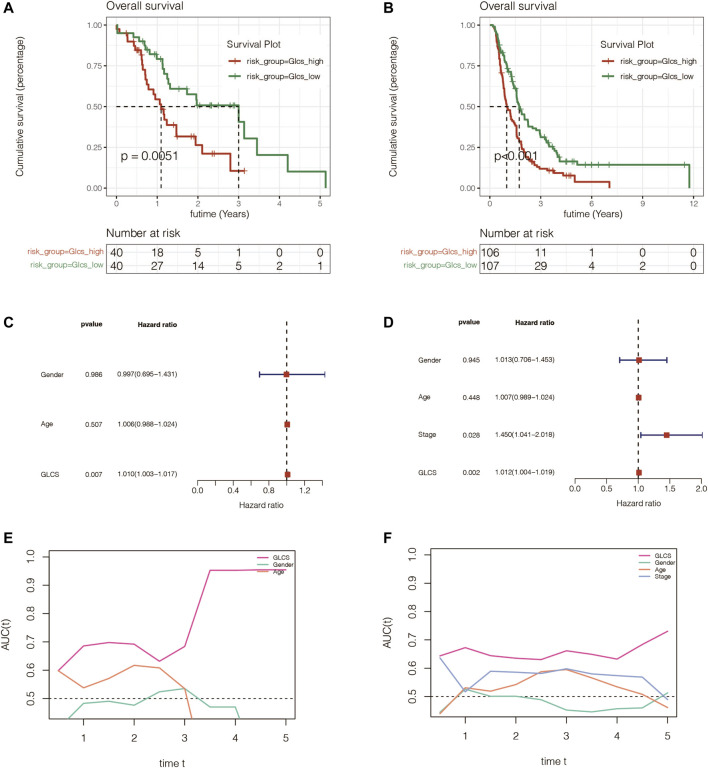
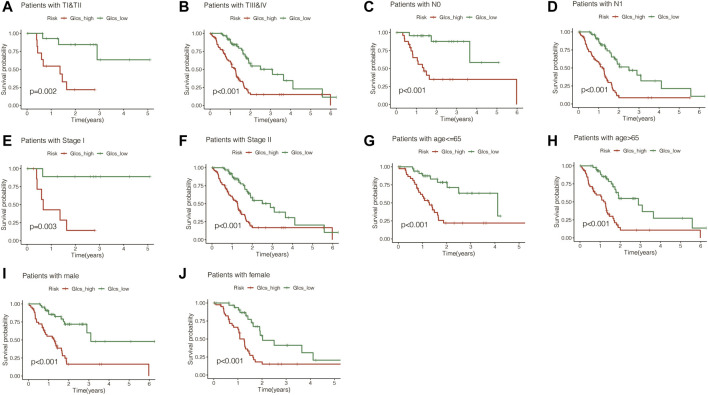
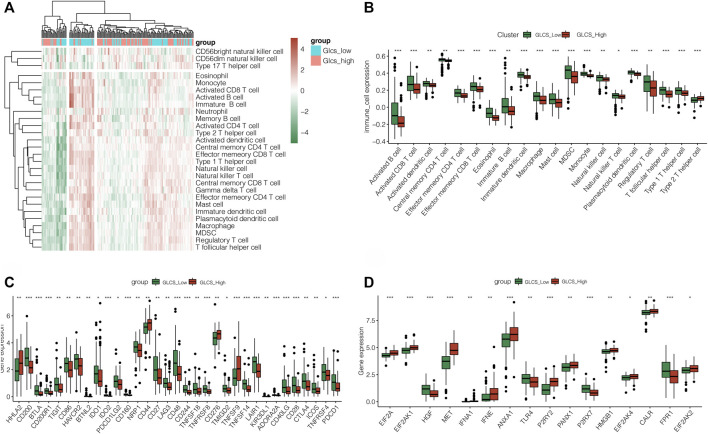
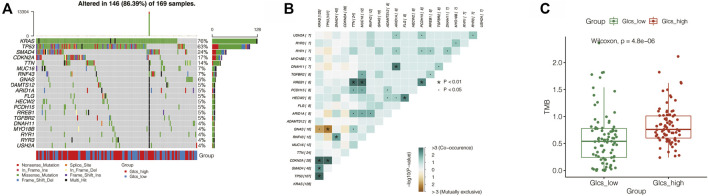
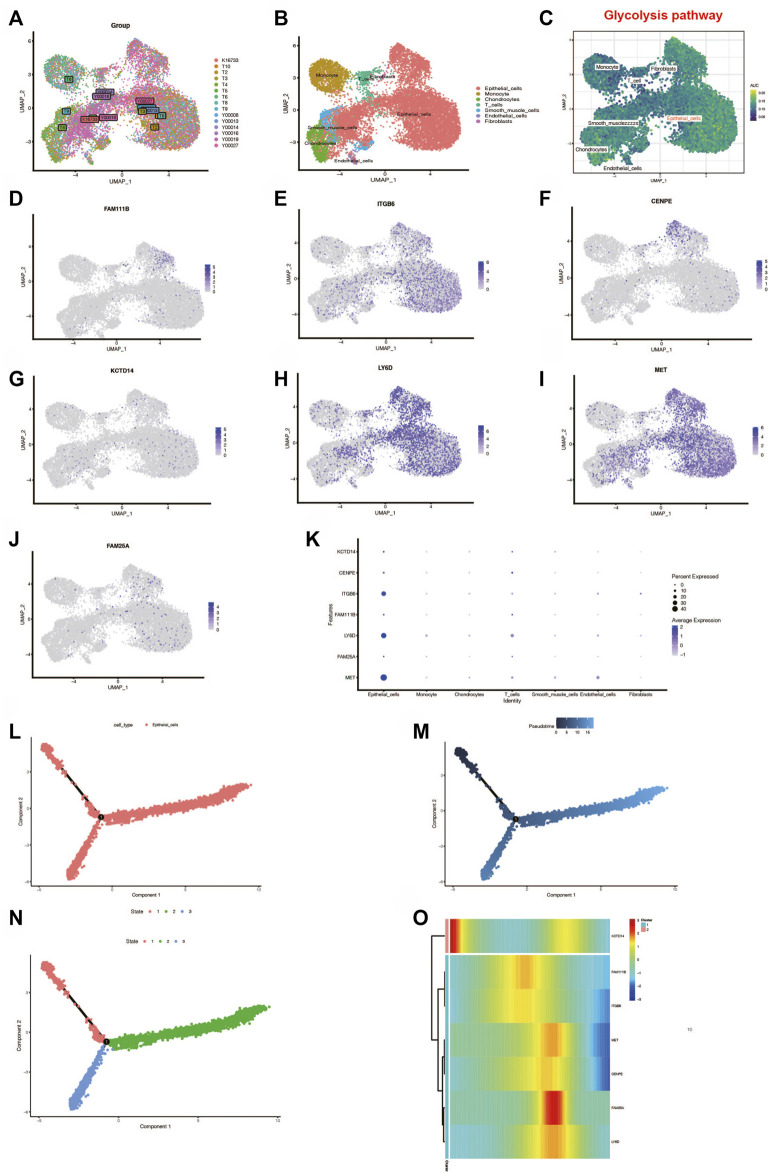
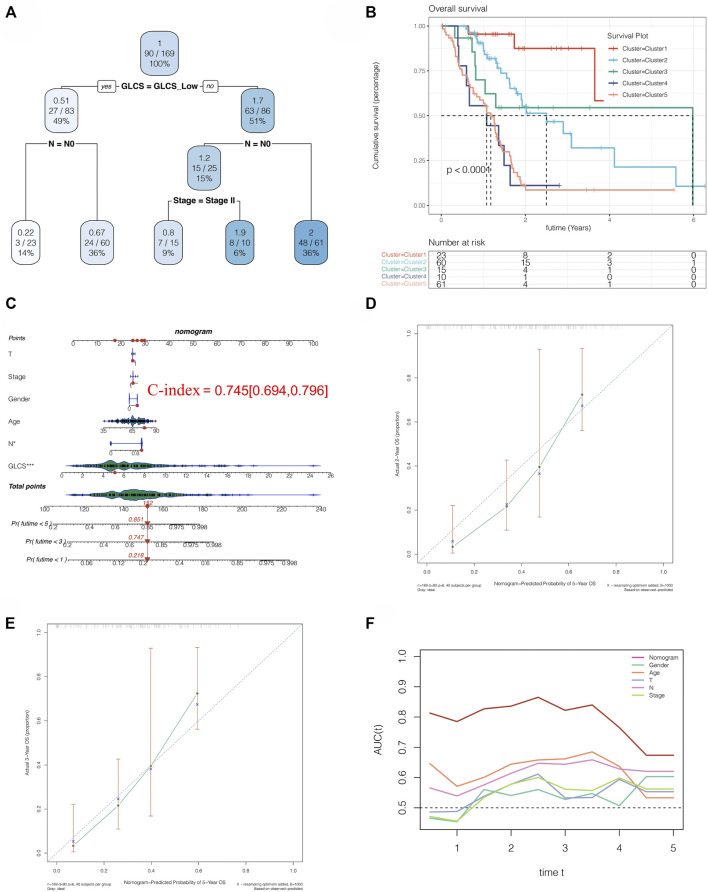
Background: Pancreatic cancer (PC), the most common fatal solid malignancy, has a very dismal prognosis. Clinical computerized tomography (CT) and pathological TNM staging are no longer sufficient for determining a patient's prognosis. Although numerous studies have suggested that glycolysis is important in the onset and progression of cancer, there are few publications on its impact on PC. Methods: To begin, the single-sample gene set enrichment analysis (ssGSEA) approach was used to quantify the glycolysis pathway enrichment fraction in PC patients and establish its prognostic significance. The genes most related to the glycolytic pathway were then identified using weighted gene co-expression network analysis (WGCNA). The glycolysis-associated prognostic signature in PC patients was then constructed using univariate Cox regression and lasso regression methods, which were validated in numerous external validation cohorts. Furthermore, we investigated the activation of the glycolysis pathway in PC cell subtypes at the single-cell level, performed a quasi-time series analysis on the activated cell subtypes and then detected gene changes in the signature during cell development. Finally, we constructed a decision tree and a nomogram that could divide the patients into different risk subtypes, according to the signature score and their different clinical characteristics and assessed the prognosis of PC patients. Results: Glycolysis plays a risky role in PC patients. Our glycolysis-related signature could effectively discriminate the high-risk and low-risk patients in both the trained cohort and the independent externally validated cohort. The survival analysis and multivariate Cox analysis indicated this gene signature to be an independent prognostic factor in PC. The prognostic ROC curve analysis suggested a high accuracy of this gene signature in predicting the patient prognosis in PC. The single-cell analysis suggested that the glycolytic pathway may be more activated in epithelial cells and that the genes in the signature were also mainly expressed in epithelial cells. The decision tree analysis could effectively identify patients in different risk subgroups, and the nomograms clearly show the prognostic assessment of PC patients. Conclusion: Our study developed a glycolysis-related signature, which contributes to the risk subtype assessment of patients with PC and to the individualized management of patients in the clinical setting.
Keywords: glycolysis; immune infiltration; pancreatic cancer; prognosis; single-cell.
Copyright © 2022 Chen, Lin, Wei, Wang, Li, Du, Yang, Hu, Ying, Tang, Xie and Yu.
Conflict of interest statement
The authors declare that the research was conducted in the absence of any commercial or financial relationships that could be construed as a potential conflict of interest.
Figures
Similar articles
-
A Comprehensive Prognostic and Immunological Analysis of a Six-Gene Signature Associated With Glycolysis and Immune Response in Uveal Melanoma.Front Immunol. 2021 Sep 22;12:738068. doi: 10.3389/fimmu.2021.738068. eCollection 2021. Front Immunol. 2021. PMID: 34630418 Free PMC article.
-
A novel prognostic signature based on four glycolysis-related genes predicts survival and clinical risk of hepatocellular carcinoma.J Clin Lab Anal. 2021 Nov;35(11):e24005. doi: 10.1002/jcla.24005. Epub 2021 Sep 15. J Clin Lab Anal. 2021. PMID: 34523732 Free PMC article.
-
Comprehensive analysis of a glycolysis and cholesterol synthesis-related genes signature for predicting prognosis and immune landscape in osteosarcoma.Front Immunol. 2022 Dec 23;13:1096009. doi: 10.3389/fimmu.2022.1096009. eCollection 2022. Front Immunol. 2022. PMID: 36618348 Free PMC article.
-
Identification of a Novel Glycolysis-Related LncRNA Signature for Predicting Overall Survival in Patients With Bladder Cancer.Front Genet. 2021 Aug 19;12:720421. doi: 10.3389/fgene.2021.720421. eCollection 2021. Front Genet. 2021. PMID: 34490046 Free PMC article.
-
A novel tp53-associated nomogram to predict the overall survival in patients with pancreatic cancer.BMC Cancer. 2021 Mar 31;21(1):335. doi: 10.1186/s12885-021-08066-2. BMC Cancer. 2021. PMID: 33789615 Free PMC article.
References
-
- Eissa M. A. L., Lerner L., Abdelfatah E., Shankar N., Canner J. K., Hasan N. M., et al. (2019). Promoter Methylation of ADAMTS1 and BNC1 as Potential Biomarkers for Early Detection of Pancreatic Cancer in Blood. Clin. Epigenet 11 (1), 59. Published 2019 Apr 5. 10.1186/s13148-019-0650-0 - DOI - PMC - PubMed
LinkOut - more resources
Full Text Sources