

A Novel Prognostic Signature Associated with Immunotherapeutic Response for Hepatocellular Carcinoma
- PMID: 35865037
- PMCID: PMC9294469
- DOI: 10.3389/fsurg.2022.905897
A Novel Prognostic Signature Associated with Immunotherapeutic Response for Hepatocellular Carcinoma
Abstract
Background: Although accumulating literature has validated that necroptosis plays a prominent role in the tumorigenesis and progression of various malignant cancer, its mechanism in hepatocellular carcinoma (HCC) is poorly understood. Therefore, in the present study, we want to study the impact of necroptosis-related genes on the prognosis and microenvironment-infiltrating immunocytes and the effect of immunotherapy on patients with HCC.
Methods: The necroptosis-related genes were obtained by reviewing the available published literature; we then evaluated the effects of the prognostic genes on the relative abundance of microenvironment infiltrated immunocytes. After construction of the Risk Score Signature, we evaluated the prognostic value and the effects on immune cells infiltrating the tumor microenvironment (TME). Combining the available data on immunotherapy, we also investigated the impact on anti-PD-L1-based immunotherapy.
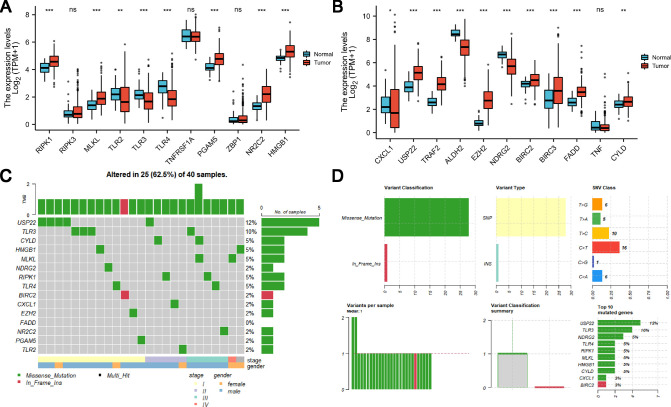
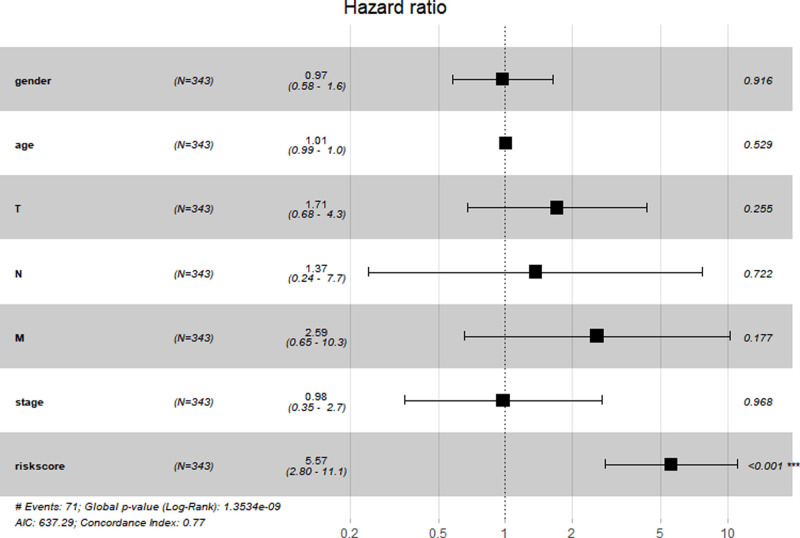
Results: A comprehensive study of the published literature confirmed that 22 genes are related to necroptosis. Among them, 10 genes were related to the prognosis of the HCC cohort in The Cancer Genome Atlas (TCGA) and had a multifaceted influence on TME. We obtained the Risk Score Signature by Lasso regression. Furthermore, we also corroborated the correlation between the Risk Score Signature and tumor-infiltrating immune cells in the TME. Next, in the study of the correlation between the Signature and immunotherapy, we found that the Signature was significantly correlated with the reactivity of anti-PD-L1 immunotherapy. We also confirmed that the Risk Score Signature is a reliable and efficient independent prognostic marker of HCC.
Conclusion: We established a novel and effective prognostic model for patients with HCC, which is markedly related to the TME and immune infiltration in HCC and can also predict immunotherapeutic response and prognosis.
Keywords: hepatocellular carcinoma; immune infiltration; immunotherapy; necroptosis; prognostic signature.
Copyright © 2022 Jin and Wang.
Conflict of interest statement
The authors declare that the research was conducted in the absence of any commercial or financial relationships that could be construed as a potential conflict of interest.
Figures


Similar articles
-
Identification of a prognostic and therapeutic immune signature associated with hepatocellular carcinoma.Cancer Cell Int. 2021 Feb 10;21(1):98. doi: 10.1186/s12935-021-01792-4. Cancer Cell Int. 2021. PMID: 33568167 Free PMC article.
-
Overweight/obesity-related transcriptomic signature as a correlate of clinical outcome, immune microenvironment, and treatment response in hepatocellular carcinoma.Front Endocrinol (Lausanne). 2023 Jan 12;13:1061091. doi: 10.3389/fendo.2022.1061091. eCollection 2022. Front Endocrinol (Lausanne). 2023. PMID: 36714595 Free PMC article.
-
Identification and Validation of a Novel Tumor Microenvironment-Related Prognostic Signature of Patients With Hepatocellular Carcinoma.Front Mol Biosci. 2022 Jun 30;9:917839. doi: 10.3389/fmolb.2022.917839. eCollection 2022. Front Mol Biosci. 2022. PMID: 35847972 Free PMC article.
-
Novel Molecular Targets for Immune Surveillance of Hepatocellular Carcinoma.Cancers (Basel). 2023 Jul 15;15(14):3629. doi: 10.3390/cancers15143629. Cancers (Basel). 2023. PMID: 37509293 Free PMC article. Review.
-
Tumor-Infiltrating B Lymphocytes: Promising Immunotherapeutic Targets for Primary Liver Cancer Treatment.Cancers (Basel). 2023 Apr 6;15(7):2182. doi: 10.3390/cancers15072182. Cancers (Basel). 2023. PMID: 37046842 Free PMC article. Review.
References
-
- Alameda JP, Moreno-Maldonado R, Navarro M, Bravo A, Ramírez A, Page A, et al. An inactivating CYLD mutation promotes skin tumor progression by conferring enhanced proliferative, survival and angiogenic properties to epidermal cancer cells. Oncogene. (2010) 29:6522–32. 10.1038/ONC.2010.378. - DOI - PubMed
-
- Mantel F, Frey B, Haslinger S, Schildkopf P, Sieber R, Ott OJ, et al. Combination of ionising irradiation and hyperthermia activates programmed apoptotic and necrotic cell death pathways in human colorectal carcinoma cells. Strahlenther Onkol. (2010) 186:587–99. 10.1007/S00066-010-2154-X. - DOI - PubMed
LinkOut - more resources
Full Text Sources
Research Materials