HAUS Augmin-Like Complex Subunit 1 Influences Tumour Microenvironment and Prognostic Outcomes in Glioma
- PMID: 35865089
- PMCID: PMC9296284
- DOI: 10.1155/2022/8027686
HAUS Augmin-Like Complex Subunit 1 Influences Tumour Microenvironment and Prognostic Outcomes in Glioma
Abstract
Background: The expression of HAUS Augmin-like complex subunit 1 (HAUS1), a protein-coding gene, is low in normal samples among various cancers with pan-cancer analysis. The depletion of HAUS1 in cells decreases the G2/M cell compartment and induces apoptosis. However, the detailed expression pattern of HAUS1 and its correlation with immune infiltration in glioma (LGG and GBM) (LGG: low-grade glioma; GBM: glioblastoma) remain unknown. Therefore, in this study, we examined the role and prognostic value of HAUS1 in glioma.
Methods: Transcriptional expression data of HAUS1 were collected from the CGGA and TCGA databases. The Kaplan-Meier analysis, univariate and multivariate Cox analyses, and receiver operating characteristic (ROC) curves were used to analyse the clinical significance of HAUS1 in glioma. The STRING database was used to analyse protein-protein interactions (PPI), and the "ClusterProfiler" package was used for functional enrichment analysis to examine the possible biological roles of HAUS1. In addition, the HAUS1 promoter methylation modification was analysed using MEXPRESS, and the association between HAUS1 expression and tumour-infiltrating immune cells was investigated using CIBERSORT.
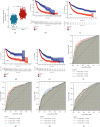
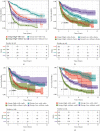
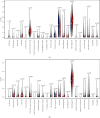
Results: Based on the data retrieved from TCGA (703 samples) and CGGA (1018 samples), an elevated expression of HAUS1 was observed in glioma samples, which was associated with poorer survival of patients, unfavourable clinical characteristics, 1p/19q codeletion status, WHO grade, and IDH mutation status. Furthermore, multivariate and univariate Cox analyses revealed that HAUS1 was an independent predictor of glioma. HAUS1 expression level was associated with several tumour-infiltrating immune cells, such as Th2 cells, macrophages, and activated dendritic cells. The outcomes of ROC curve analysis showed that HAUS1 was good to prognosticate immune infiltrating levels in glioma with a higher area under the curve (AUC) value (AUC = 0.974).
Conclusions: HAUS1 was upregulated and served as a biomarker for poor prognosis in patients with glioma. High HAUS1 expression was associated with several tumour-infiltrating immune cells such as Th2 cells, macrophages, and activated dendritic cells, which had high infiltration levels. Therefore, these findings suggest that HAUS1 is a potential biomarker for predicting the prognosis of patients with glioma and plays a pivotal role in immune infiltration in glioma.
Copyright © 2022 Qi Yao et al.
Conflict of interest statement
The authors declare that they have no conflicts of interests.
Figures


Similar articles
-
The significance of HAUS1 and its relationship with immune microenvironment in hepatocellular carcinoma.J Cancer. 2024 Jan 16;15(5):1328-1341. doi: 10.7150/jca.90298. eCollection 2024. J Cancer. 2024. PMID: 38356703 Free PMC article.
-
Next-generation sequencing identifies HOXA6 as a novel oncogenic gene in low grade glioma.Aging (Albany NY). 2022 Mar 29;14(6):2819-2854. doi: 10.18632/aging.203977. Epub 2022 Mar 29. Aging (Albany NY). 2022. PMID: 35349479 Free PMC article.
-
Prognostic value of CTF1 in glioma and its role in the tumor microenvironment.Transl Cancer Res. 2024 Dec 31;13(12):6862-6879. doi: 10.21037/tcr-24-1258. Epub 2024 Dec 27. Transl Cancer Res. 2024. PMID: 39816535 Free PMC article.
-
Elevated TYROBP expression predicts poor prognosis and high tumor immune infiltration in patients with low-grade glioma.BMC Cancer. 2021 Jun 23;21(1):723. doi: 10.1186/s12885-021-08456-6. BMC Cancer. 2021. PMID: 34162355 Free PMC article.
-
EVA1B to Evaluate the Tumor Immune Microenvironment and Clinical Prognosis in Glioma.Front Immunol. 2021 Apr 6;12:648416. doi: 10.3389/fimmu.2021.648416. eCollection 2021. Front Immunol. 2021. PMID: 33889156 Free PMC article.
Cited by
-
Pan-cancer analysis of PSCA that is associated with immune infiltration and affects patient prognosis.PLoS One. 2024 Jun 25;19(6):e0298469. doi: 10.1371/journal.pone.0298469. eCollection 2024. PLoS One. 2024. PMID: 38917176 Free PMC article.
-
Prognostic significance of TMEM131L in glioma and establishment of oxidative stress prognostic model.Front Neurol. 2023 Apr 6;14:1162394. doi: 10.3389/fneur.2023.1162394. eCollection 2023. Front Neurol. 2023. PMID: 37090987 Free PMC article.
-
A Prognostic Risk Model of a Novel Oxidative Stress-Related Signature Predicts Clinical Prognosis and Demonstrates Immune Relevancy in Lung Adenocarcinoma.Oxid Med Cell Longev. 2022 Nov 18;2022:2262014. doi: 10.1155/2022/2262014. eCollection 2022. Oxid Med Cell Longev. 2022. PMID: 36439693 Free PMC article.
-
The significance of HAUS1 and its relationship with immune microenvironment in hepatocellular carcinoma.J Cancer. 2024 Jan 16;15(5):1328-1341. doi: 10.7150/jca.90298. eCollection 2024. J Cancer. 2024. PMID: 38356703 Free PMC article.
References
LinkOut - more resources
Full Text Sources

