

Gold nanoparticle-directed autophagy intervention for antitumor immunotherapy via inhibiting tumor-associated macrophage M2 polarization
- PMID: 35865102
- PMCID: PMC9293675
- DOI: 10.1016/j.apsb.2022.02.008
Gold nanoparticle-directed autophagy intervention for antitumor immunotherapy via inhibiting tumor-associated macrophage M2 polarization
Abstract
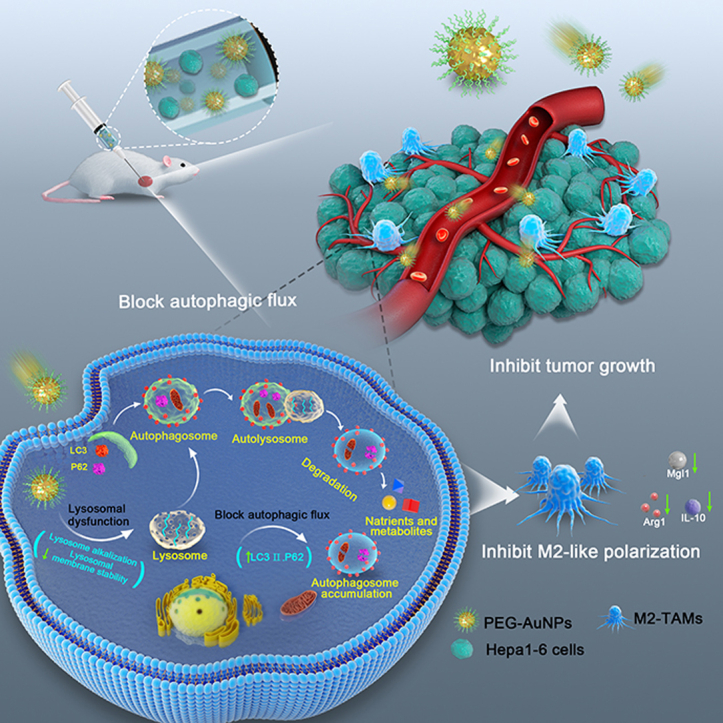
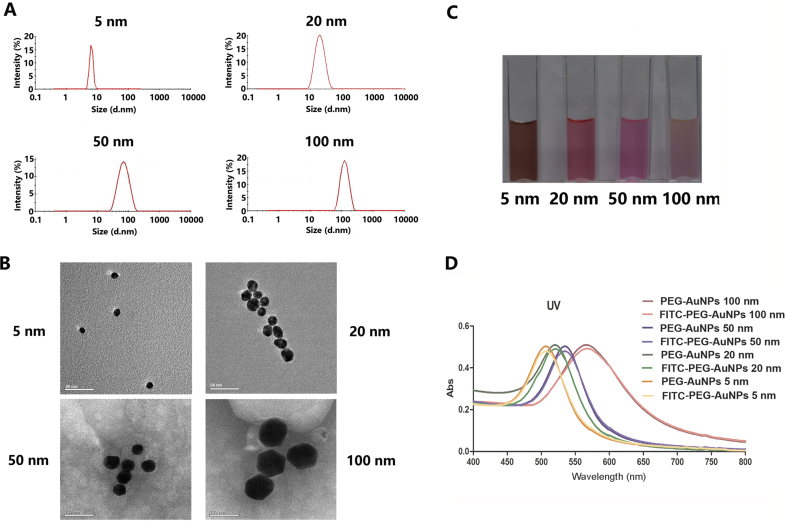
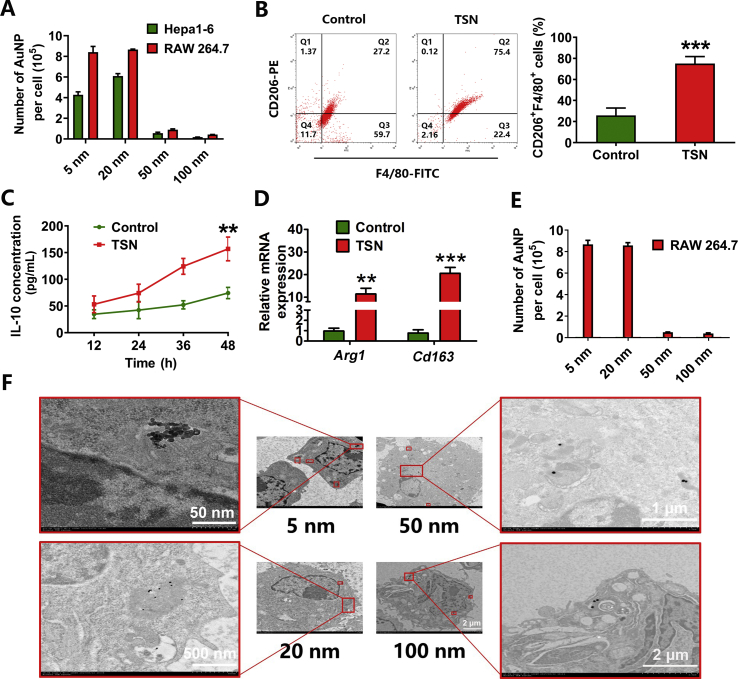
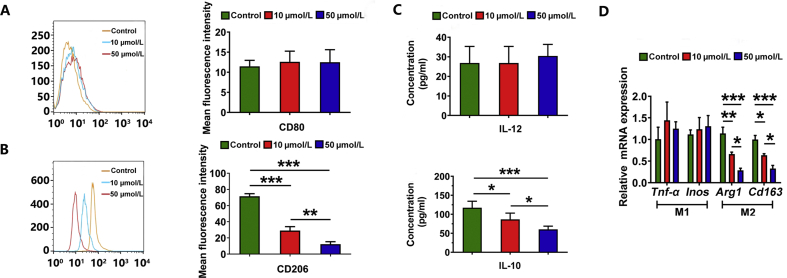
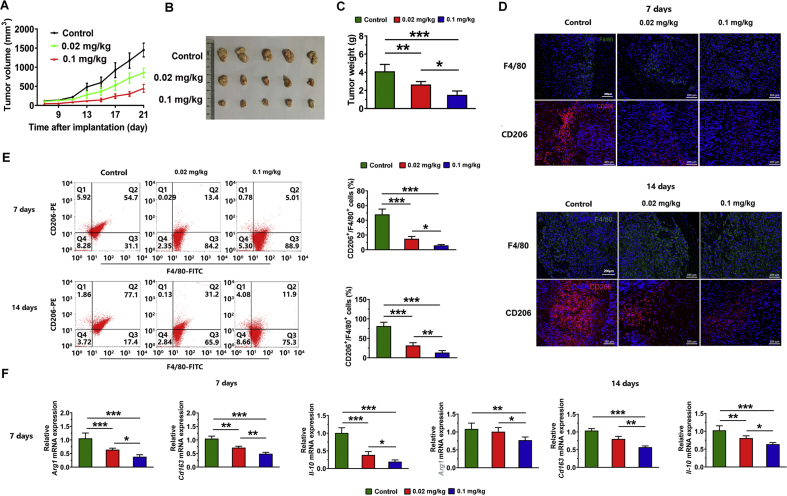
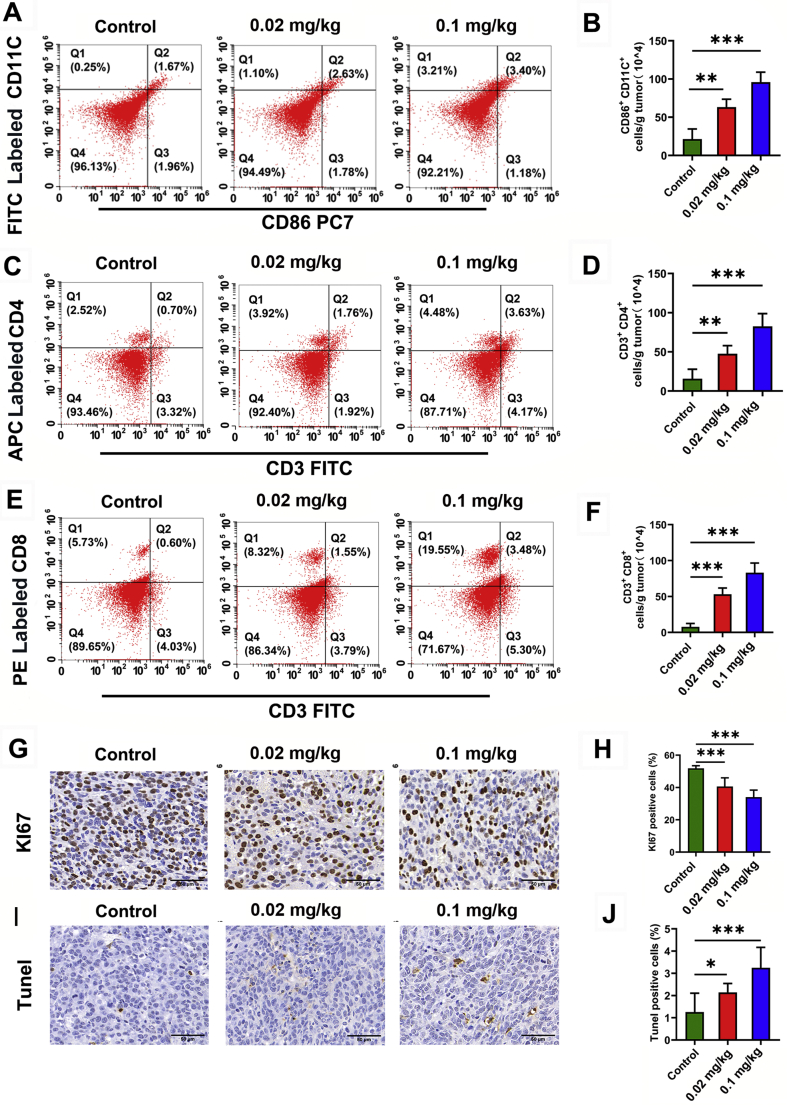
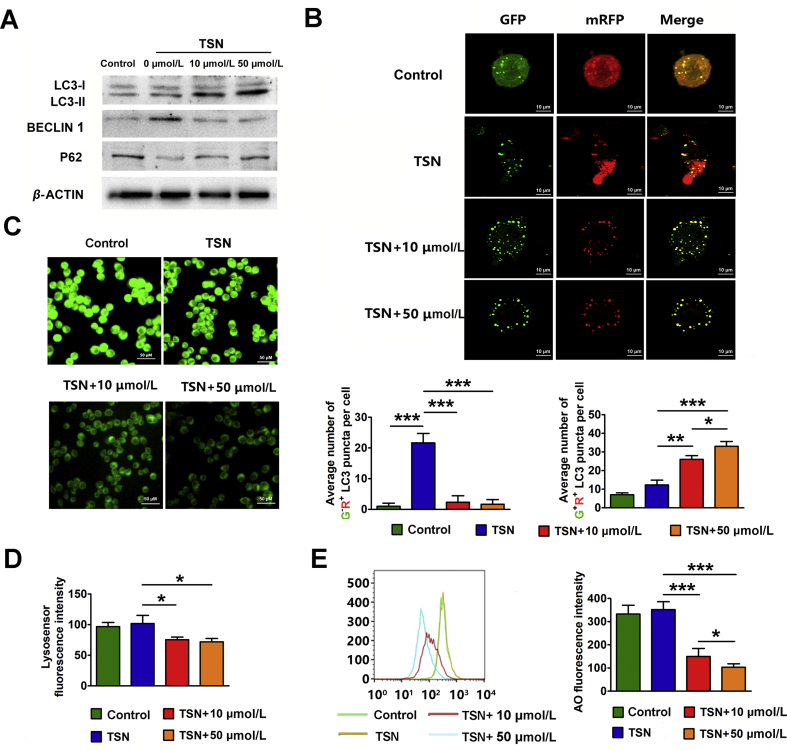
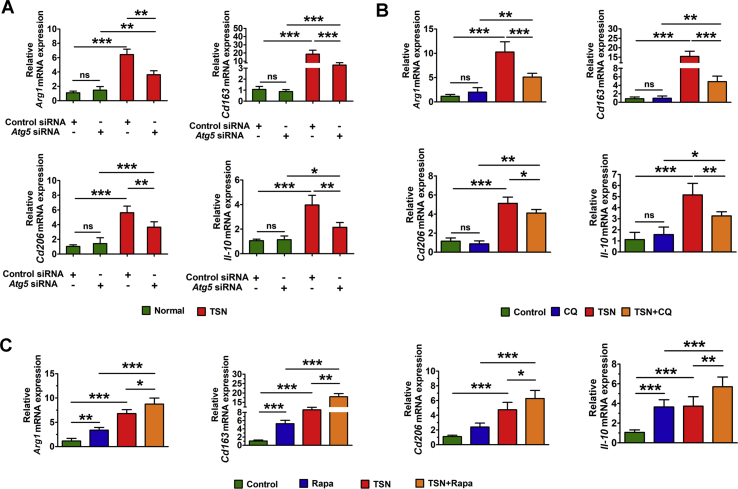
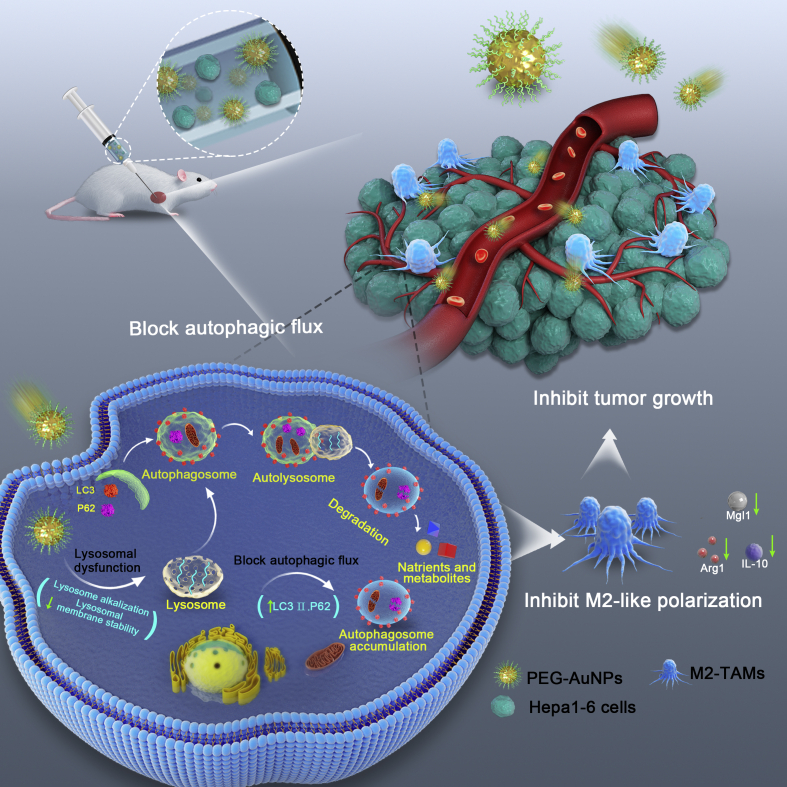
Tumor-associated macrophages (TAMs), one of the dominating constituents of tumor microenvironment, are important contributors to cancer progression and treatment resistance. Therefore, regulation of TAMs polarization from M2 phenotype towards M1 phenotype has emerged as a new strategy for tumor immunotherapy. Herein, we successfully initiated antitumor immunotherapy by inhibiting TAMs M2 polarization via autophagy intervention with polyethylene glycol-conjugated gold nanoparticles (PEG-AuNPs). PEG-AuNPs suppressed TAMs M2 polarization in both in vitro and in vivo models, elicited antitumor immunotherapy and inhibited subcutaneous tumor growth in mice. As demonstrated by the mRFP-GFP-LC3 assay and analyzing the autophagy-related proteins (LC3, beclin1 and P62), PEG-AuNPs induced autophagic flux inhibition in TAMs, which is attributed to the PEG-AuNPs induced lysosome alkalization and membrane permeabilization. Besides, TAMs were prone to polarize towards M2 phenotype following autophagy activation, whereas inhibition of autophagic flux could reduce the M2 polarization of TAMs. Our results revealed a mechanism underlying PEG-AuNPs induced antitumor immunotherapy, where PEG-AuNPs reduce TAMs M2 polarization via induction of lysosome dysfunction and autophagic flux inhibition. This study elucidated the biological effects of nanomaterials on TAMs polarization and provided insight into harnessing the intrinsic immunomodulation capacity of nanomaterials for effective cancer treatment.
Keywords: Autophagy flux; Cancer therapy; Gold nanoparticles; Lysosomal damage; M2 macrophage; Macrophage polarization; Nanomaterials; Tumor-associated macrophages.
© 2022 Chinese Pharmaceutical Association and Institute of Materia Medica, Chinese Academy of Medical Sciences. Production and hosting by Elsevier B.V.
Conflict of interest statement
The authors declare no conflict of interest.
Figures
Similar articles
-
Gold Nanoparticle Inhibits the Tumor-Associated Macrophage M2 Polarization by Inhibiting m6A Methylation-Dependent ATG5/Autophagy in Prostate Cancer.Anal Cell Pathol (Amst). 2025 Jan 4;2025:6648632. doi: 10.1155/ancp/6648632. eCollection 2025. Anal Cell Pathol (Amst). 2025. PMID: 39802931 Free PMC article.
-
Cathepsin S-mediated autophagic flux in tumor-associated macrophages accelerate tumor development by promoting M2 polarization.Mol Cancer. 2014 Mar 2;13:43. doi: 10.1186/1476-4598-13-43. Mol Cancer. 2014. PMID: 24580730 Free PMC article.
-
Tumor cell-released autophagosomes (TRAPs) promote immunosuppression through induction of M2-like macrophages with increased expression of PD-L1.J Immunother Cancer. 2018 Dec 18;6(1):151. doi: 10.1186/s40425-018-0452-5. J Immunother Cancer. 2018. PMID: 30563569 Free PMC article.
-
Autophagy drives plasticity and functional polarization of tumor-associated macrophages.IUBMB Life. 2022 Feb;74(2):157-169. doi: 10.1002/iub.2543. Epub 2021 Aug 31. IUBMB Life. 2022. PMID: 34467634 Review.
-
Shaping Polarization Of Tumor-Associated Macrophages In Cancer Immunotherapy.Front Immunol. 2022 Jun 30;13:888713. doi: 10.3389/fimmu.2022.888713. eCollection 2022. Front Immunol. 2022. PMID: 35844605 Free PMC article. Review.
Cited by
-
Tumor-Associated Macrophage Targeting of Nanomedicines in Cancer Therapy.Pharmaceutics. 2023 Dec 29;16(1):61. doi: 10.3390/pharmaceutics16010061. Pharmaceutics. 2023. PMID: 38258072 Free PMC article. Review.
-
Genetically engineered M2-like macrophage-derived exosomes for P. gingivalis-suppressed cementum regeneration: From mechanism to therapy.Bioact Mater. 2023 Oct 27;32:473-487. doi: 10.1016/j.bioactmat.2023.10.009. eCollection 2024 Feb. Bioact Mater. 2023. PMID: 37965240 Free PMC article.
-
In situ autophagy regulation in synergy with phototherapy for breast cancer treatment.Acta Pharm Sin B. 2024 May;14(5):2317-2332. doi: 10.1016/j.apsb.2023.11.019. Epub 2023 Nov 18. Acta Pharm Sin B. 2024. PMID: 38799627 Free PMC article.
-
Unraveling the role of M2 TAMs in ovarian cancer dynamics: a systematic review.J Transl Med. 2025 Jun 3;23(1):623. doi: 10.1186/s12967-025-06643-8. J Transl Med. 2025. PMID: 40462084 Free PMC article. Review.
-
The role of SH3RF2 in lung squamous cell carcinoma and M2 polarization: insights into LZTS2 ubiquitination.Biol Direct. 2025 Jul 17;20(1):87. doi: 10.1186/s13062-025-00677-0. Biol Direct. 2025. PMID: 40676695 Free PMC article.
References
-
- Wu T., Dai Y. Tumor microenvironment and therapeutic response. Cancer Lett. 2017;387:61–68. - PubMed
-
- Zhang S.Y., Song X.Y., Li Y., Ye L.L., Zhou Q., Yang W.B. Tumor-associated macrophages: a promising target for a cancer immunotherapeutic strategy. Pharmacol Res. 2020;161:105–111. - PubMed
-
- Salmaninejad A., Valilou S.F., Soltani A., Ahmadi S., Abarghan Y.J., Rosengren R.J., et al. Tumor-associated macrophages: role in cancer development and therapeutic implications. Cell Oncol. 2019;42:591–608. - PubMed
LinkOut - more resources
Full Text Sources
Research Materials
