. 2022 Jun 28;25(8):104682.
doi: 10.1016/j.isci.2022.104682. eCollection 2022 Aug 19.

Human total, basal and activity energy expenditures are independent of ambient environmental temperature

Collaborators, Affiliations

Human total, basal and activity energy expenditures are independent of ambient environmental temperature

Xueying Zhang et al. iScience. .

Abstract

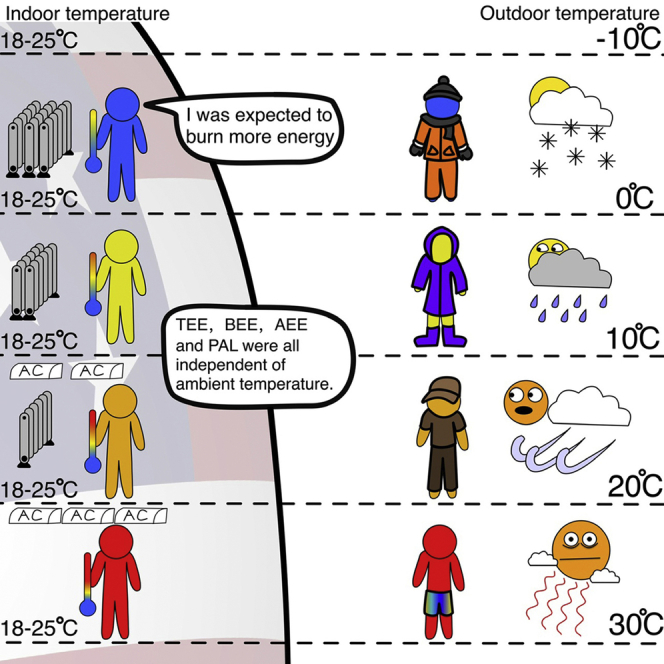
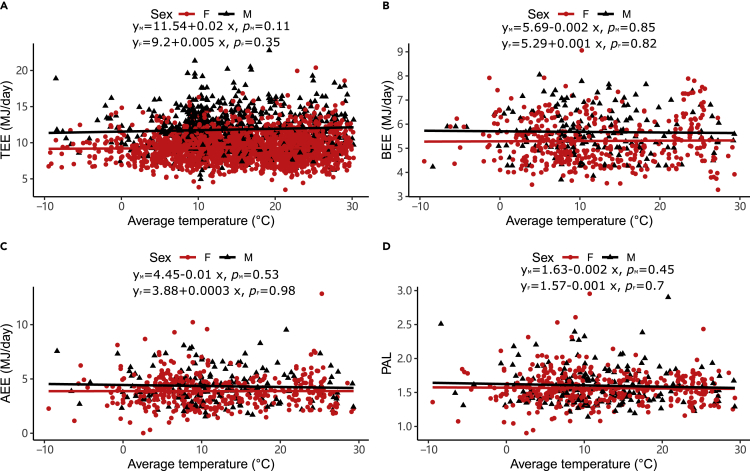
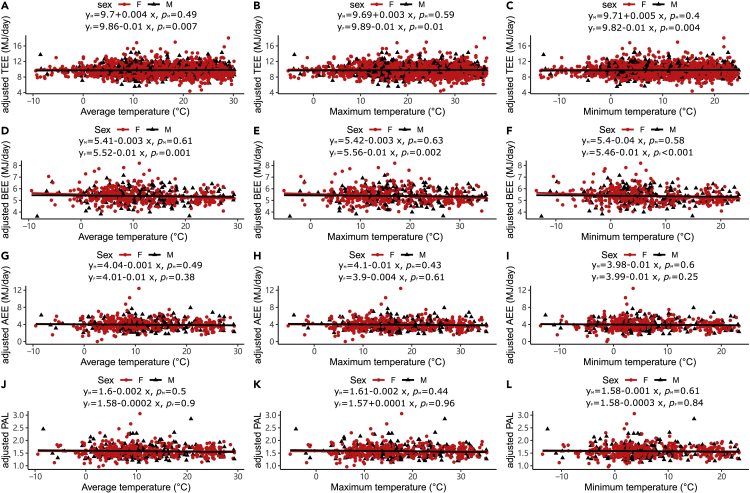
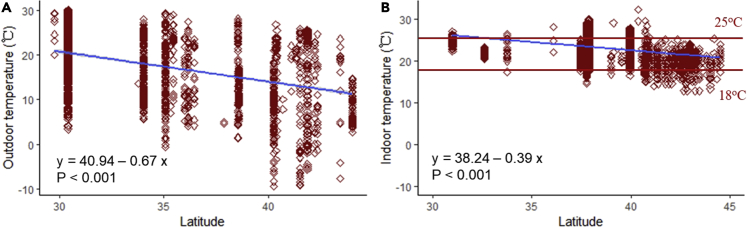
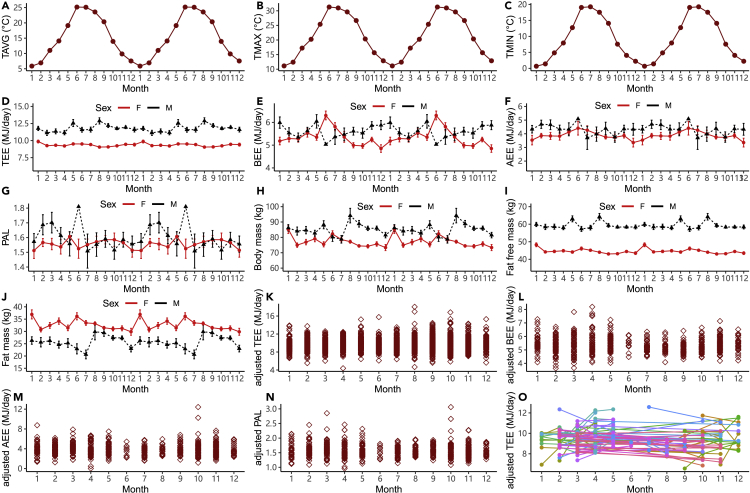
Lower ambient temperature (Ta) requires greater energy expenditure to sustain body temperature. However, effects of Ta on human energetics may be buffered by environmental modification and behavioral compensation. We used the IAEA DLW database for adults in the USA (n = 3213) to determine the effect of Ta (-10 to +30°C) on TEE, basal (BEE) and activity energy expenditure (AEE) and physical activity level (PAL). There were no significant relationships (p > 0.05) between maximum, minimum and average Ta and TEE, BEE, AEE and PAL. After adjustment for fat-free mass, fat mass and age, statistically significant (p < 0.01) relationships between TEE, BEE and Ta emerged in females but the effect sizes were not biologically meaningful. Temperatures inside buildings are regulated at 18-25°C independent of latitude. Hence, adults in the US modify their environments to keep TEE constant across a wide range of external ambient temperatures.

Keywords: Human Physiology; Human activity in medical context; Human metabolism.


Conflict of interest statement

The authors declare no conflicts of interest.

Figures

None
Graphical abstract
Figure 1
Figure 1
Associations between unadjusted total, basal, activity energy expenditure, physical activity levels, and ambient temperature (A) average temperature (oC) vs TEE (MJ/day). (B) average temperature (oC) vs BEE (MJ/day). (C) average temperature (oC) vs AEE (MJ/day). (D) average temperature (oC) vs PAL. Each data point is a different individual. The black lines are the least-squares fitted regression lines for males, and the red lines are for females.
Figure 2
Figure 2
Associations between adjusted total, basal, activity energy expenditure, physical activity levels (adjusted for fat-free mass, fat mass, age, and age2), and ambient temperature (A) average (B) maximum and (C) minimum temperature (oC) vs adjusted TEE (MJ/day). (D) average, (E) maximum, and (F) minimum temperature (oC) vs adjusted BEE (MJ/day). (G) average, (H) maximum, and (I) minimum temperature (oC) vs adjusted AEE (MJ/day). (J) average, (K) maximum, and (L) minimum temperature (oC) vs adjusted PAL. Each data point is a different individual. The black lines are the least-squares fitted regression lines for males, and the red lines are for females.
Figure 3
Figure 3
Associations between (A): outdoor temperature (oC) and (B): indoor temperature (oC) and latitude (oN) The outdoor temperature is the average temperature. For the indoor temperatures, the limits of 25°C and 18°C are shown in red.
Figure 4
Figure 4
Seasonal variations of ambient temperature and seasonal effects for TEE, BEE, AEE, PAL, body mass, fat-free mass, fat mass, adjusted TEE, adjusted BEE, adjusted AEE, adjusted PAL (adjusted for fat-free mass, fat mass, age, and age2) Plots A to J are shown as double plots to illuminate the seasonal trends, and all error bars are present as SE. (A) average temperature (oC). (B) maximum temperature (oC). (C) minimum temperature (oC). (D) Total energy expenditure (MJ/d). (E) Basal energy expenditure (MJ/d). (F) Activity energy expenditure (MJ/d). (G) Physical activity level. (H) Body mass (kg). (I) fat-free mass (kg). (J) fat mass (kg). (K) adjusted TEE. (L) adjusted BEE. (M) adjusted AEE, and (N) adjusted PAL. (O) repeated measures of adjusted TEE. Lines join repeat measures of the same individual in different months. Unadjusted and adjusted TEE, BEE, and AEE are in MJ/day, and each data point is a different individual.

References

    1. Au-Yong I.T., Thorn N., Ganatra R., Perkins A.C., Symonds M.E. Brown adipose tissue and seasonal variation in humans. Diabetes. 2009;58:2583–2587. doi: 10.2337/db09-0833. - DOI - PMC - PubMed
    1. Babu G.R., Murthy G.V.S., Ana Y., Patel P., Deepa R., Neelon S.E.B., Kinra S., Reddy K.S. Association of obesity with hypertension and type 2 diabetes mellitus in India: a meta-analysis of observational studies. World J. Diabetes. 2018;9:40–52. doi: 10.4239/wjd.v9.i1.40. - DOI - PMC - PubMed
    1. Betz M.J., Enerbäck S. Human brown adipose tissue: what we have learned so far. Diabetes. 2015;64:2352–2360. doi: 10.2337/db15-0146. - DOI - PubMed
    1. Blüher M. Obesity: global epidemiology and pathogenesis. Nat. Rev. Endocrinol. 2019;15:288–298. doi: 10.1038/s41574-019-0176-8. - DOI - PubMed
    1. Booten C., Robertson J., Christensen D., Heaney M., Brown D., Norton P., Smith C. National Renewable Energy Lab (NREL); Golden, CO (United States): 2017. Residential Indoor Temperature Study.