. 2022 Jun 17;1(3):pgac062.
doi: 10.1093/pnasnexus/pgac062. eCollection 2022 Jul.

Abnormal antibodies to self-carbohydrates in SARS-CoV-2-infected patients

Affiliations

Abnormal antibodies to self-carbohydrates in SARS-CoV-2-infected patients

Dorothy L Butler et al. PNAS Nexus. .

Abstract

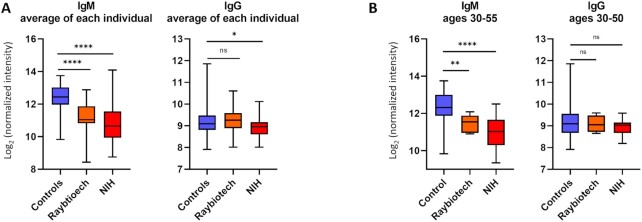
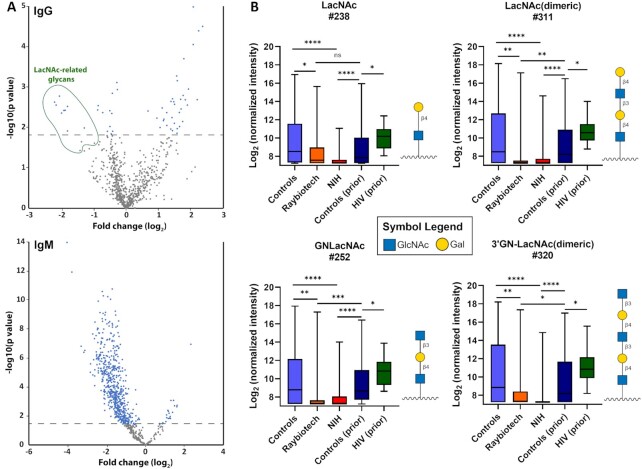
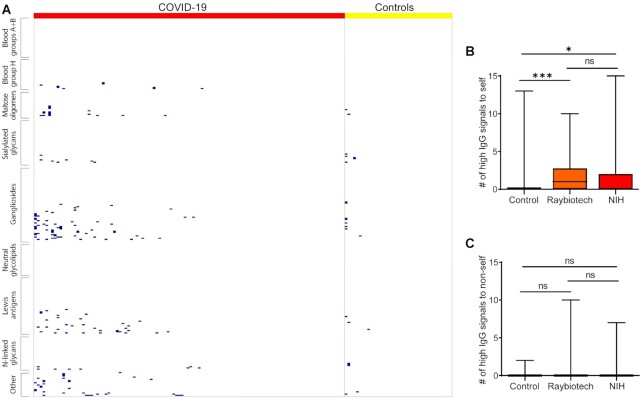
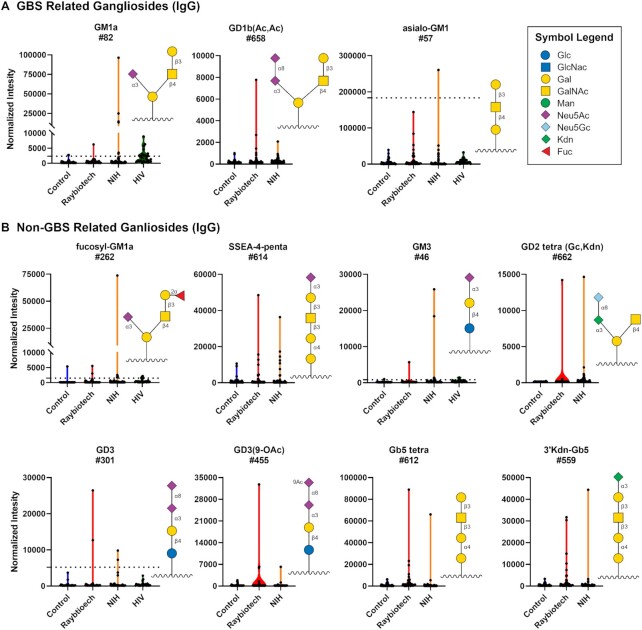
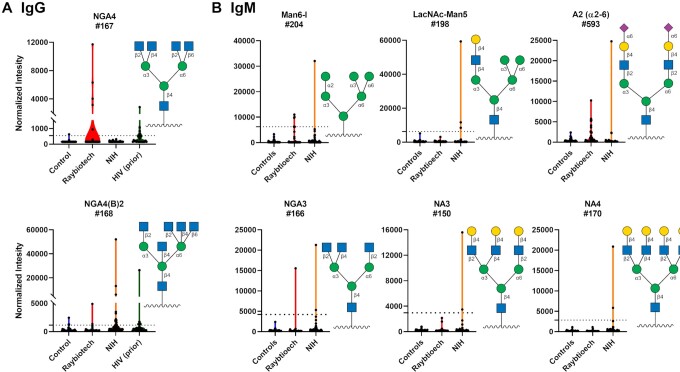
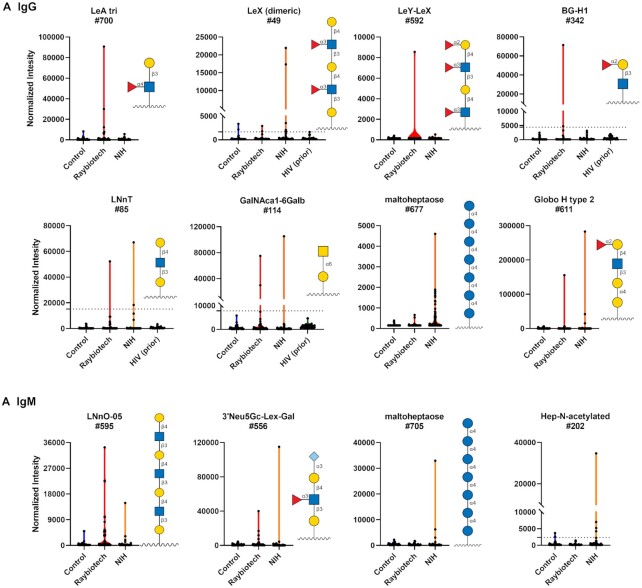
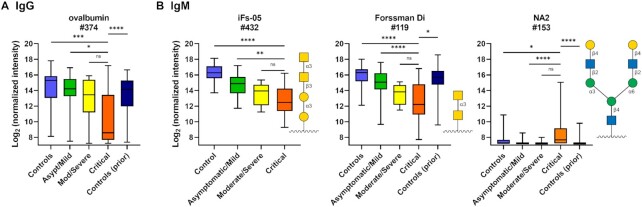
Our immune system is critical for preventing and treating SARS-CoV-2 infections, but aberrant immune responses can have deleterious effects. While antibodies to glycans could recognize the virus and influence the clinical outcome, little is known about their roles. Using a carbohydrate antigen microarray, we profiled serum antibodies in healthy control subjects and COVID-19 patients from two separate cohorts. COVID-19 patients had numerous autoantibodies to self-glycans, including antiganglioside antibodies that can cause neurological disorders. Additionally, nearly all antiglycan IgM signals were lower in COVID-19 patients, indicating a global dysregulation of this class of antibodies. Autoantibodies to certain N-linked glycans correlated with more severe disease, as did low levels of antibodies to the Forssman antigen and ovalbumin. Collectively, this study indicates that expanded testing for antiglycan antibodies could be beneficial for clinical analysis of COVID-19 patients and illustrates the importance of including host and viral carbohydrate antigens when studying immune responses to viruses.


Figures

Figure 1.
Figure 1.
Average IgG and IgM antibody signals to all glycans. (A) Box and whisker plots of the average array signals (log-transformed base 2) to all array components for IgG and IgM antibodies from control and COVID-19 serum samples. Mean IgG of control samples was 9.21 raw fluorescence units (RFU) on a log2 scale. Mean IgG signal for the Raybiotech COVID-19 cohort was 9.30, and the mean of NIH COVID-19 cohort was 8.90. An unpaired t test with Welch's correction showed no significant difference between mean IgG values of the controls and Raybiotech cohort and a small difference between the controls and NIH COVID-19 cohort IgG values (*, P = 0.0250). Mean IgM of controls was 12.41. Mean IgM of Raybtioech COVID-19 cohort was 11.21. Mean IgM of NIH COVID-19 cohort was 10.83. Unpaired t test with Welch's correction for mean IgM values was significant for both COVID-19 cohorts compared to controls (****, P < 0.0001). (B) Box and whisker plots of the average array signals for IgM and IgG of a select age range of patients. ns, not significant. Boxes depict quartiles and whiskers depict the min and max.
Figure 2.
Figure 2.
Differences between COVID-19 patients and controls. (A). Volcano plots with the fold change (log2) for the average Raybiotech COVID-19 patient signal relative to the controls on the x-axis and the negative P-value (log10) on the y-axis. Dots above the dashed line were statistically significant using a false discovery rate of 20%. (B) Box and whisker plots of the average array signals (log-transformed base 2) to LacNAc glycan array components for IgG antibodies from control and Raybiotech and NIH COVID-19 serum samples. Also, plotted are the data from a previous studies analyzing healthy control samples and patients with HIV infection. See Materials and Methods for the method of discovery and statistical analysis. Each row was analyzed individually, without assuming a consistent SD. *, P < 0.05; **, P < 0.01; ***, P < 0.001; and ****, P < 0.0001; ns, not significant. Glycan structures were created using GlycoGlyph (45). Boxes depict quartiles and whiskers depict the min and max.
Figure 3.
Figure 3.
Abnormally high IgG signals for selected glycan families. (A) Heat map depicting the abnormally high IgG signals for selected self-glycans. Glycans in rows, and patients in columns. Blue boxes represented high signals. (B) Bar graphs comparing the number of abnormally high IgG signals for self-glycans among the three cohorts. (C) Bar graphs comparing the number of abnormally high IgG signals for nonself glycans among the three cohorts. *, P < 0.05; **, P < 0.01; and ***, P < 0.001; ns, not significant. Boxes depict quartiles and whiskers depict the min and max.
Figure 4.
Figure 4.
High antibody signals to select ganglioside glycans in COVID-19 patient serum. Violin plots showing high IgG signals to various gangliosides/glycolipids for COVID-19 patients from Raybiotech and NIH versus controls, with each point representing data from an individual patient. Where available, graphs also include data from a prior study analyzing antiglycan antibodies of HIV-infected patients (44). To compare high signals to a larger subset of healthy controls, the dashed lines represent 3 SD above the mean of 220 control samples from a previous study (43). (A) GBS-associated ganglioside and (B) other gangliosides/glycolipids. Glycan structures were created using GlycoGlyph (45).
Figure 5.
Figure 5.
High IgG and IgM signals to select N-linked glycans in COVID-19 patient serum. Violin plots show high antibody signals to select N-linked glycan array components for serum from COVID-19 patients compared to baseline signals seen in serum from controls, with each point representing data from an individual patient. Where available, graphs also include data from a prior study analyzing antiglycan antibodies of HIV-infected patients (44). To compare high signals to a larger subset of healthy controls, the dashed lines represent 3 SD above the mean of 220 control samples from a previous study (43). (A) IgG. (B) IgM. See symbol legend in Fig. 4. Glycan structures were created using GlycoGlyph (45).
Figure 6.
Figure 6.
High antibody signals to self-glycans in COVID-19 patient serum. Violin plots show high antibody signals to select self glycans for serum from COVID-19 patients compared to baseline signals seen in serum from control donors, with each point representing data from an individual patient. Where available, graphs also include data from a prior study analyzing antiglycan antibodies of HIV-infected patients (44). To compare high signals to a larger subset of healthy controls, the dashed lines represent 3 SD above the mean of 220 control samples from a previous study (43). (A) IgG. (B) IgM. See symbol legend in Fig. 4. Glycan structures were created using GlycoGlyph (45).
Figure 7.
Figure 7.
Antiglycan IgG and IgM antibody signals that correlate with disease severity. (A) Box and whisker plots of the average IgG signals (log-transformed base 2) to ovalbumin for controls, NIH COVID-19 patients designated as either asymptomatic/mild, moderate/severe, or critical, and controls from a prior study. (B) Box and whisker plots of the average array IgM signals (log-transformed base 2) to iso-Forssman, the Forssman disaccharide, and NA2 for controls, NIH COVID-19 patients designated as either asymptomatic/mild, moderate/severe, or critical, and controls from a prior study. Method of discovery is ANOVA using the step-up method of Benjamini and Hochberg with a false discovery rate (FDR) = 0.05 to account for multiple comparisons, and demonstration of consistent trends with increasing disease severity. *, P < 0.05; **, P < 0.01; ***, P < 0.001; and ****, P < 0.0001. See symbol legend in Fig. 4. Glycan structures were created using GlycoGlyph (45). Boxes depict quartiles and whiskers depict the min and max.

Update of

References

    1. Wiersinga WJ, Rhodes A, Cheng AC, Peacock SJ, Prescott HC. 2020. Pathophysiology, transmission, diagnosis, and treatment of coronavirus disease 2019 (COVID-19): a review. JAMA. 324(8):782–793. - PubMed
    1. Davido B, Seang S, Tubiana R, de Truchis P. Post-COVID-19 chronic symptoms: a postinfectious entity?. Clin Microbiol Infect. 26:1448–1449. - PMC - PubMed
    1. Carfì A, Bernabei R, Landi F, Gemelli Against COVID-19 Post-Acute Care Study Group . 2020. Persistent symptoms in patients after acute COVID-19. JAMA. 324(6):603–605. - PMC - PubMed
    1. Weerahandi H, et al. . 2021. Post-discharge health status and symptoms in patients with severe COVID-19. J Gen Intern Med. 36:738–745. - PMC - PubMed
    1. Xiang F, et al. . 2020. Antibody detection and dynamic characteristics in patients with COVID-19. Clin Infect Dis. 71:1930–1934. - PMC - PubMed