. 2021 Aug;35(8):e2021GB006979.
doi: 10.1029/2021GB006979. Epub 2021 Aug 25.

Probing the Bioavailability of Dissolved Iron to Marine Eukaryotic Phytoplankton Using In Situ Single Cell Iron Quotas

Affiliations

Probing the Bioavailability of Dissolved Iron to Marine Eukaryotic Phytoplankton Using In Situ Single Cell Iron Quotas

Yeala Shaked et al. Global Biogeochem Cycles. 2021 Aug.

Abstract

We present a new approach for quantifying the bioavailability of dissolved iron (dFe) to oceanic phytoplankton. Bioavailability is defined using an uptake rate constant (kin-app) computed by combining data on: (a) Fe content of individual in situ phytoplankton cells; (b) concurrently determined seawater dFe concentrations; and (c) growth rates estimated from the PISCES model. We examined 930 phytoplankton cells, collected between 2002 and 2016 from 45 surface stations during 11 research cruises. This approach is only valid for cells that have upregulated their high-affinity Fe uptake system, so data were screened, yielding 560 single cell k in-app values from 31 low-Fe stations. We normalized k in-app to cell surface area (S.A.) to account for cell-size differences. The resulting bioavailability proxy (k in-app/S.A.) varies among cells, but all values are within bioavailability limits predicted from defined Fe complexes. In situ dFe bioavailability is higher than model Fe-siderophore complexes and often approaches that of highly available inorganic Fe'. Station averaged k in-app/S.A. are also variable but show no systematic changes across location, temperature, dFe, and phytoplankton taxa. Given the relative consistency of k in-app/S.A. among stations (ca. five-fold variation), we computed a grand-averaged dFe availability, which upon normalization to cell carbon (C) yields k in-app/C of 42,200 ± 11,000 L mol C-1 d-1. We utilize k in-app/C to calculate dFe uptake rates and residence times in low Fe oceanic regions. Finally, we demonstrate the applicability of k in-app/C for constraining Fe uptake rates in earth system models, such as those predicting climate mediated changes in net primary production in the Fe-limited Equatorial Pacific.

Keywords: iron bioavailability; iron limited phytoplankton; iron uptake rates; single cell iron quota; standardized proxy for availability.


Conflict of interest statement

The authors declare no conflicts of interest relevant to this study.

Figures

Figure 1
Figure 1
Dataset of single cell Fe quota collected from 2002 to 2016 during eight research projects. Cruise stations plotted on a map of surface dFe concentrations estimated by PISCES model. Stations are colored according to the nutrient limitation index of Browning et al. (2017) using the observed nutrient concentrations. The dataset was screened and only Fe‐limited stations were included in the assessment of dFe bioavailability. Cruise data used for our study were based on the following publications: (SoFeX: Coale et al., ; Twining et al., ; Twining et al., 2004b) (EB04: Brzezinski et al., ; Kaupp et al., ; Selph et al., ; Twining et al., 2011) (FeCycle II: Boyd et al., ; Ellwood et al., ; King et al., ; Wilhelm et al., 2013) (NAZT: Hatta et al., ; Sedwick et al., ; Twining et al., , , 2015b) (GeoMics: Chappell et al., ; Twining et al., 2021) (IrnBru: Boiteau et al., ; Cohen et al., ; Lampe et al., ; Mellett et al., ; Till et al., 2019) (EPZT: Boiteau et al., ; Moffett & German, ; Twining et al., 2021) (IO9N: Baer et al., ; Twining et al., 2019).
Figure 2
Figure 2
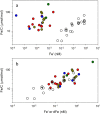
Comparison of iron quotas measured in ocean phytoplankton (colored symbols) or laboratory cultures (white symbols) as a function of Fe concentration. Quotas are plotted either against (a) Fe', as calculated either for EDTA‐buffered media or for natural seawater, or (b) calculated Fe' for laboratory data and measured dFe for ocean samples. Ocean phytoplankton were collected from the South Pacific (red), North Pacific (blue), coastal California current (green), and the North Atlantic (brown). Data are from (Buck et al., , ; Chappell et al., ; Mellett et al., ; Twining et al., , , 2021). Laboratory phytoplankton data are from (Sunda & Huntsman, 1995). Note that in a oceanic Fe' is calculated from speciation measurements that do not account for short term photochemically produced Fe'.
Figure 3
Figure 3
Proportionality between k in‐app of individual cells (L cell−1 d−1) and their respective cell surface area (μm2). Logged data from several cruises: (a) FeCycle II, (b) EB04, (c) EPZT, and (d) SOFeX. Scales are identical for all graphs and major cell types are shown as different symbols. Tight proportionality between k in‐app and cell surface area is deduced from the near unity (1) slope values and the high correlation coefficients (See Section S3 for further details).
Figure 4
Figure 4
Station‐average k in‐app/S.A. (surface area normalized dFe uptake rate constant), plotted against dissolved Fe concentrations. The Fe‐limitation status of the population is indicated by symbol shading (black: strong Fe limitation, gray: mild Fe limitation, white: no primary Fe limitation). Symbols are means ±SE for all cells at the Fe‐limited stations. Dashed and dotted lines indicated geometric mean and 95% CI k in‐app/S.A. across all Fe‐limited stations. Symbols for individual cruises are: SOFeX‐circle, FeCycle II‐triangle, EB04‐inverted triangle, EPZT‐square, GeoMICS‐diamond, IrnBru‐hexagon, IO9N‐star, NAZT‐X.
Figure 5
Figure 5
Summary of dFe bioavailability proxy (k in‐app/ surface area [S.A.]) obtained in this study, shown individually for 560 single Fe‐limited cells (a) and averaged (geometric means) per station (b). These values were obtained for Fe‐limited phytoplankton from six different ocean regions, with temperatures ranging from −0.7°C to 26°C, and dFe concentrations spanning from 0.05 to 0.6 nM (Figure 1, Table 1). The “bioavailability envelope” predicted from laboratory cultures with defined Fe‐complexes (Lis, Kranzler, et al., 2015) is plotted for comparison (k in/S.A = 2.4 × 10−9 and 2.4 × 10−12 L μm−2 d−1 for Fe′ and desferrioxamine B [DFB], respectively). Also shown are estimates of dFe bioavailability of natural seawater probed by cultured Fe‐limited phytoplankton (Shaked et al., 2020), under either dim or natural light (k in‐app/S.A = 3.6 × 10−11 and 2.1 × 10−10 L μm−2 d−1, respectively). The grand mean dFe availability calculated here is plotted as a blue line (kin‐app/S.A = 3.2 ± 0.82 × 10−10 L μm−2 d−1).
Figure 6
Figure 6
C‐normalized Fe uptake constants for individual Fe‐limited stations included in the dFe availability analysis. Rate constants are for the same stations as in Figure 5, but Fe uptake is normalized to cellular C rather than cell surface area. Symbols are geometric means ± SE for all of the cells at each station. The blue line indicates the geometric mean k in‐app/C (42,200 ± 11,000 L mol C−1 d−1). As in Figure 5, the equivalent boundaries of the bioavailability envelope (Lis, Kranzler, et al., 2015) were plotted as well as average constants for natural seawater under dim and high light (Shaked et al., 2020). These reference values were converted from S.A. normalized to C‐normalized values using the average C/surface area [S.A.] relationship for all cells analyzed in this study (1.4 × 1014 μm2 mol C−1).
Figure 7
Figure 7
Application of the bioavailability proxy k in‐app/C to calculate Fe uptake rates in the ocean. We compare uptake rates measured in several studies (colored bars) with uptake rates calculated according to Equation 3 (hatched bars), using reported dFe and POC (or Chl). Studies are color coded: Blue‐Ellwood et al., (2020) Green‐Mellett et al., (2018), and Red‐King et al., (2012).
Figure 8
Figure 8
Utilization of k in‐app/C values to constrain model predictions for the equatorial Pacific Ocean. In the upper panel, red circles show the average k in‐app/C of low‐Fe stations from the EB04 cruise along the equator. Stations with dFe below the detection limit have been removed. The black and blue symbols show k in‐app/C derived from uptake rates used in the model of Tagliabue et al., (2020), corresponding to the stations location. The model was run assuming either high uptake scenarios (black squares) and or low uptake scenarios (blue diamonds). In the lower panel, the cruise track was plotted over satellite‐measured chlorophyll (Chl, from Brzezinski et al., 2011), and relevant stations are highlighted in white circles, with cruise station numbers indicated.

Similar articles

Cited by

References

    1. Allen, A. E. , LaRoche, J. , Maheswari, U. , Lommer, M. , Schauer, N. , Lopez, P. J. , & Bowler, C. (2008). Whole‐cell response of the pennate diatom Phaeodactylum tricornutum to iron starvation. Proceedings of the National Academy of Sciences of the USA, 105(30), 10438–10443. 10.1073/pnas.0711370105 - DOI - PMC - PubMed
    1. Anderson, R. F. (2020). GEOTRACES: Accelerating research on the marine biogeochemical cycles of trace elements and their isotopes. Annual Review of Marine Science, 12(1), 49–85. 10.1146/annurev-marine-010318-095123 - DOI - PubMed
    1. Aumont, O. , Ethé, C. , Tagliabue, A. , Bopp, L. , & Gehlen, M. (2015). PISCES‐v2: An ocean biogeochemical model for carbon and ecosystem studies. Geoscientific Model Development, 8(8), 2465–2513. 10.5194/gmd-8-2465-2015 - DOI
    1. Baer, S. E. , Rauschenberg, S. , Garcia, C. A. , Garcia, N. S. , Martiny, A. C. , Twining, B. S. , & Lomas, M. W. (2019). Carbon and nitrogen productivity during spring in the oligotrophic Indian Ocean along the GO‐SHIP IO9N transect. Deep‐Sea Research Part II: Topical Studies in Oceanography, 161. 10.1016/j.dsr2.2018.11.008 - DOI
    1. Barbeau, K. , Rue, E. L. , Bruland, K. W. , & Butler, A. (2001). Photochemical cycling of iron in the surface ocean mediated by microbial iron(III)‐binding ligands. Nature, 413(6854), 409–413. 10.1038/35096545 - DOI - PubMed

LinkOut - more resources