. 2022 Jul 5:13:921900.
doi: 10.3389/fimmu.2022.921900. eCollection 2022.

Single-cell RNA Sequencing Analysis Reveals New Immune Disorder Complexities in Hypersplenism

Affiliations

Single-cell RNA Sequencing Analysis Reveals New Immune Disorder Complexities in Hypersplenism

Hai-Chao Zhao et al. Front Immunol. .

Abstract

Hypersplenism (HS) is a concomitant symptom of liver or blood disease. Not only does the treatment of HS face challenges, but the transcriptome of individual cells is also unknown. Here, the transcriptional profiles of 43,037 cells from four HS tissues and one control tissue were generated by the single-cell RNA sequencing and nine major cell types, including T-cells, B-cells, NK cells, hematopoietic stem cells, neutrophil cells, mast cells, endothelial cells, erythrocytes, and dendritic cells were identified. Strikingly, the main features were the lack of CCL5+ B-cells in HS and the presence of SESN1+ B cells in HS with hepatocellular carcinoma (HS-HCC). In cell-cell interaction analysis, CD74-COPA and CD94-HLA-E in HS were found to be up-regulated. We further explored HS-specifically enriched genes (such as FKBP5, ADAR, and RPS4Y1) and found that FKBP5 was highly expressed in HCC-HS, leading to immunosuppression. Taken together, this research provides new insights into the genetic characteristics of HS via comprehensive single-cell transcriptome analysis.

Keywords: B-cells; T-cells; hypersplenism; immune disorder; single-cell RNA sequencing.


Conflict of interest statement

The authors declare that the research was conducted in the absence of any commercial or financial relationships that could be construed as a potential conflict of interest.

Figures
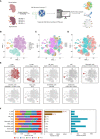
Figure 1
Figure 1
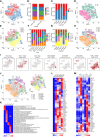
Identification of cell clusters in HS samples with scRNA-seq. (A) Schematic representation showing the collection and processing of fresh surgical resection specimens from four HS and one normal tissue for scRNA-seq. (B) t-SNE plot of the 43,037 cells illustrating nine cell clusters, with each cluster color coded to indicate the associated cell types. (C) t-SNE plot of the cell distribution in different HS samples. (D) t-SNE plot of the cell distribution in health control and HS group. (E) t-SNE plot of the cell cluster, color coding for the expression of the marker genes (gray to red) for the indicated cell subtype. (F) Data of the nine clusters from five samples (from left to right): the fraction of cells originating from each patient, the number of cells, and box plots of the number of UMIs and genes.
Figure 2
Figure 2
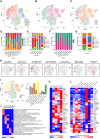
Identification of T-cell clusters. (A) The cell distribution of CD4+ T-cells and CD8+ T-cells. (B) The proportions of CD4+ T-cells and CD8+ T-cells in different splenic samples. (C) The proportions of CD4+ T-cells and CD8+ T-cells in each splenic sample. (D) t-SNE plot of the B-cell distribution in health control and HS group. (E) The t-SNE plot revealing seven T cell clusters. (F) Relative proportion of each HS across different T-cell clusters as indicated. (G) Relative proportion of each T-cell subcluster in five splenic samples as indicated. (H) t-SNE plot of T-cells from 5 splenic samples (indicated by color). (I) t-SNE plot of T-cell subclusters, color coding for the expression of the marker genes (gray to red) for the indicated cell subtype. (J) t-SNE plot showed specific T-cells from different splenic samples. (K) GSEA enrichment of T-cells in different splenic samples. (L) The heatmap of the expression of T-cells specific genes on each splenic sample. (M) The heatmap of the expression of T-cells specific genes on each cell subcluster.
Figure 3
Figure 3
Identification of B-cell clusters. (A) t-SNE plotting revealing nine B-cell clusters. (B) t-SNE plot of the B-cell distribution in the normal control and HS group. (C) t-SNE plot of B cell subtype in different samples. (D) Relative proportion of each HS across different B-cell clusters as indicated. (E) Relative proportion of each B-cell subcluster in five samples as indicated. (F) Relative proportions of healthy controls and HS in different B cell clusters. (G) Relative proportion of the B-cell subclusters in the normal control and HS group. (H) t-SNE plot of B-cell cluster, color coding for the expression of the marker genes (gray to red) for the indicated cell subtype. (I) t-SNE plot showing specific B-cells from different splenic samples. (J) GSEA enrichment of B-cells in different splenic samples. (K) The heatmap of the expression of B-cell specific genes on each splenic sample. (L) The heatmap of the expression of B-cells specific genes on each cell subcluster.
Figure 4
Figure 4
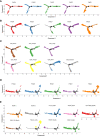
Cell evolution trajectory. (A) Evolution trajectory of all cells in different samples. (B) Evolution trajectory of T-cells in different samples. (C) Evolution trajectory of each T-cell subcluster. (D) Evolution trajectory of B-cells in different samples. (E) Evolution trajectory of each B-cell subcluster.
Figure 5
Figure 5
The dense network and multiple regulatory immune responses in each splenic sample. (A) Overview of selected ligand-receptor interactions of nine cell subtypes. (B) Overview of selected ligand-receptor interactions of T-cells, B-cells, and other cell types.
Figure 6
Figure 6
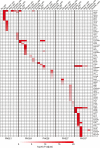
Specific marker genes for different HS samples in other cell clusters.
Figure 7
Figure 7
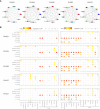
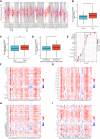
Verification using TCGA data for FKBP5. (A) Pan-cancer expression of KFBP5. (B) Box plot showing the expression of KFBP5 mRNA in primary HCC tissues and normal tissues. (C) Box plot showed the association between KFBP5 expression and fibrosis Ishak score. (D) Box plot reflecting the association between KFBP5 expression and tissue inflammation. (E) Correlations between the relative abundance of 24 immune cells and expression level of KFBP5. The size of the dots represents the absolute Spearman’s correlation coefficient values. (F) Heatmap showing Spearman correlations between Expression (exp) of FKBP5 and lymphocytes (Y-axis) across human cancers (X-axis). (G) Heatmap showing Spearman correlations between expression (exp) of FKBP5 and MHC molecules (Y-axis) across human cancers (X-axis). (H) Heatmap showing Spearman correlations between expression (exp) of FKBP5 and immune-stimulators (Y-axis) across human cancers (X-axis). (I) Heatmap showing Spearman correlations between Expression (exp) of FKBP5 and immune-inhibitors (Y-axis) across human cancers (X-axis). ***P< 0.001, **P< 0.01, *P< 0.05, ns, no significance.

Similar articles

Cited by

References

    1. McCormick PA, Murphy KM. Splenomegaly, Hypersplenism and Coagulation Abnormalities in Liver Disease. Bailliere's Best Pract Res Clin Gastroenterol (2000) 14:1009–31. doi: 10.1053/bega.2000.0144 - DOI - PubMed
    1. Crosby WH. Hypersplenism. Medical Times (1962) 109(1):29. doi: 10.1146/annurev.me.13.020162.001015 - DOI - PubMed
    1. Liu X, Chen Z, Yu M, Zhou W, Zhi X, Li T. Safety of Simultaneous Hepatectomy and Splenectomy in the Treatment of Hepatocellular Carcinoma Complicated With Hypersplenism: A Meta-Analysis. Gastroenterol Res Pract (2019) 2019:9065845. doi: 10.1155/2019/9065845 - DOI - PMC - PubMed
    1. Lv Y, Lau WY, Li Y, Deng J, Han X, Gong X, et al. . Hypersplenism: History and Current Status. Exp Ther Med (2016) 12:2377–82. doi: 10.3892/etm.2016.3683 - DOI - PMC - PubMed
    1. O'Reilly RA. Splenomegaly in 2,505 Patients at a Large University Medical Center From 1913 to 1995. 1963 to 1995: 449 Patients. West J Med (1998) 169:88–97. doi: 10.1620/tjem.185.281 - DOI - PMC - PubMed

Publication types

Substances