

Human Hepatic CD56bright NK Cells Display a Tissue-Resident Transcriptional Profile and Enhanced Ability to Kill Allogenic CD8+ T Cells
- PMID: 35865550
- PMCID: PMC9295839
- DOI: 10.3389/fimmu.2022.921212
Human Hepatic CD56bright NK Cells Display a Tissue-Resident Transcriptional Profile and Enhanced Ability to Kill Allogenic CD8+ T Cells
Abstract
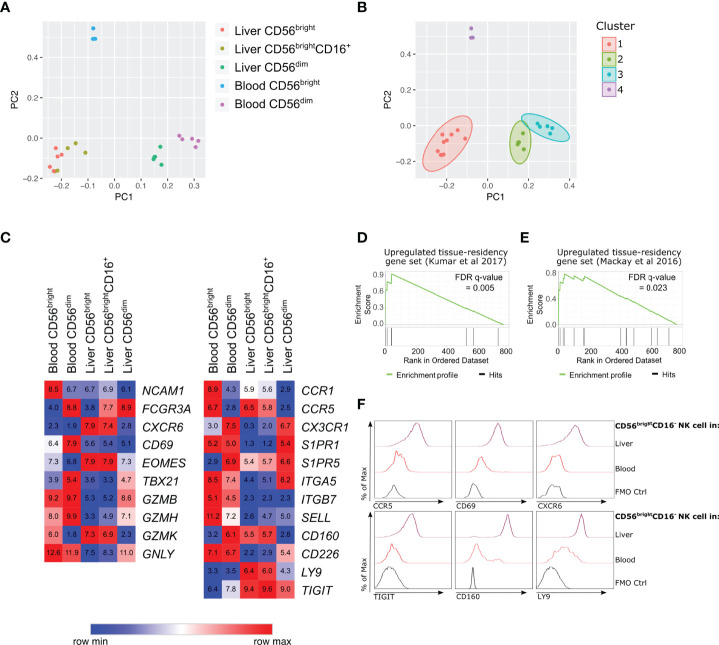
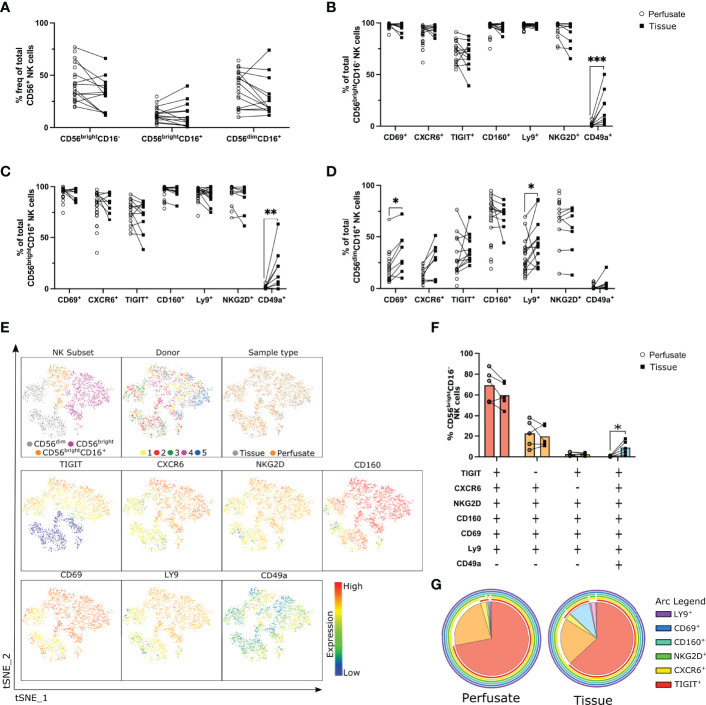
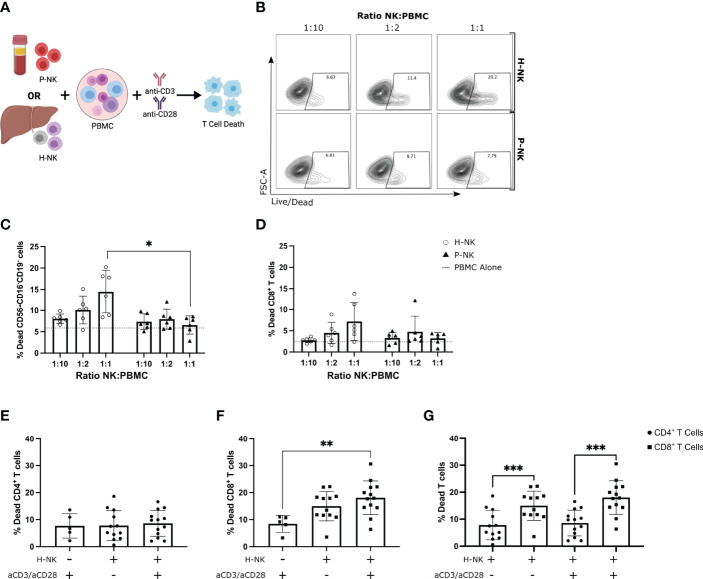
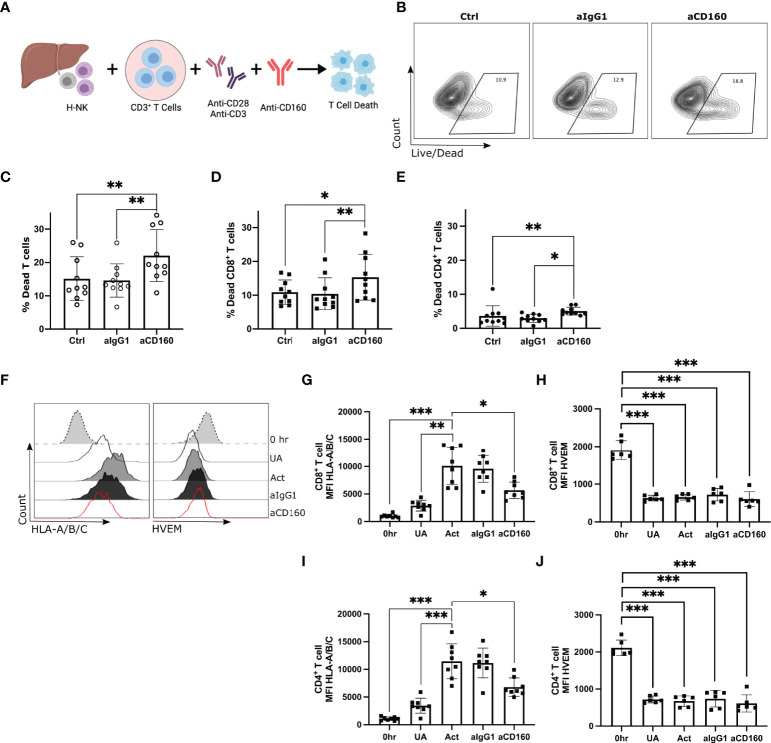
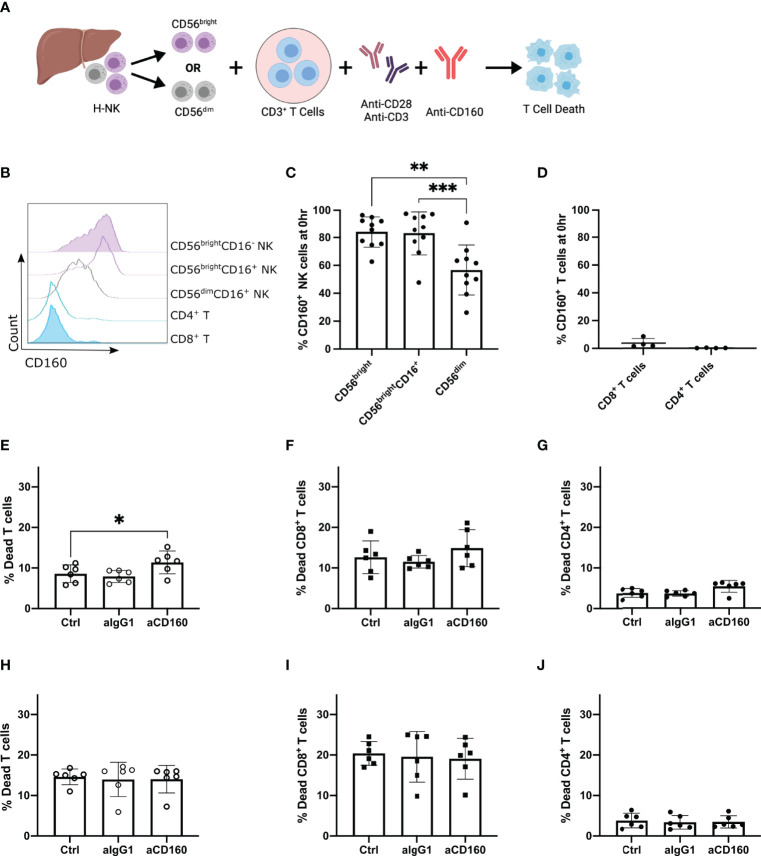
Liver-resident CD56brightCD16- natural killer (NK) cells are enriched in the human liver and are phenotypically distinct from their blood counterparts. Although these cells are capable of rapid cytotoxic effector activity, their functional role remains unclear. We hypothesise that they may contribute to immune tolerance in the liver during transplantation. RNA sequencing was carried out on FACS sorted NK cell subpopulations from liver perfusates (n=5) and healthy blood controls (n=5). Liver-resident CD56brightCD16+/- NK cells upregulate genes associated with tissue residency. They also upregulate expression of CD160 and LY9, both of which encode immune receptors capable of activating NK cells. Co-expression of CD160 and Ly9 on liver-resident NK cells was validated using flow cytometry. Hepatic NK cell cytotoxicity against allogenic T cells was tested using an in vitro co-culture system of liver perfusate-derived NK cells and blood T cells (n=10-13). In co-culture experiments, hepatic NK cells but not blood NK cells induced significant allogenic T cell death (p=0.0306). Allogenic CD8+ T cells were more susceptible to hepatic NK cytotoxicity than CD4+ T cells (p<0.0001). Stimulation of hepatic CD56bright NK cells with an anti-CD160 agonist mAb enhanced this cytotoxic response (p=0.0382). Our results highlight a role for donor liver NK cells in regulating allogenic CD8+ T cell activation, which may be important in controlling recipient CD8+ T cell-mediated rejection post liver-transplant.
Keywords: CD8+ T cell; NK cell; liver; resident; tolerance; transplant.
Copyright © 2022 Jameson, Harmon, Santiago, Houlihan, Gallagher, Lynch, Robinson and O’Farrelly.
Conflict of interest statement
The authors declare that the research was conducted in the absence of any commercial or financial relationships that could be construed as a potential conflict of interest.
Figures
Similar articles
-
Tissue-resident Eomes(hi) T-bet(lo) CD56(bright) NK cells with reduced proinflammatory potential are enriched in the adult human liver.Eur J Immunol. 2016 Sep;46(9):2111-20. doi: 10.1002/eji.201646559. Eur J Immunol. 2016. PMID: 27485474
-
Transcriptional signature of CD56bright NK cells predicts favourable prognosis in bladder cancer.Front Immunol. 2025 Jan 14;15:1474652. doi: 10.3389/fimmu.2024.1474652. eCollection 2024. Front Immunol. 2025. PMID: 39877370 Free PMC article.
-
A CD8α(-) subpopulation of macaque circulatory natural killer cells can mediate both antibody-dependent and antibody-independent cytotoxic activities.Immunology. 2011 Nov;134(3):326-40. doi: 10.1111/j.1365-2567.2011.03493.x. Immunology. 2011. PMID: 21978002 Free PMC article.
-
Human Circulating and Tissue-Resident CD56(bright) Natural Killer Cell Populations.Front Immunol. 2016 Jun 30;7:262. doi: 10.3389/fimmu.2016.00262. eCollection 2016. Front Immunol. 2016. PMID: 27446091 Free PMC article. Review.
-
The biology of human natural killer-cell subsets.Trends Immunol. 2001 Nov;22(11):633-40. doi: 10.1016/s1471-4906(01)02060-9. Trends Immunol. 2001. PMID: 11698225 Review.
Cited by
-
Role of liver-resident NK cells in liver immunity.Hepatol Int. 2025 Apr;19(2):315-324. doi: 10.1007/s12072-025-10778-7. Epub 2025 Feb 1. Hepatol Int. 2025. PMID: 39893278 Free PMC article. Review.
-
Mechanisms of Tolerance Induction in Liver Transplantation: Lessons Learned from Fetomaternal Tolerance, Autoimmunity and Tumor Immunity.Int J Mol Sci. 2024 Aug 28;25(17):9331. doi: 10.3390/ijms25179331. Int J Mol Sci. 2024. PMID: 39273280 Free PMC article. Review.
-
Gut Microbiota and Hepatocellular Carcinoma: Metabolic Products and Immunotherapy Modulation.Cancer Med. 2025 May;14(9):e70914. doi: 10.1002/cam4.70914. Cancer Med. 2025. PMID: 40314129 Free PMC article. Review.
-
CD160 receptor in CLL: Current state and future avenues.Front Immunol. 2022 Nov 7;13:1028013. doi: 10.3389/fimmu.2022.1028013. eCollection 2022. Front Immunol. 2022. PMID: 36420268 Free PMC article. Review.
-
Understanding Liver Transplantation Outcomes Through the Lens of Its Tissue-resident Immunobiome.Transplantation. 2025 Jul 1;109(7):e349-e361. doi: 10.1097/TP.0000000000005303. Epub 2025 Jan 9. Transplantation. 2025. PMID: 39780303 Review.
References
-
- Doherty D, Suzanne N, Madrigal-Estebas L, McEntee G, Traynor O, Hegarty JE, et al. . The Human Liver Contains Multiple Populations of NK Cells, T Cells, and CD3+CD56+ Natural T Cells With Distinct Cytotoxic Activities and Th1, Th2, and Th0 Cytokine Secretion Patterns. J Immunol (1999) 163:2314–21. - PubMed
Publication types
MeSH terms
Substances
LinkOut - more resources
Full Text Sources
Medical
Molecular Biology Databases
Research Materials